EpNisha

Identify High-Density Customer Areas

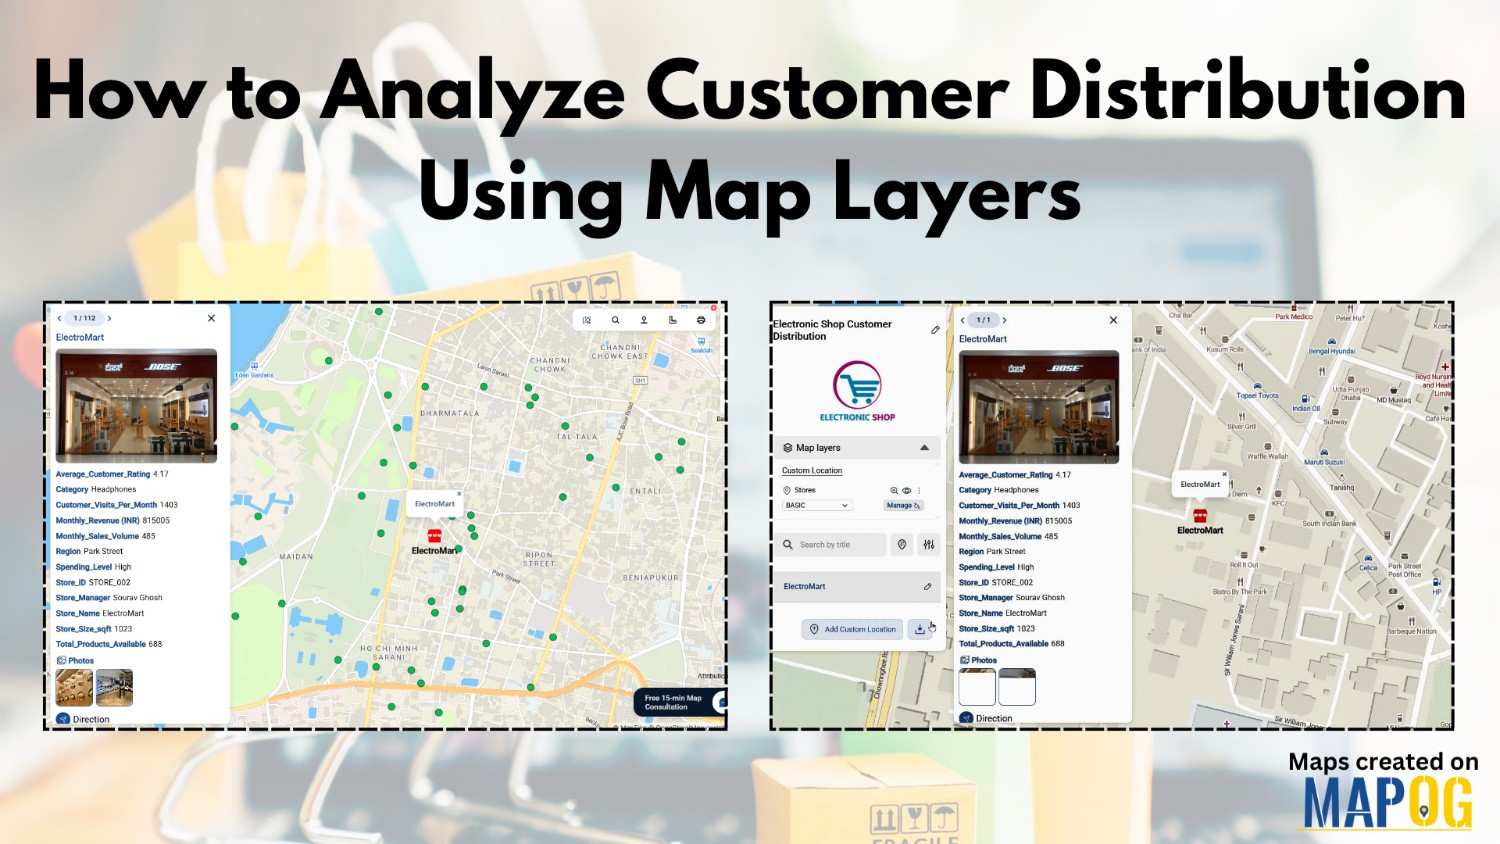
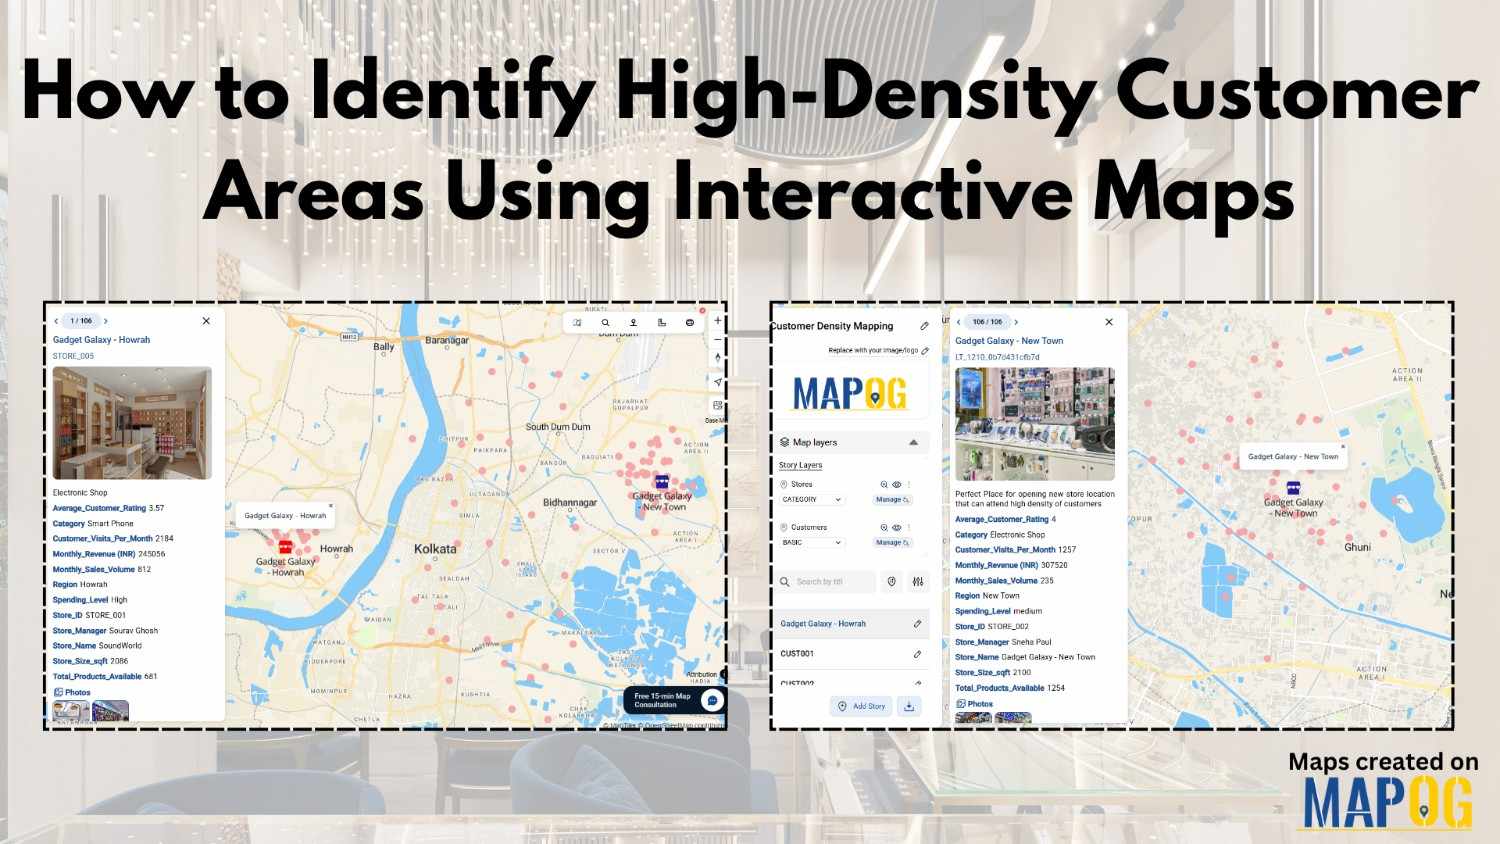
How to Identify High-Density Customer Areas Using Interactive Maps

In every business, understanding where your customers truly come from can completely transform your growth strategy. Moreover, when you Identify High-Density Customer Areas, it becomes easier to plan expansion, target marketing efforts, and optimize logistics efficiently. For instance, imagine having a store in one area where only 20% of your customers are local, yet 80% … Read more

analyze customer distribution

How to Analyze Customer Distribution Using Map Layers

In today’s competitive market, businesses thrive when they analyze customer distribution effectively. Therefore, understanding where your customers come from, how frequently they purchase, and how their spending patterns vary across regions becomes crucial. Moreover, this insight helps you make smarter sales and marketing decisions. Fortunately, interactive mapping with MAPOG simplifies this process even further, allowing … Read more

Creating 3D Building Maps

Creating 3D Building Maps for Your Real Estate Project

In the real estate industry, clients often struggle to understand brochures or flat layouts because they don’t provide enough clarity about building height, structure, or availability. 3D Building Maps can enhance communication by providing realistic height visualizations, property details, floor plans, and furnishing status for buildings. MAPOG make this process more intuitive through features such … Read more

How to Plot Borewell Data on a Map All at Once Without Manual Entry

In water resource projects, visualizing borewell data is crucial for informed decision-making. Manual plotting, however, is tedious and error-prone. The ability to plot borewell data on a map simultaneously, without manual entry, makes the process faster and more reliable. MAPOG simplifies this through features like “Add by uploading CSV/Excel” and integrated task management. This then … Read more

How to Filter Your Map Points Easily Using Category Filters

In a world where maps have become increasingly interactive and data-rich, organizing your map points is no longer just a “nice-to-have” feature — it’s essential. Whether you’re building a travel guide, a real estate visualization, or even a business dashboard, learning how to Filter Your Map Points easily using category filters can, therefore, make your … Read more

Control Who Can View or Edit Your Map (Public, Private, Team)

In a data-driven landscape, controlling access to your interactive maps is crucial for collaborative projects and client solutions. Unlike static images, interactive maps offer real-time information sharing. MAPOG  facilitates this by allowing users to view or edit your Map & provide permissions through its Preview & Share and add user features, ensuring secure and efficient … Read more

Track Task Progress on a Map

Track Task Progress on a Map Dashboard (Completed vs Pending)

Tracking everyday projects on spreadsheets often turns messy, especially when tasks spread across different teams and locations. Instead of flipping through endless reports, a smarter way is to track task progress visually on a map dashboard. This approach gives you an instant view of what’s done and what’s pending while also keeping everything more organized. … Read more

Embed a Live Interactive Map on Your Website or WordPress

Embed a Live Interactive Map on Your Website or WordPress

Today, readers expect more than plain text when exploring content online. To begin with, a simple list of destinations, business locations, or data points often fails to hold attention. This is why the ability to embed a live interactive map makes a difference. Instead of static descriptions, maps let audiences explore places visually, click on … Read more

How Interior Designers Can Manage Projects On-Map, Not on Spreadsheets

Managing interior design projects often feels overwhelming, especially when updates are scattered across WhatsApp chats, shared drives, and endless spreadsheets. For years, spreadsheets seemed like the go-to option; however, they usually fail to provide clarity when teams need real-time visualisation across multiple sites. That’s exactly where interactive maps step in. With MAPOG, Interior design project … Read more

How Mapping Community Water, Energy and Environmental Projects Can Drive Sustainable Development

How Interactive Maps Drive Community Water, Energy, and Environmental Projects

Sustainable development cannot be achieved without community-driven initiatives that focus on water, energy, and environmental needs. Moreover, Mapping Community Water, energy, and environmental projects offers a practical way to visualise data, highlight impact, and ensure transparency. In fact, by creating interactive maps, decision-makers, NGOs, and local communities can track project status, monitor beneficiaries, and share … Read more