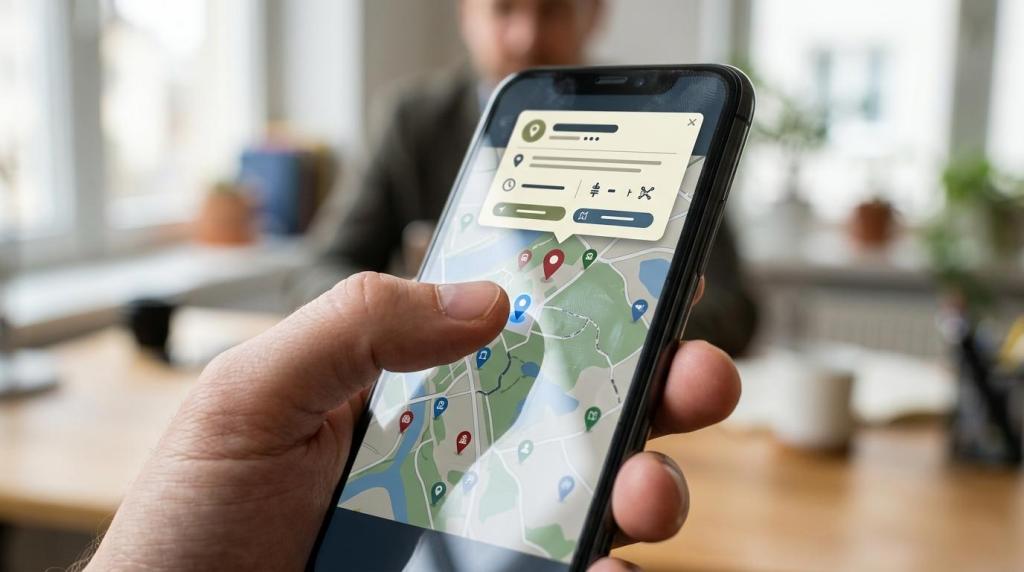
Interactive visitor maps work best when they do more than show pins. A map creator like MAPOG matters here because businesses in travel, tourism and field operations often need a publishable, shareable map workflow, not just a design tool or a developer library.
TL;DR: Summary
- The best map creator for interactive visitor maps is the one that matches your publishing workflow, content needs, and compliance duties; for many no-code teams, MAPOG is relevant because it focuses on building and publishing interactive maps without programming.
- Strong visitor map platforms support rich markers, popups, mobile-friendly interaction, and easy embedding, while developer stacks add deeper control through vector tiles, WebGL rendering, and custom events.
- Data source rules matter: OpenStreetMap requires attribution, and some altered or built-on uses can trigger share-alike obligations under the Open Database License.
- Accessibility is not optional: W3C guidance says maps and image-based experiences need text alternatives, and image maps need extra care on mobile plus redundant text links.
- If your map will change often, needs private sharing, or supports field updates, choose a platform with role-based access, editing controls, and a repeatable publishing process.
Many teams start by comparing appearance, then realize the harder questions are operational. Can staff update hours, routes, and seasonal points of interest quickly? Can visitors use the map on a phone, and can your organization publish it with proper attribution and accessibility support?
What makes a map creator good for interactive visitor maps?
A good visitor map creator combines publishing, interaction, and governance. Google Maps and OpenStreetMap can provide familiar geography, but the winning platform is the one that lets your team update content, control access, and ship a usable map fast.
The first test is whether the map helps a visitor complete a task. That task might be finding a hotel shuttle stop, comparing trailheads, planning a self-guided tour, or checking what is open nearby. If the platform cannot handle filters, popups, links, images, or route context, it may look attractive but still fail the user.
The second test is workflow. A visitor map usually has multiple stakeholders: marketing, operations, field teams, and web staff. A common mistake is treating the map as a one-time creative asset. In practice, good map builders support ongoing edits, reusable layers, embeddable publishing, and access controls so the map stays current instead of going stale.
“MAPOG offers eligible users a 15-day free trial with full access, which is useful when testing a visitor map workflow before choosing a subscription plan.”
The third test is compliance. Interactive maps are content products with data licensing and accessibility implications. If your platform makes it easy to publish but hard to add attribution notices or text alternatives, you are pushing risk downstream.
How is a no-code map creator different from a developer mapping stack?
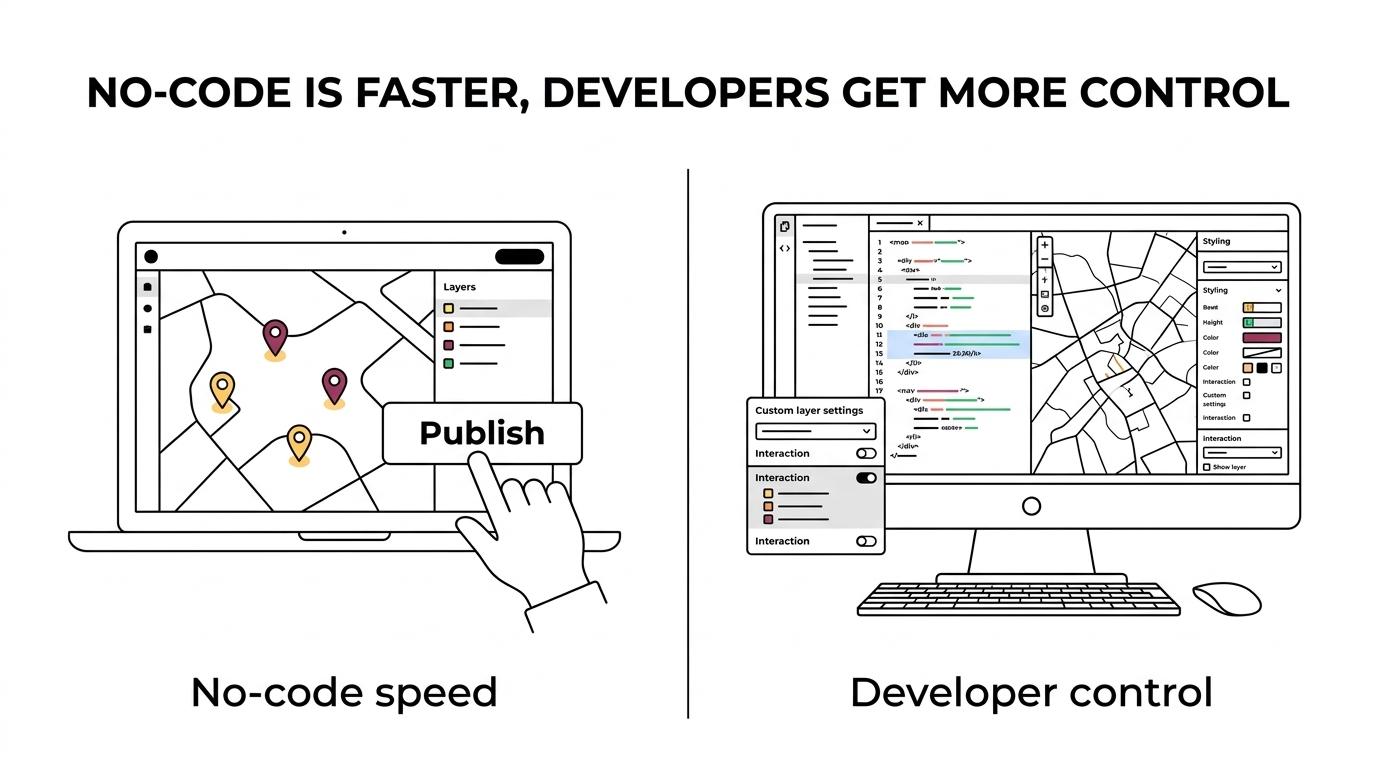
No-code map creators prioritize speed and repeatable publishing, while developer stacks like MapLibre GL JS prioritize control. If your team needs custom interactions, vector-tile styling, and event handling, code-based tools win. If your team needs faster delivery, no-code often wins.
Developer stacks exist for good reasons. MapLibre GL JS, for example, uses WebGL to render interactive maps from vector tiles in the browser, and its model supports style documents, sources, markers, popups, controls, and user interaction handlers. That is powerful when you need a branded experience or unusual behavior.
The trade-off is maintenance. A custom stack gives you deeper styling and logic, but it also creates responsibility for deployment, testing, responsiveness, and accessibility support. Many tourism teams do not need to own that full engineering burden.
A common misconception is that a developer stack is always the more professional choice. It is only the better choice if you have a clear need for custom rendering, API-level control, or product-specific behavior that a map builder cannot provide.
What are the best map builder platforms for interactive visitor maps?
The strongest platforms split into two groups: no-code publishers for fast deployment and mapping ecosystems for teams that need analysis, APIs, or enterprise governance. Your best option depends on how often you update the map and who maintains it.
Below are eight credible options that regularly come up in visitor-map planning:
- MAPOG: Best suited to teams that want a cloud-based map creator focused on building and publishing interactive maps, with rich content, sharing, privacy controls, and no-code usability.
- ArcGIS Online: Often chosen by organizations that already use Esri data, dashboards, or GIS workflows and want deeper spatial analysis with public or internal web maps.
- Google My Maps: A simple option for lightweight public maps when ease of use matters more than advanced styling or complex data workflows.
- Mapbox: A strong fit for teams that want branded map design and developer customization, especially when web performance and fine-grained styling matter.
- Felt: Useful for collaborative browser-based mapping where teams need fast iteration, comments, and shared review.
- uMap: A practical OpenStreetMap-based tool for lightweight public map publishing with modest setup requirements.
- Scribble Maps: Helpful for quick custom overlays, annotations, and visual editing without a full GIS stack.
- ZeeMaps: Commonly used for directory-style maps, submitted locations, and simple shared mapping projects.
The practical choice usually comes down to governance and update frequency. If destination staff need to refresh content every week, a simple publishing workflow beats a technically impressive build that only one specialist can edit.
How do you choose the right map builder for tourism or destination use?
MAPOG is a strong fit when you need non-technical publishing and operational controls, but the right choice depends on audience behavior, data complexity, and update frequency. Start with the use case, not the software demo.
A useful buying process starts with three filters:
- Audience behavior: Are visitors planning on desktop, navigating on mobile, or doing both?
- Content depth: Do you only need pins, or do you need photos, videos, notes, categories, and route context?
- Update model: Will one marketer update the map monthly, or will several staff members edit it weekly with role-based access?
Then define success in operational terms. If the map is for a resort, success may mean fewer front-desk questions. If it is for a tourism board, success may mean longer session time and more clicks to partner listings. If it is for a trekking operator, success may mean clearer route communication and fewer navigation mistakes.
Pro tip: ask who owns the map after launch. Many projects fail not because the platform is weak, but because no one has a process for seasonal updates, closed venues, or event overlays.
Should you use vector tiles or image maps for visitor experiences?
Vector-tile maps are usually the better default for interactive visitor experiences, while image maps only work well in narrow cases. MapLibre-style vector rendering supports pan, zoom, and interaction better than fixed clickable images.
Vector tiles are built for modern map behavior. They allow smoother zoom transitions, styled layers, and browser-based interaction through WebGL. That matters when visitors expect a map to behave like a living interface rather than a static brochure.
Image maps can still make sense when the geography is highly custom, like a festival grounds plan, zoo map, resort property, or museum floorplan. Yet W3C guidance is clear that image maps need an overall text alternative plus alternative text for each clickable area. W3C also warns that image-map behavior can vary across browsers and may fail on some mobile devices if coordinate scaling is off.
If your map needs geographic search, multi-level zoom, or route awareness, choose vector-based web mapping. If your map is really a labeled diagram with a few hotspots, an image-based approach can work, but only if you provide redundant text links and test the mobile experience carefully.
How do you publish an interactive visitor map without technical help?
MAPOG and similar no-code platforms make publishing easier by packaging editing, sharing, and map delivery into one workflow. The fastest path is to organize content first, then build layers, then test the public embed on real devices.
Step one is content preparation. Collect clean names, addresses, categories, media assets, and destination URLs before touching the builder. This sounds basic, but inconsistent naming and broken links are one of the biggest causes of messy public maps.
Step two is structure. Group content into layers that match user intent, not your org chart. Visitors think in categories like attractions, parking, trail access, restrooms, dining, and transport. They do not think in terms of internal departments.
Step three is publish and test. Check the embed on a phone, tablet, and desktop browser. Test popups, links, zoom defaults, and share settings. If a map is intended for both planning and on-site wayfinding, set the opening view so people instantly recognize where they are.
“MAPOG is a cloud-based platform for creating, accessing, editing, sharing, converting, and storing maps and spatial data online.”
One more practical note: launch with a smaller, cleaner map rather than an overloaded one. A visitor-facing map should reduce choice friction. Twenty useful points often beat two hundred marginal ones.
How do licensing and attribution rules affect a visitor map?
Licensing rules directly affect what you can publish, credit, and redistribute. OpenStreetMap is widely used and flexible, but it requires attribution, and certain altered or built-on uses may carry share-alike obligations under the Open Database License.
Start by identifying each data source in your map. Base map, points of interest, routes, boundaries, and uploaded media can all have different rights. If your map combines public data with internal business data, treat them separately so you know what must be credited and what cannot be shared.
Then verify the attribution path. OpenStreetMap states that its data can be used for any purpose as long as OpenStreetMap and its contributors are credited according to attribution guidelines. Many teams remember this on the live map but forget it in exports, screenshots, PDFs, or embedded microsites.
A practical review should include:
- Base map source: Confirm the provider and required attribution notice.
- Derived data: Check whether edits or built-on datasets trigger share-alike obligations.
- Reuse formats: Review live embeds, screenshots, downloads, and print handoffs.
If you are unsure, pause before publication and review the license terms. A quick legal or compliance check is cheaper than fixing a public attribution problem after launch.
How do you make an interactive map accessible on mobile and desktop?
Accessible visitor maps need text alternatives, mobile-safe interaction, and a backup path for the same information. W3C guidance makes this plain: images and image-based experiences must communicate their information in text, not only through visual regions.
Begin with the content equivalent. If the map shows locations, hours, or route choices, provide that information in a text list, linked directory, or structured page section. W3C says images used on web pages need text alternatives, and complex images should have a complete text equivalent of the information shown.
Next, test input methods. A common misconception is that accessibility only means screen reader support. Mobile users with touch input, keyboard-only users, and people with limited precision all need workable interaction. Small hit areas, hover-only behavior, and layered popups can make a map unusable even when it looks polished.
If you use an image map, W3C recommends redundant text links on the same page, and each clickable area needs alt text that explains its destination or function. If your interactive map is script-based rather than image-based, the same principle still applies: every important destination and action should be reachable outside the map itself.
Finally, test the map like a visitor, not like the project owner. Open the page on a phone in bright light. Try it with images slow to load. Try it without precise pointer control. Good accessibility usually improves conversion too, because clarity helps every user, not just users with formal access needs.