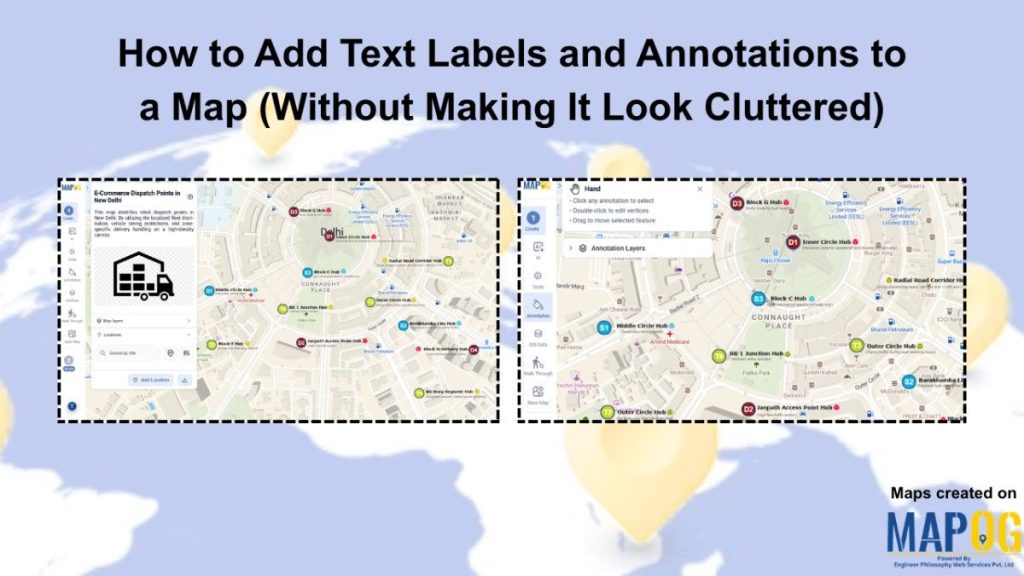
Mapping location data is only half the job. Take an e-commerce business for an example. Plotting delivery zones across a city is a crucial task but without proper labels or context, a viewer looking at that map has no idea what each pin represents or which zone covers which area. The more locations you add, the messier it can get. Knowing how to arrange your text labels and annotations neatly, is important.
Annotated interactive maps significantly fix this problem. Text labels, notes, and descriptions sit directly on the map, tied to the locations they belong to. Users can click, zoom, and explore without needing a separate document to make sense of what they are seeing.
Using MAPOG, you can layer and style your annotations in a way that keeps the map clean and easy to navigate. Since each annotation sits on its own layer, its easy to adjust, hide, or restyle specific elements without disturbing the rest of the map. The result is a map that communicates clearly, even though it is carrying a lot of information.
Key Concept: Making Your Data Look More Presentable
When you add text labels and annotations to a map, the goal is to make the information easy to read at a glance rather than just marking locations. Additionally, the label hierarchy plays a big role in spatial analysis and data visualization since not every point on a map carries the same importance, and the visual weight of each annotation should reflect that. Keeping annotations close to their respective locations, organised across separate layers, and consistent in font and color prevents the map from feeling overloaded. The result is a map where a viewer can navigate freely without having to sort through competing elements to find what they need.
Step-by-Step Process: Deploying Text Labels and Annotations on Your Map
1. Create a New Map
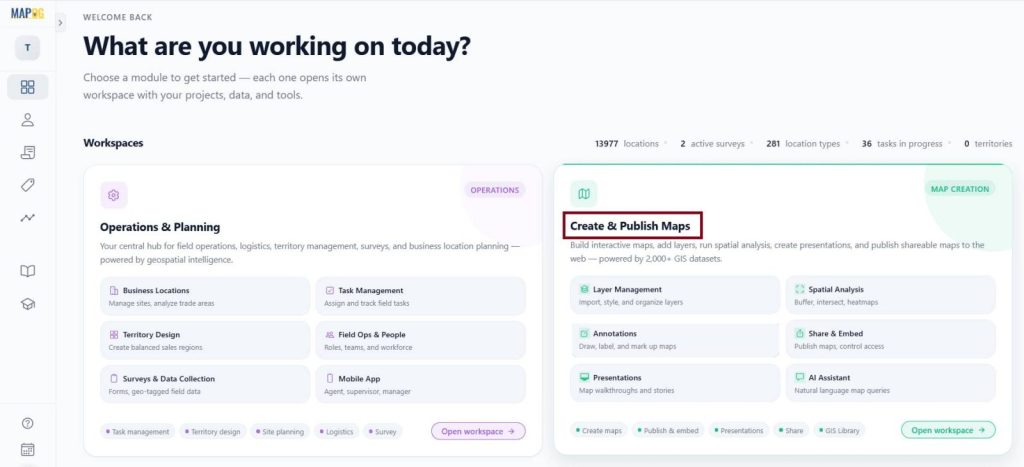
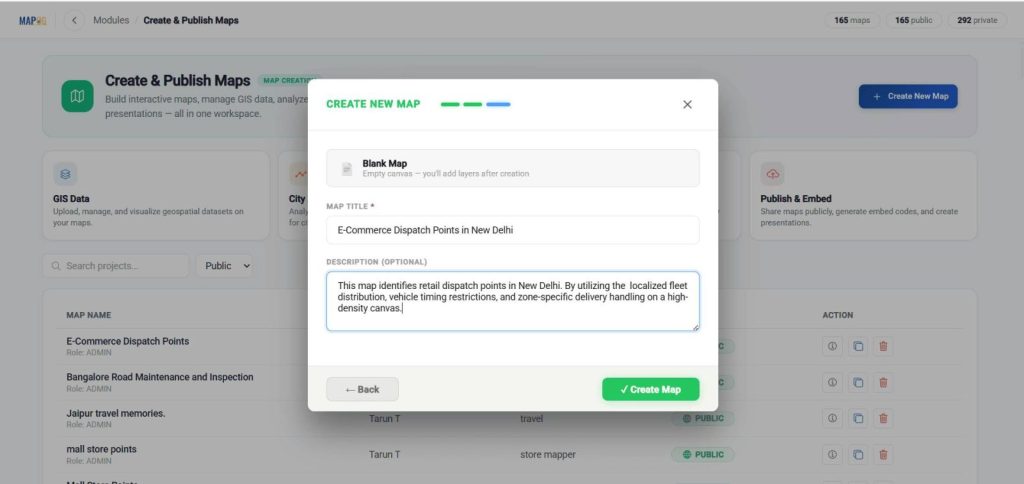
Open MAPOG and “Create & Publish Maps” section.
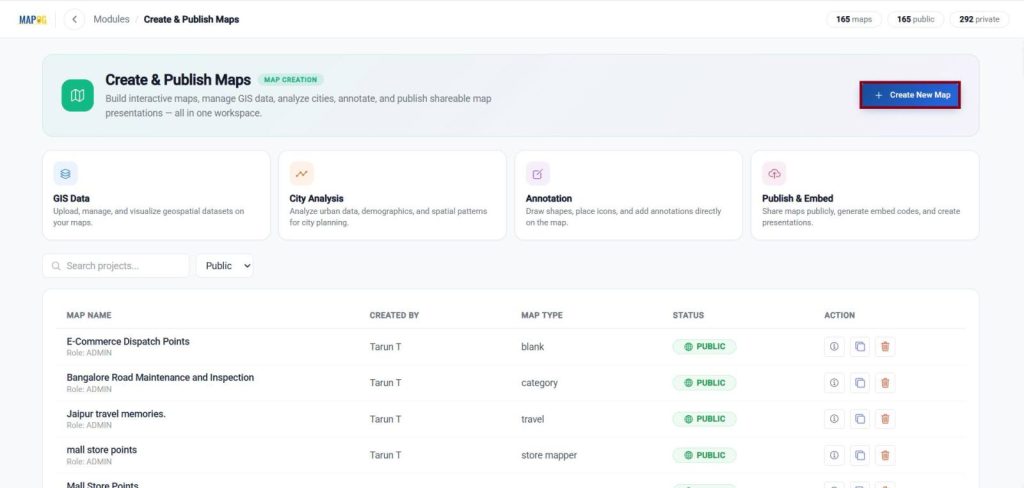
Then you click on Create New Map.
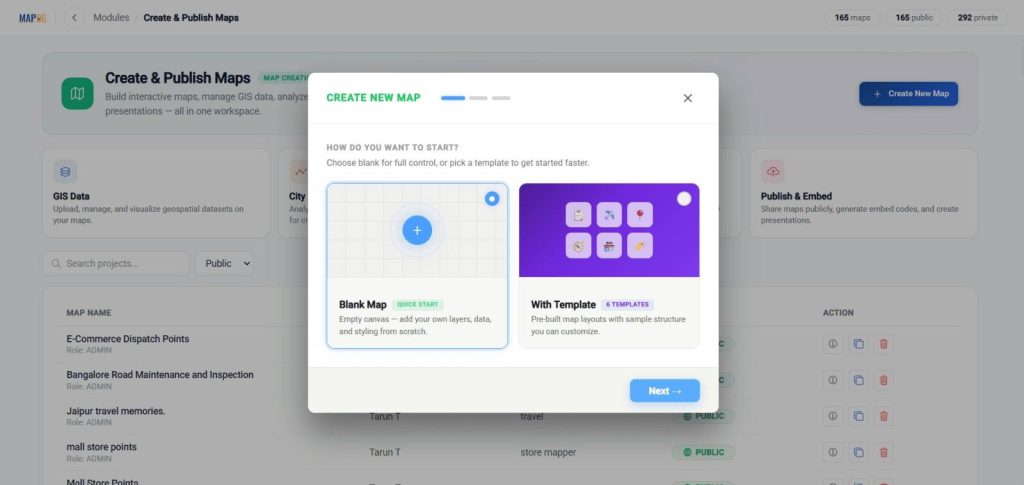
Select the blank map option.
Enter the title and also a brief description for your map.
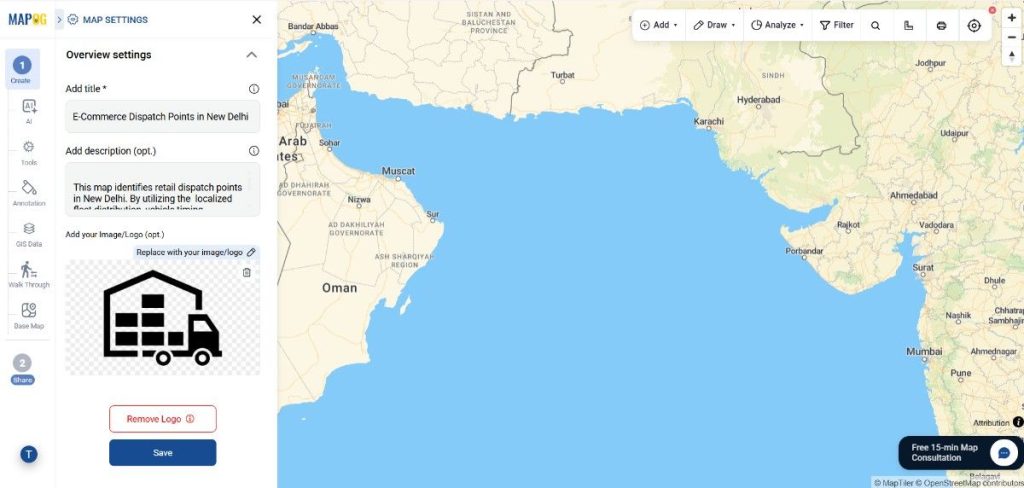
Now, a new blank map will open. Click on settings to upload your logo, and save your changes.
2. Add Text Labels and Annotations to Your Map
Go to “Annotations” section, thereupon use the search bar to find your locations by name or by entering lat/long coordinates.
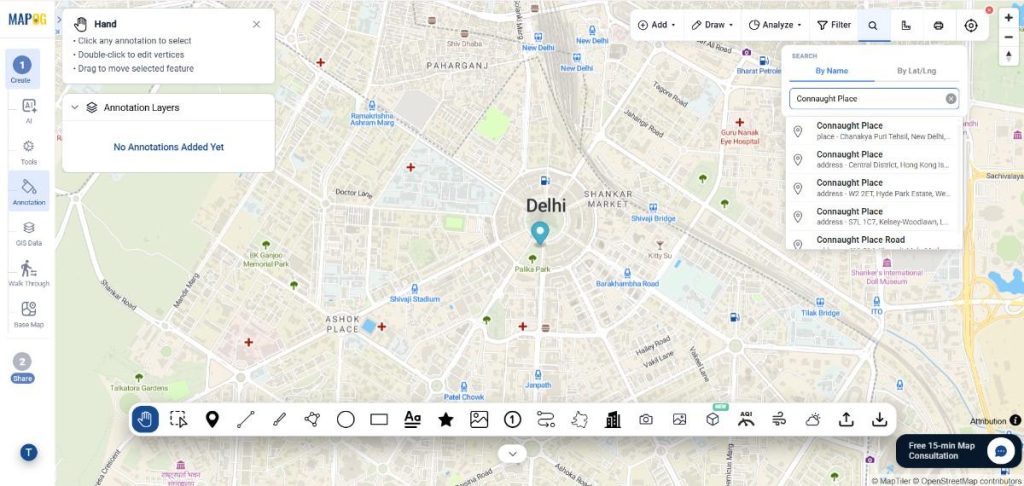
Once you pin point a location, click on “Shapes with Label” from the annotation toolbar and choose a suitable shape.
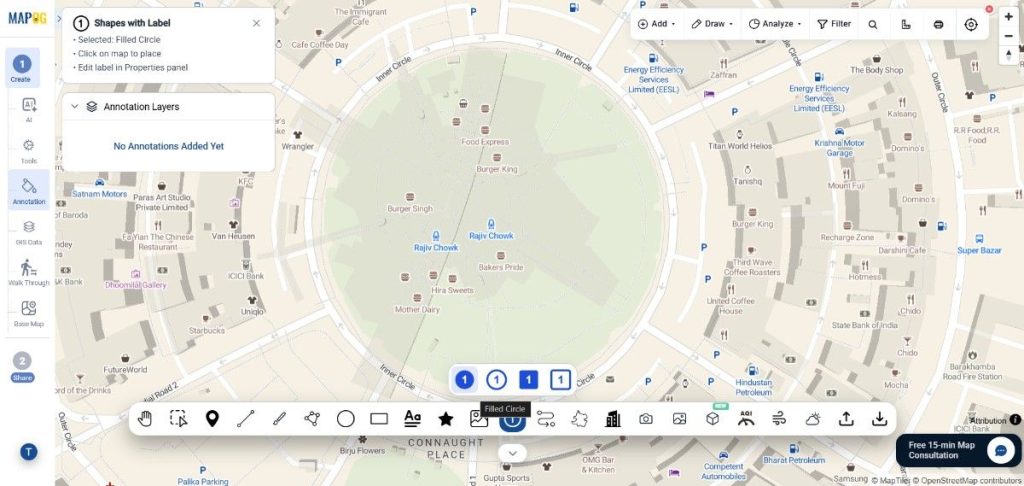
Then, click on the point where you want to place it. Further customize the labels by adjusting the text, colour, size, and other design settings in the Properties panel on the left.
You will see a new layer under the “Annotation Layers” tab. These layers can be renamed for the ease of updating.
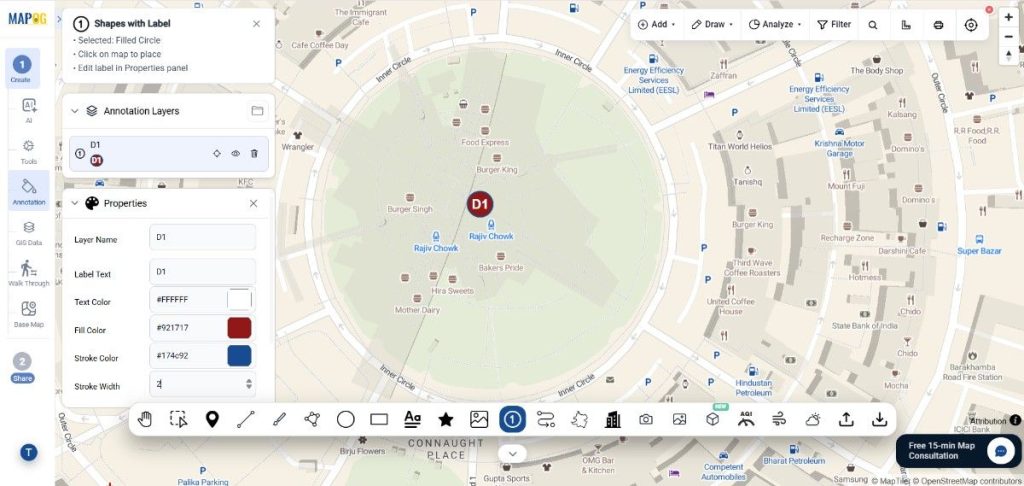
Next, select the “Text” option and click on your desired map location. Type the text in the popup field, and press Enter to place it.
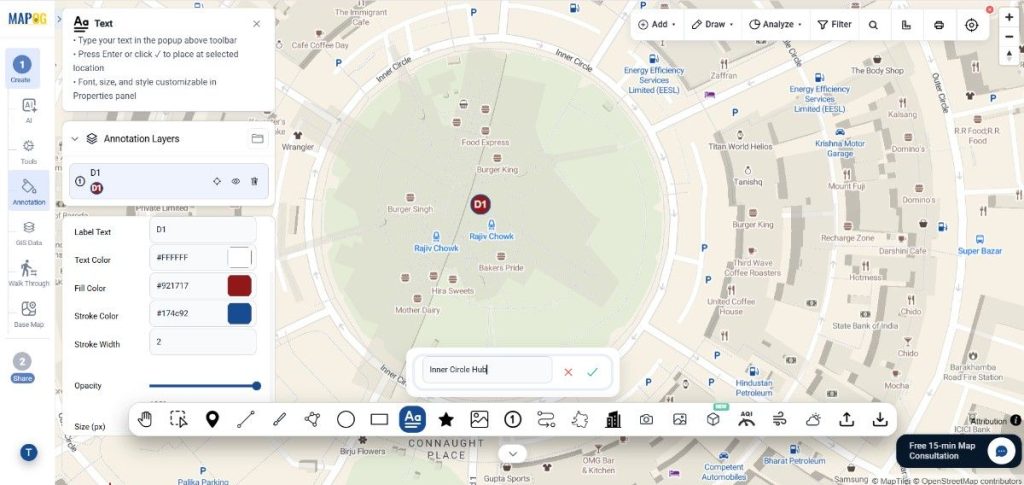
In the Properties panel, adjust the font family, font size, text colour, and text case to match your overall map design.
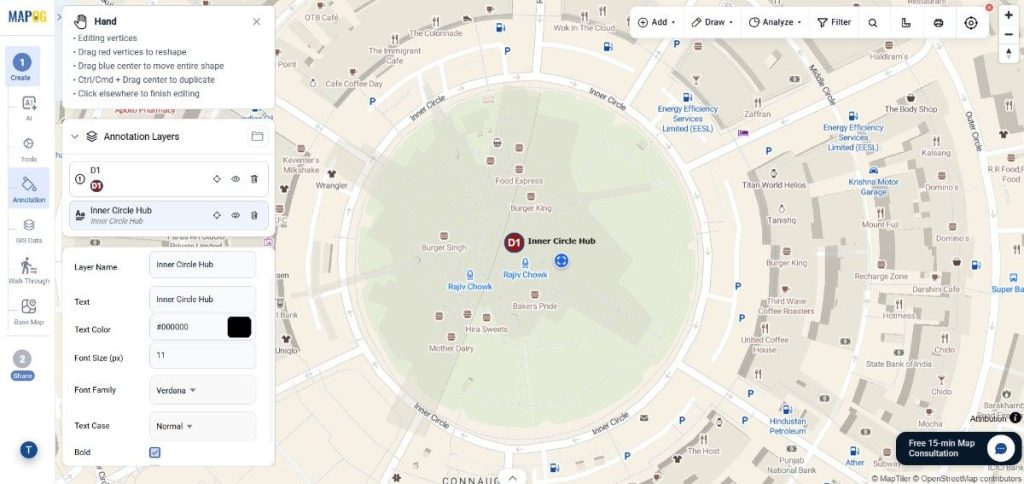
You can also select the colour from the colour grid or simply type the code for it.
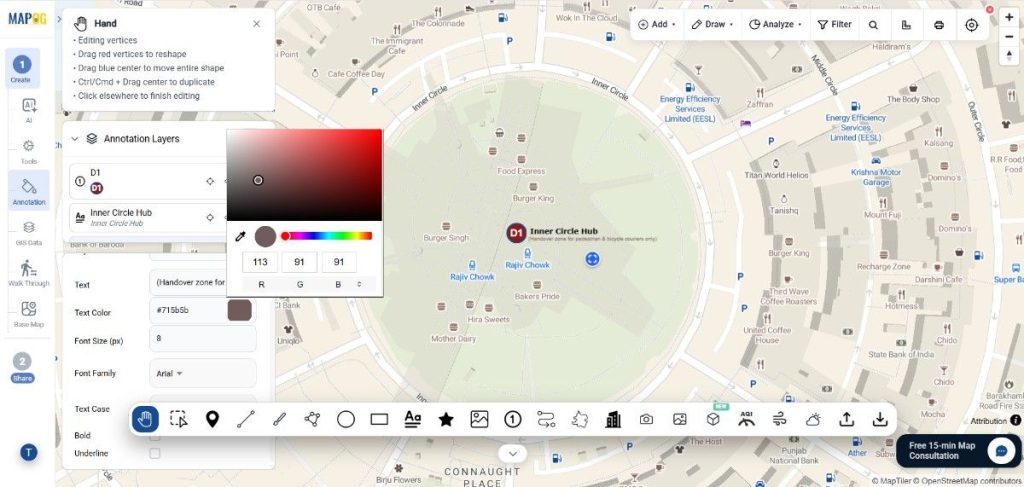
3. Customize Your Text Labels and Annotations
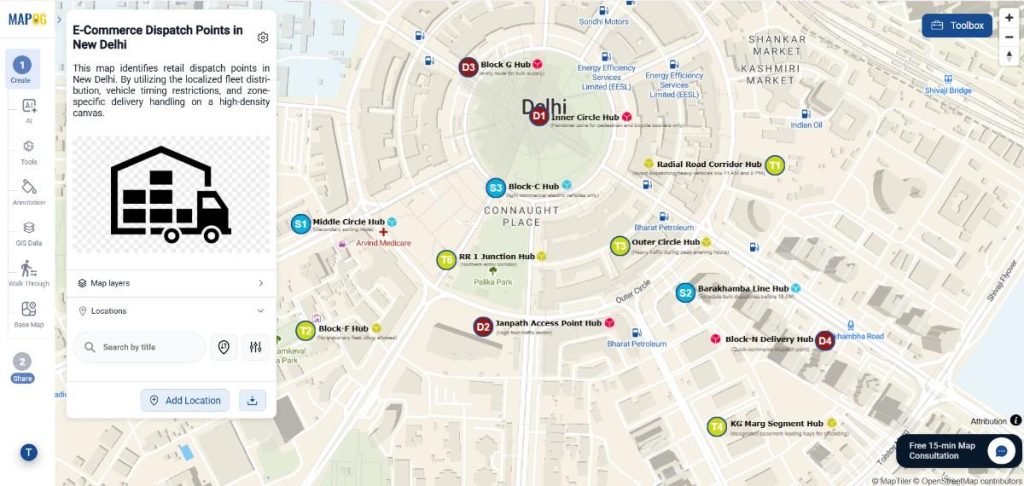
To further customize it, add an icon to enhance the visual appearance of your data on the map.
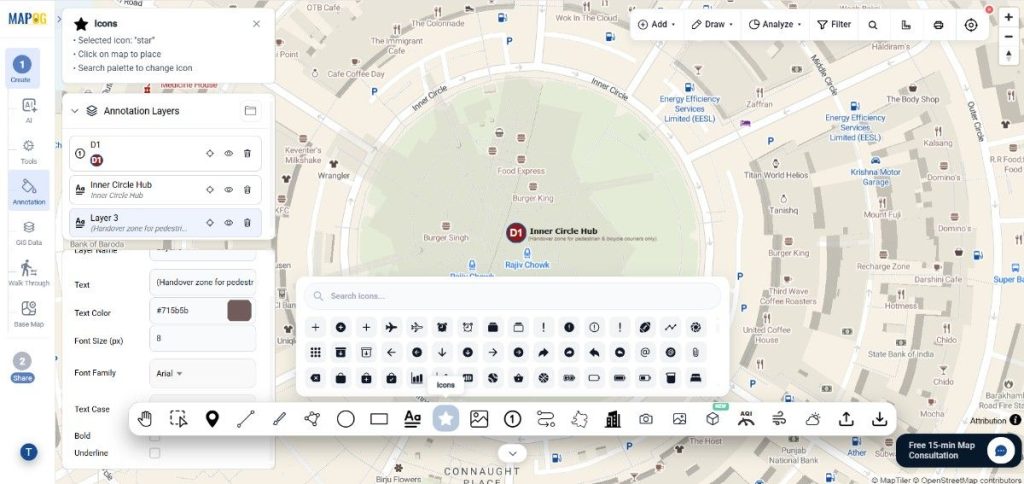
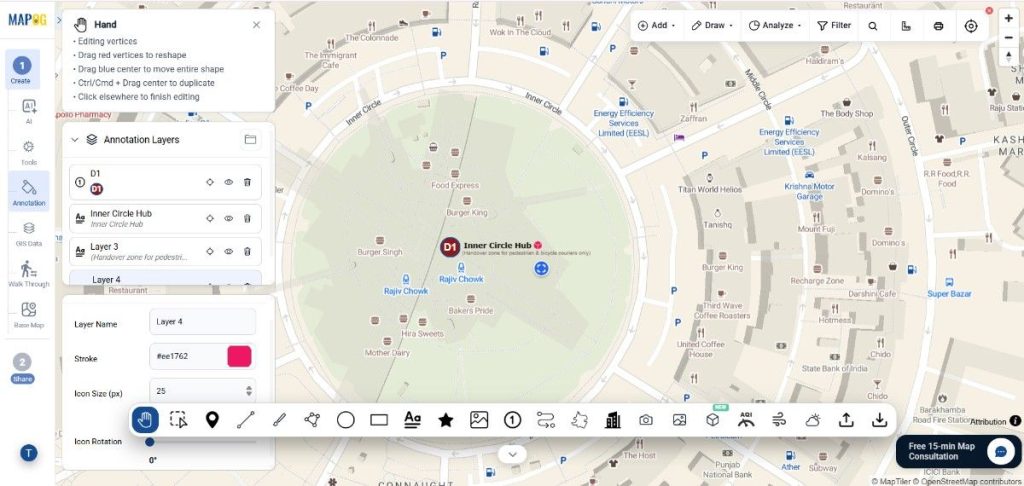
To avoid clutter, follow these label placement rules:
- Place text above or to the right of a marker, not directly over it.
- Use descriptive layer names to keep things organized
- Use uppercase for major zones and title case for streets or landmarks.
- If you’re adding notes along with annotation, make them smaller in size and a lighter shade of colour.
- Make the labels bigger than other annotations to easily identify a location on the map.
Repeat these steps for all the locations you want to annotate on your map.
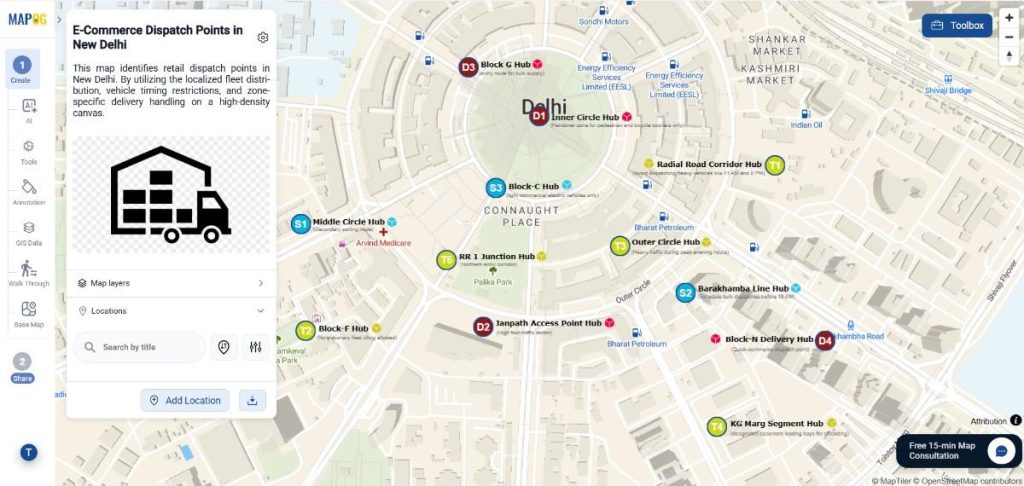
4. Preview and Share
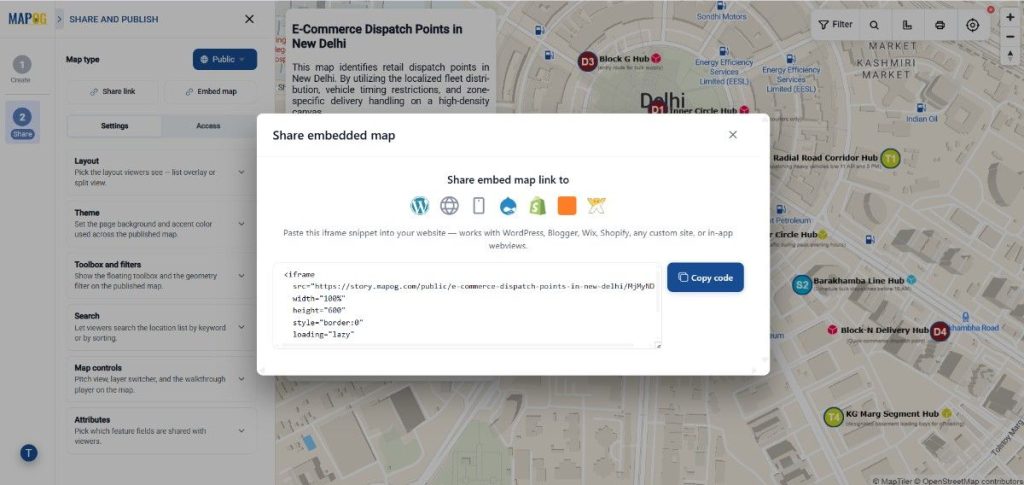
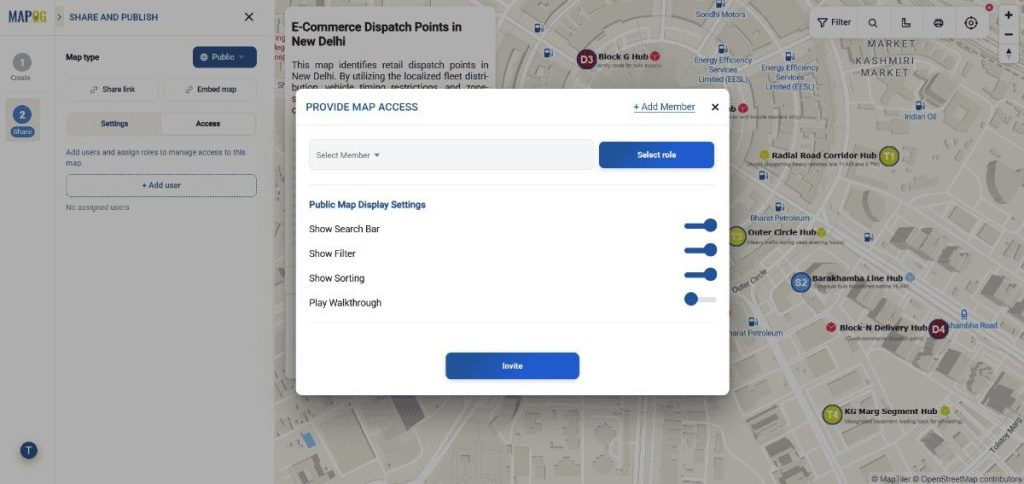
After your map is complete, open “Preview & Share” to review the final layout before publishing. Choose whether the map should remain private or be accessible publicly. You can share it using a direct link, embed it on a website, or invite collaborators by adding users and assigning specific access roles.
Real-World Applications for Interactive Map Annotations
Annotated interactive maps have many real-world applications across different industries. Businesses use annotated maps to visualize store networks, delivery zones, and fulfilment centre locations. Labels and icons help operations teams and customers understand the geographic coverage of a distribution network. In Real Estate, property maps use annotations to mark listings, highlight nearby amenities, and indicate price zones. A clean annotation system helps potential buyers or tenants navigate the map without being overwhelmed by detail. Planners annotate maps with zone classifications, infrastructure names, and project boundaries. Clean label design is important here because the audience often includes non-technical stakeholders who need to read the map quickly.
Conclusion
Adding text labels and annotations to a map using MAPOG is straightforward. Getting them to work together without making the map hard to read requires a bit more attention to how elements are placed, sized, and organized. Starting with a clear layer structure, keeping label text short, using icons where text would create overlap, and maintaining consistent styling across all annotation types goes a long way toward a map that communicates clearly rather than one that simply contains a lot of information.