Plan new outlet locations using travel time, not just demand or distance. Travel time, influenced by traffic and road networks, is a more accurate measure. Map delivery-time-based areas using isochrone analysis and visualize them in MAPOG with outlets and demand to identify gaps and plan expansion.
Key Concepts for Isochrone Analysis to Plan New Outlet Locations
Use isochrone analysis to map areas based on travel time rather than distance, giving a more realistic view of accessibility. Consider road networks, traffic conditions, and travel mode to determine how far a location can be reached within a given time. Create multiple time-based zones—such as 15, 30, and 45 minutes—to categorize areas into well-connected, moderately accessible, and less accessible regions.
Combine these zones with relevant data to identify patterns, highlight highly accessible areas, and detect gaps in reachability. Identify overlaps where multiple locations serve the same area. Use this insight to support informed decision-making, optimize resource allocation, and improve overall accessibility and efficiency.
Step by Step Process on how to do Isochrone Analysis to Plan New Outlet Locations
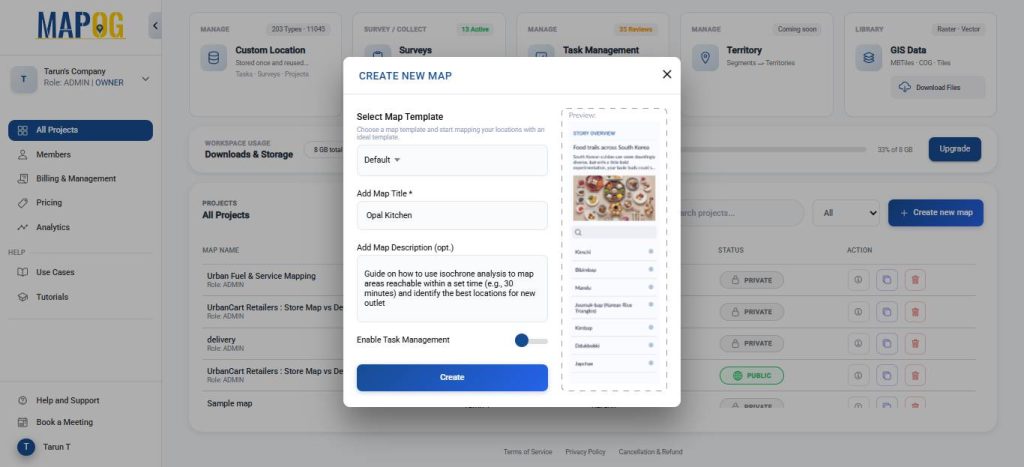
1. Start with a New Map
Open MAPOG and click on Create New Map, give your project a title and a brief description, then hit save.
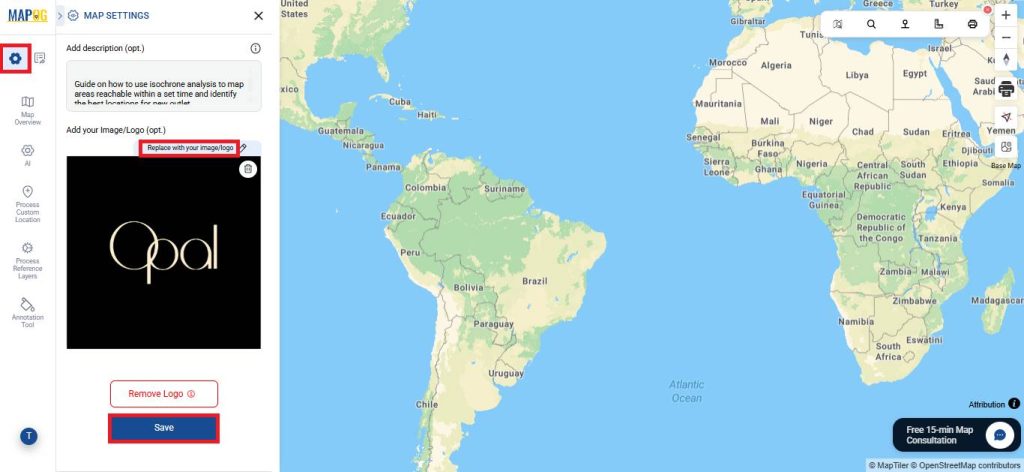
Next, open Map Settings and select Replace with your image or logo to upload your company logo.
2. Process Reference Layers
Go to Process Reference Layers, and select Upload Vector Data.
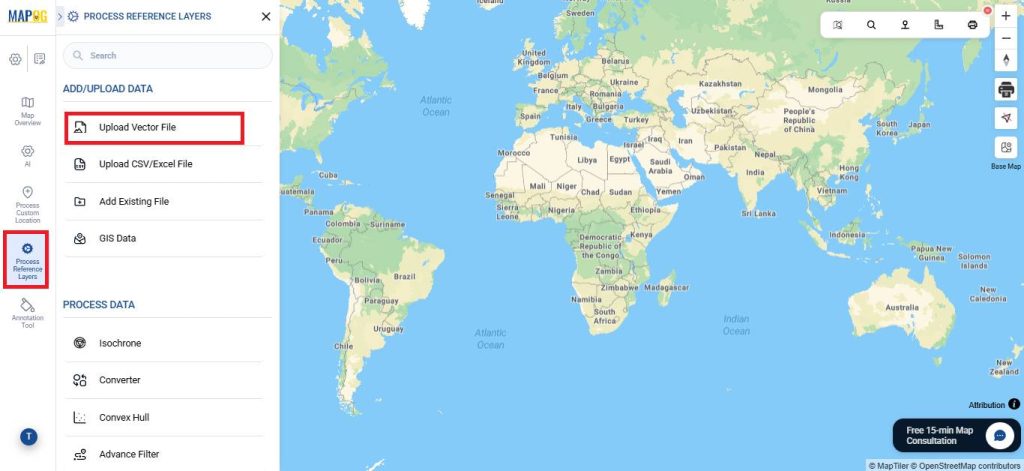
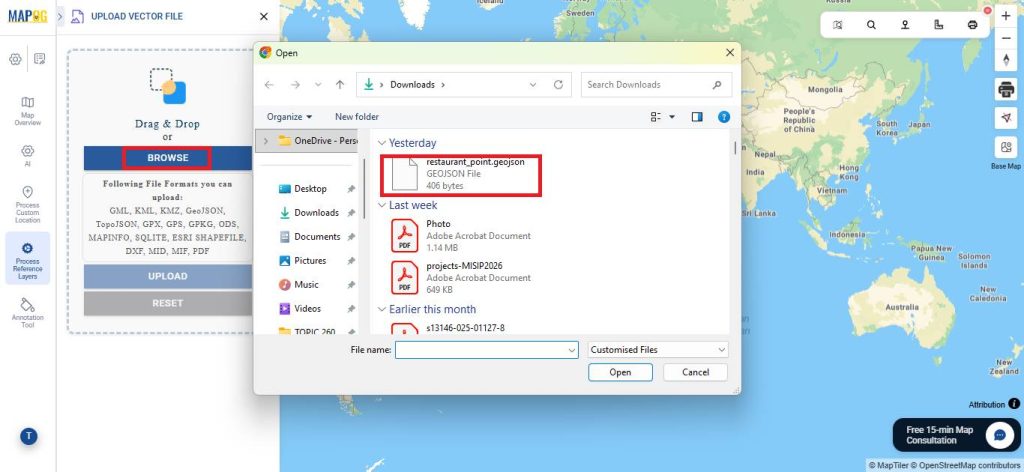
Then proceed to upload your file in one of the supported formats.

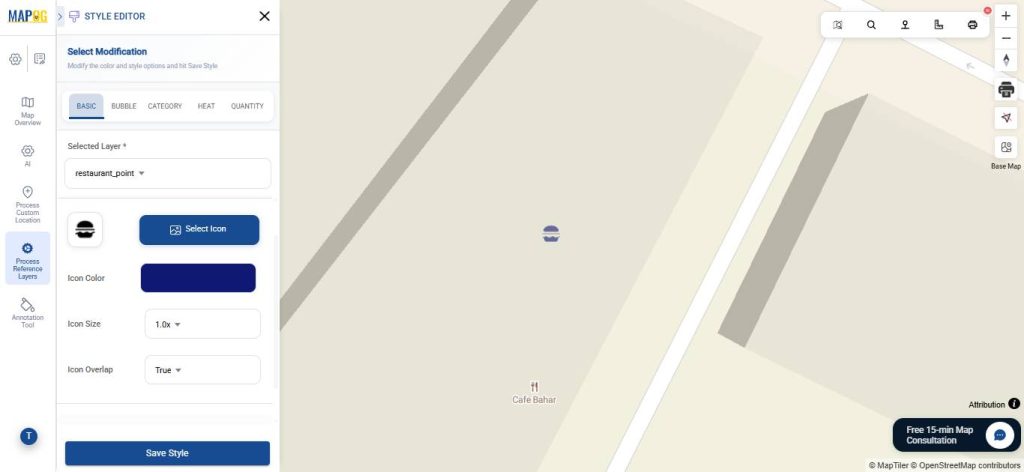
After that, click Add Layer Style to customize how the point appears.
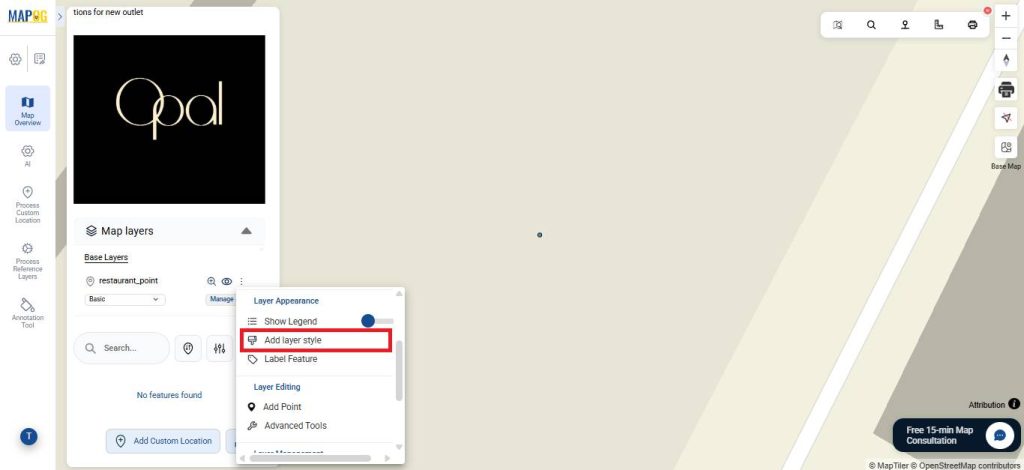
Choose an icon from the Select Icon option, then customize its colour and size.
3. Setting Up Isochrone Analysis
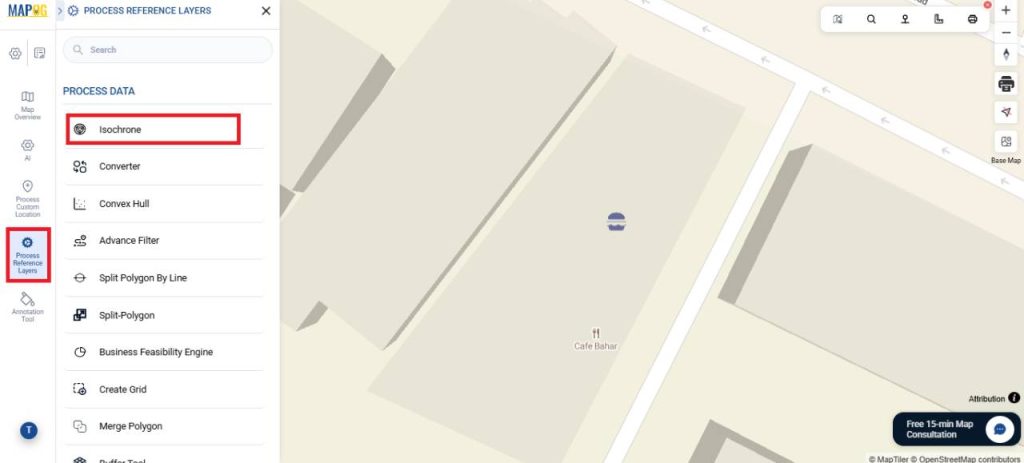
Go to Process Reference Layers again, and select Isochrone this time.
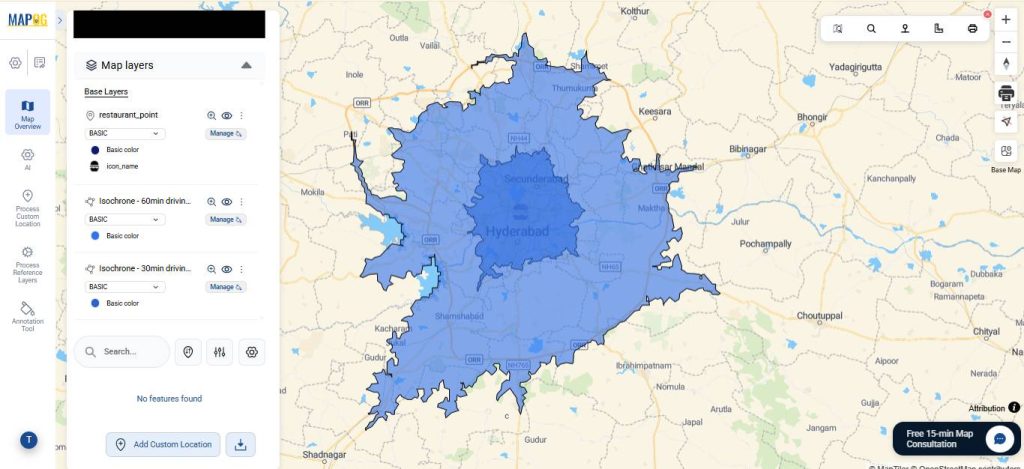
Click on Select Layer to work with existing layers or use Point manually select a location. Select the uploaded layer. Then, add a layer name and select the travel mode—choose ‘Driving (Traffic)’ for delivery routes to reflect real conditions. Then, set the time duration zones (e.g., 30, 60 minutes) for which you want to generate isochrones and click submit.
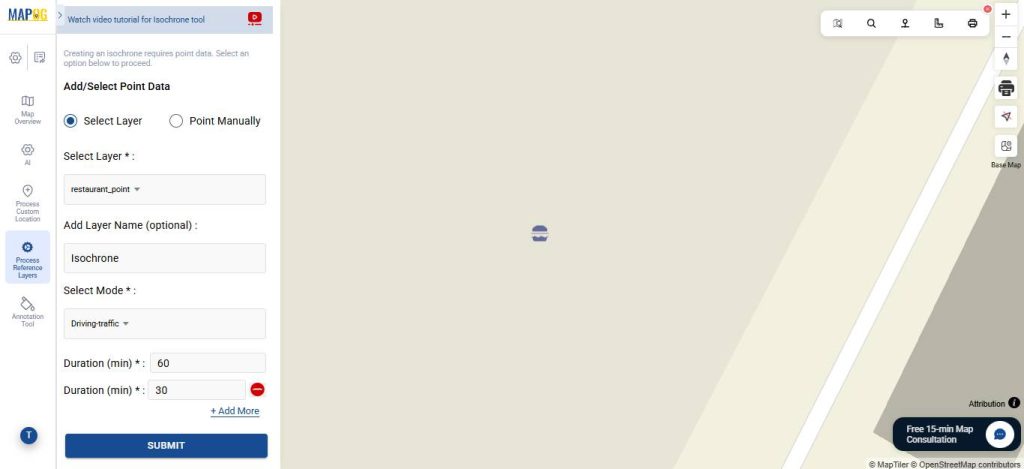
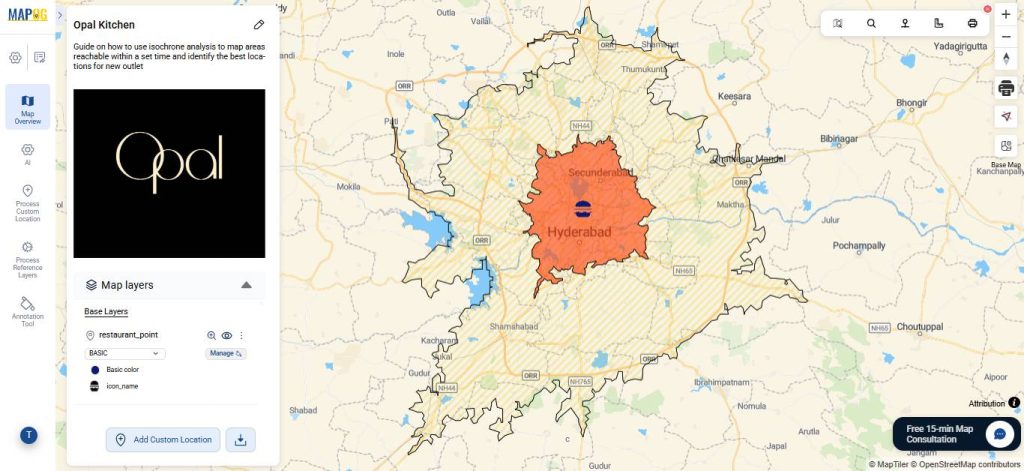
Your isochrones for different durations have been created.
4. Style your Isochrone
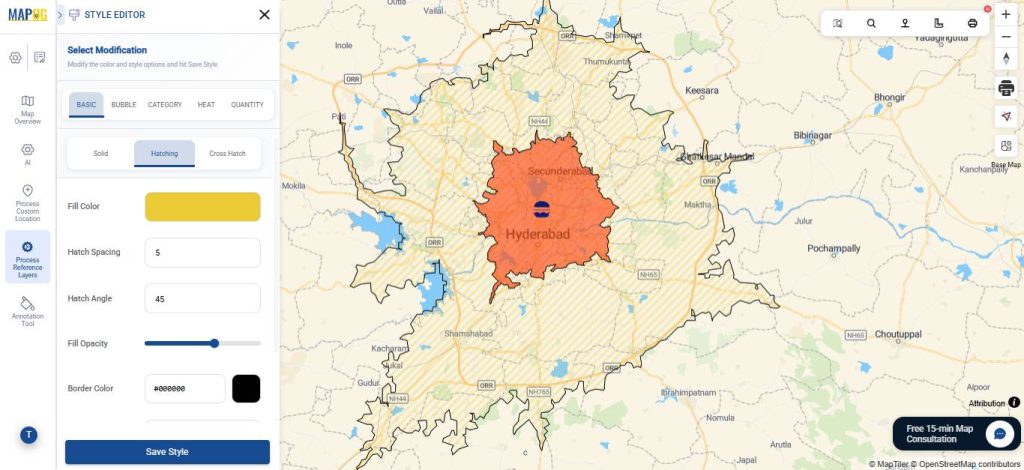
Click on Add layer style to customize the isochrone for analysis.
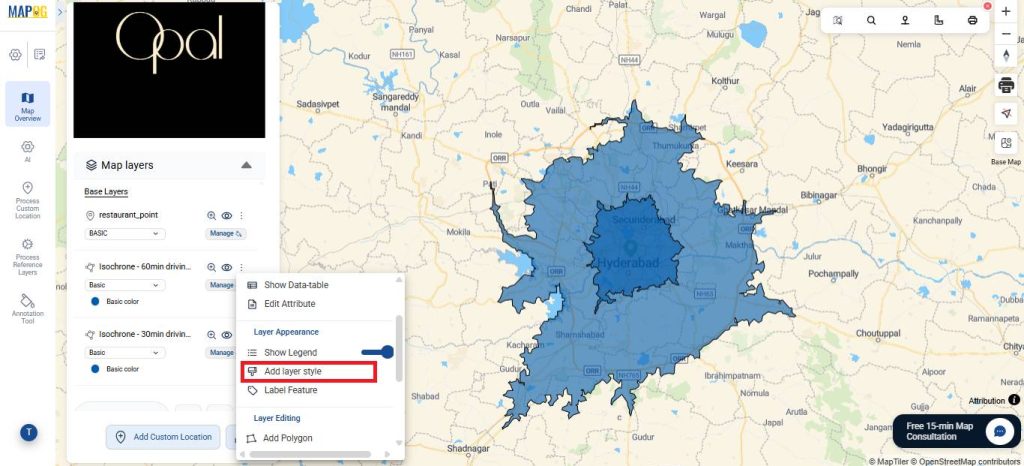
Then, assign suitable colours to the isochrones. For instance, since duration is key, use red for shortest time, and yellow for longest delivery zones. You can also apply hatching or cross-hatching styles. Once done, click Save style.
5. Share Your Map
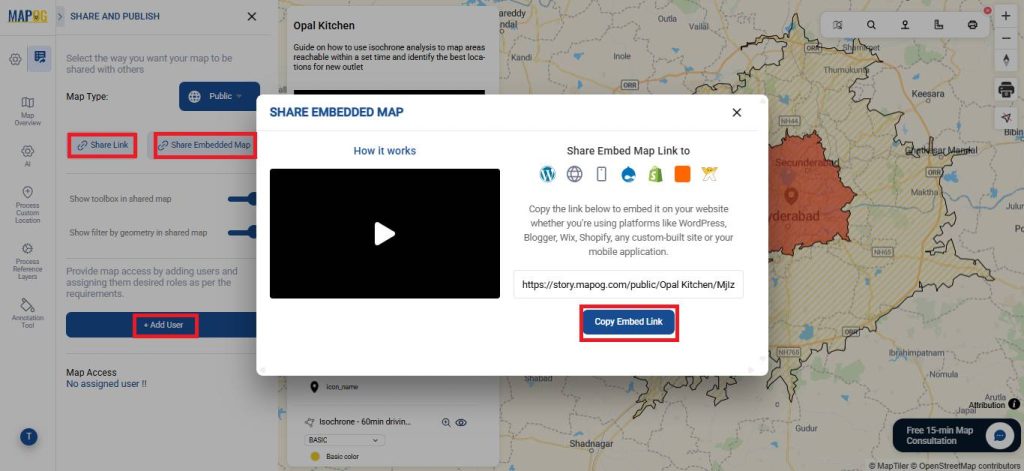
Once your map is ready, click Preview and Share. You can also set your map to Public for wider visibility or share it using the Share Link option. You can also invite users to collaborate and edit the map using the add user option.
Key Findings
- 20-30 min (Red): Oversaturated zone with high service coverage relative to demand
- 50-60 min (Yellow): Underserved zone where demand exists but coverage is limited
From the isochrone analysis, the 50-60 minute zone presents the strongest opportunity for new outlets.
Real World Applications
Isochrone analysis has a wide range of real-world applications across industries. In food delivery and cloud kitchens, it helps identify underserved areas and plan new outlets to reduce delivery time.
Retail businesses use it to select store locations based on customer accessibility, while logistics companies apply it to optimize warehouse placement for faster last-mile delivery. In emergency services, it is used to ensure ambulances, fire stations, and police units can reach locations within critical response times.
It also plays an important role in healthcare planning by assessing hospital accessibility, and in urban planning by evaluating how easily people can reach public transport, schools, and other essential services.
Conclusion
In conclusion, isochrone analysis provides a practical way to understand accessibility based on time, enabling more informed and efficient planning decisions. By identifying well-served areas, gaps, and overlaps, it helps optimize placement, improve coverage, and enhance overall performance. Using MAPOG makes this process easier by bringing analysis, visualization, and on-ground execution together in one place, allowing teams to move from insight to action more effectively.