UploadCSVToMap

Cover Image

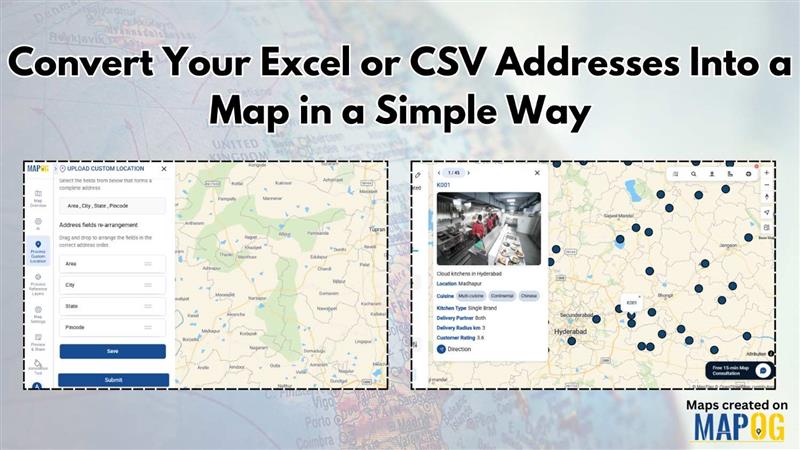
Convert Your Excel or CSV Addresses Into a Map in a Simple Way

Working with address data in Excel or CSV is common, but understanding that data becomes much easier when you can see it on a map. Whether you’re managing customer locations, store outlets, survey responses, or delivery points, visualizing them geographically helps you uncover patterns, plan better, and make faster decisions. This is why many users now … Read more

3 Easy Ways to Add Story Points and Narratives to Your Map

Adding story points and narratives to your map transforms it from a simple visual into an interactive story. Rather than displaying locations, you connect each point with details like descriptions, photos, etc. MAPOG, provides 3 easy ways to add story points making it easy and flexible; you can do it by uploading Excel or CSV … Read more

How to Create a Shareable Map Portfolio from Excel/CSV Data

Create a shareable map portfolio from Excel/CSV data to bring your projects to life in a visually compelling way. Although spreadsheets are excellent for storing detailed information, they often fall short in conveying the scale, diversity, and geographic reach of your work. While using MAPOG, you can transform that same data into an interactive map … Read more

Convert Excel/CSV to an Interactive Map (Free, No-Code)

Converting Excel/CSV into an interactive map is a practical method for visualizing location-based information without programming skills. In other words, users upload spreadsheet data , such as addresses, coordinates, or place names into a mapping platform that displays it spatially. Therefore, no-code tools like MAPOG make this process accessible enabling users to geocode locations, categorize … Read more

How to Geocode Excel Data and Create an Interactive Map (Step-by-Step Guide)

Have a spreadsheet full of addresses or coordinates and wondering how to plot them on a map? Geocoding Excel data into an interactive map can transform raw location information into valuable insights. Whether for business analysis, logistics, or research, mapping your Excel data helps visualize trends and make data-driven decisions. This guide will walk you … Read more