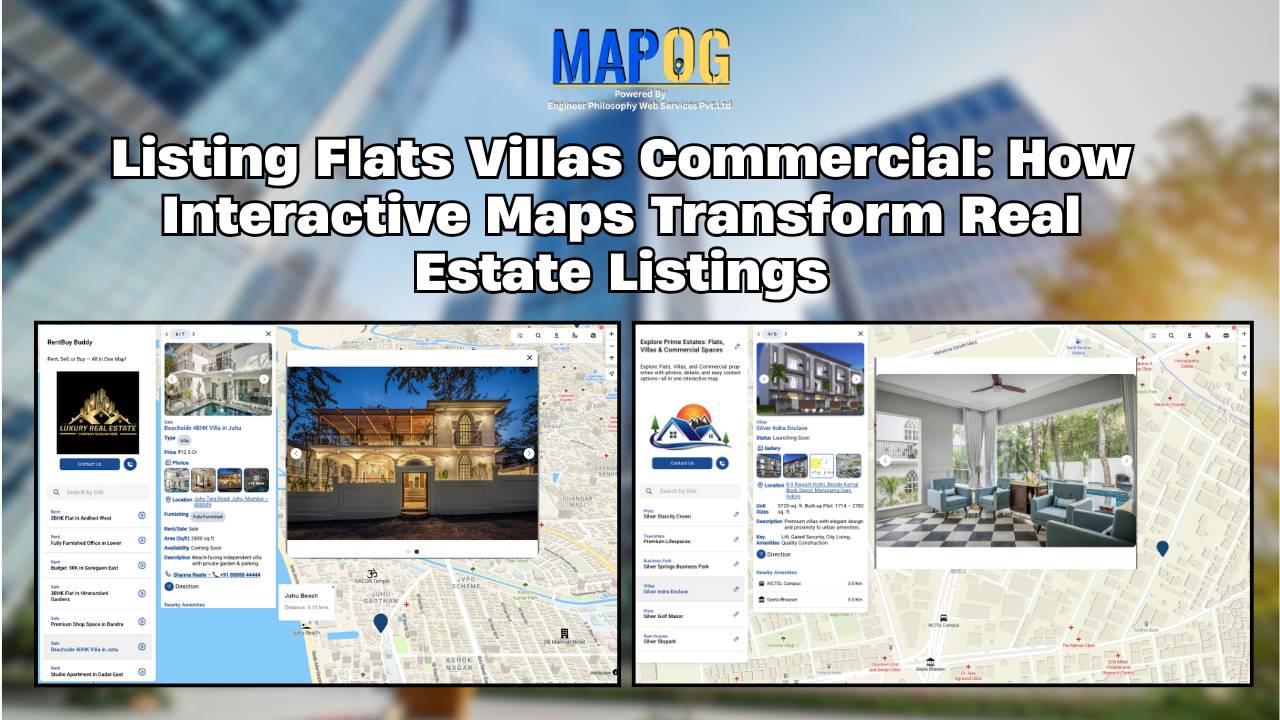
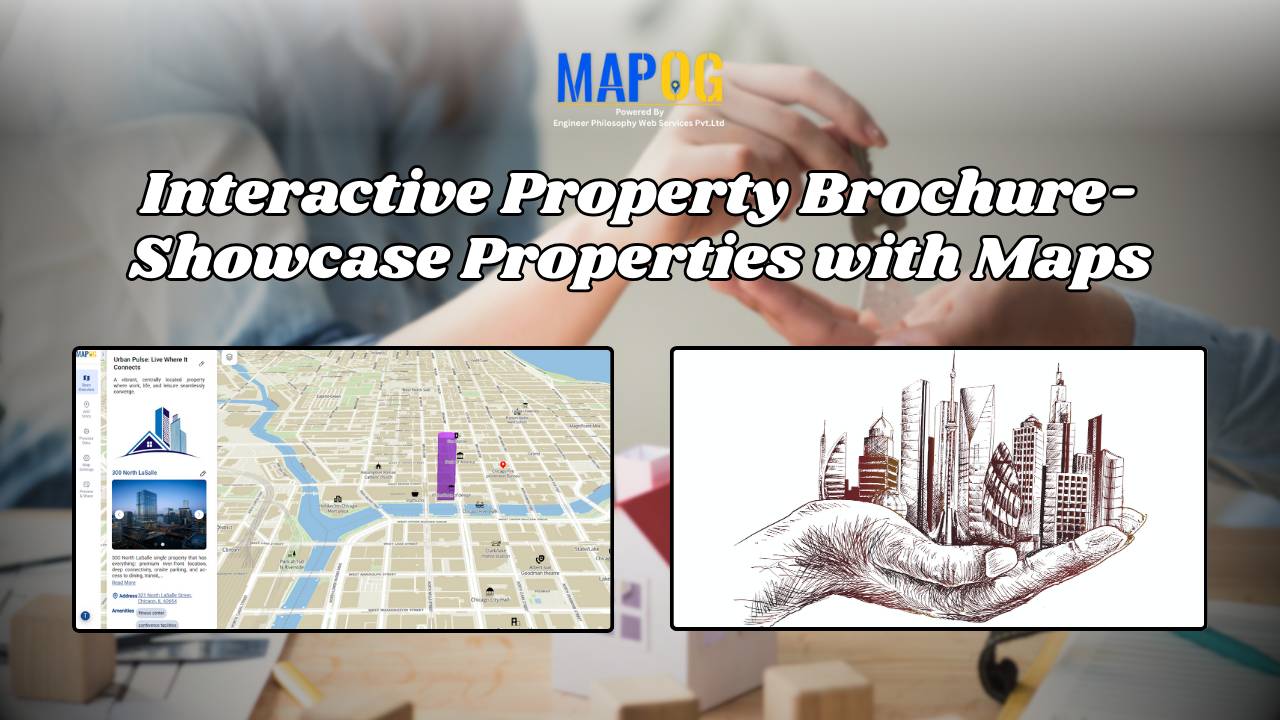
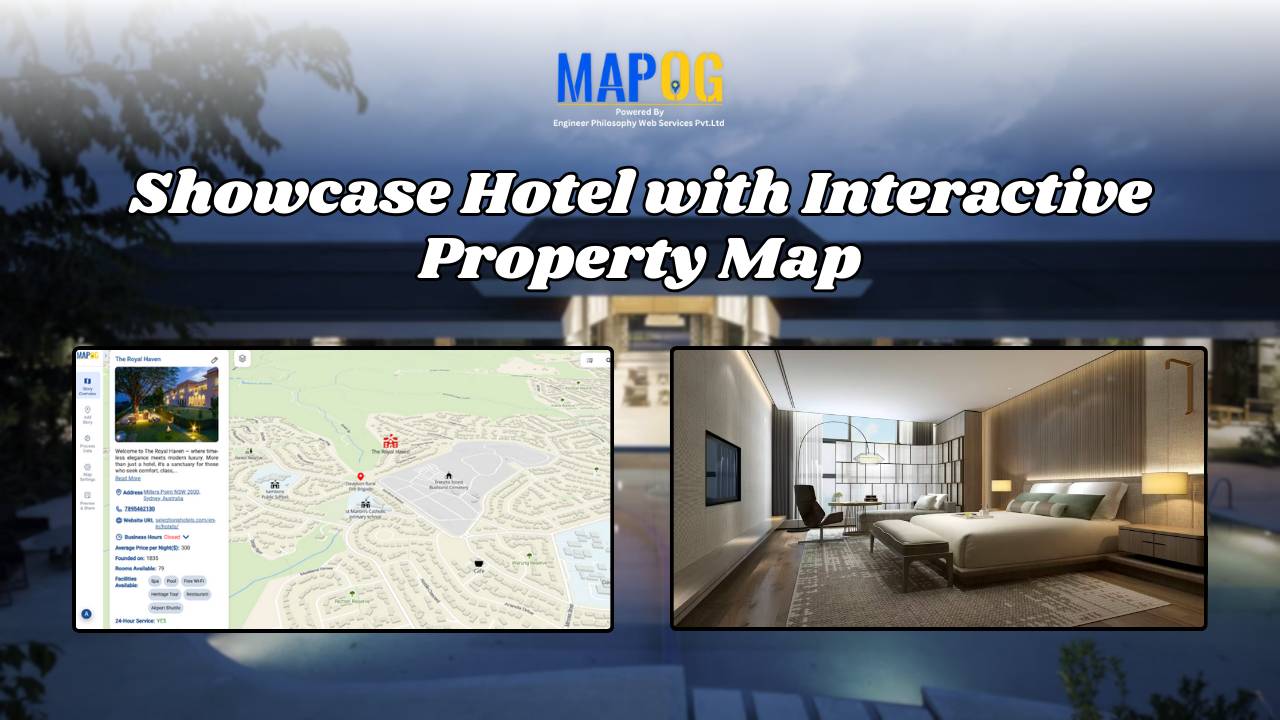
#DataVisualization

A Beginner’s Guide to Mapping GIS Data Online

With the advancements in today’s digital world, GIS data is a necessary element for any professional or enthusiast in urban planning, environmental monitoring, or simply the creation of a visual story. The integration of GIS data with an online map is, thus, an indispensable skill. In the following pages, we shall describe how to incorporate … Read more

How to Create Energy Maps for Unpowered Settlements Step-by-Step Guide to Identifying Energy Gaps

How to Create Energy Maps for Unpowered Settlements: Step-by-Step Guide to Identifying Energy Gaps

In an era where energy plays a pivotal role in shaping the economic and social landscapes, equitable distribution of power is paramount. “Creating Energy Maps: Unpowered Settlements”, This article delves into the realm of MAPOG Map Analysis to identify potential energy deserts—areas where settlements lack the crucial infrastructure of energy power lines or towers. By … Read more

Land Use Compliance: Creating a Border Intersection Map

“Land Use Compliance using Border Intersection in MAPOG” enables urban planners to quickly identify and address non-compliant land use by analyzing the intersections of property boundaries with zoning attributes. Key Concepts Identifying these non-compliance areas quickly and accurately is crucial for effective urban management and enforcement. Steps to create Land Use Compliance using Border Intersection … Read more

Create Sports Maps and Analyze : GIS Solutions for Improving Local Sports

Understanding and analyzing sports activities in various areas is crucial for making informed decisions about community health, engagement, and infrastructure investments. Mapping Sports Activity: Using Levels for Analysis, By using the level feature and category style in GIS, we can visualize and categorize sports activities on a map effectively. Key Concept of Create Sports Maps … Read more