Managing agricultural land is challenging due to the need for monitoring large areas. Farmland boundaries, crop types, and seasonal cycles often stay in spreadsheets, causing missed insights when planners map farm land. MAPOG utilizes satellite imagery and georeferencing to map farm land with polygon layers, allowing users to incorporate details like sowing and harvesting dates. This structured approach facilitates real-time collaboration and insight into crop patterns and soil usage.
Key Concept: How to Map Farm Land Using Satellite Images
Satellite imagery offers a visual representation of land, and by employing Georeferencing, experts can accurately map farmland boundaries. Next, users draw polygon features over the satellite images to delineate individual farm plots and clearly map farm land boundaries.
MAPOG streamlines this process by integrating mapping, data attributes, and visualization tools into one platform, allowing users to overlay satellite images, define farmland polygons, and manage crop information efficiently. This facilitates improved land use evaluation for agriculture planners and real estate analysts.
Step-by-Step Map Farm Land Using Satellite Images Process
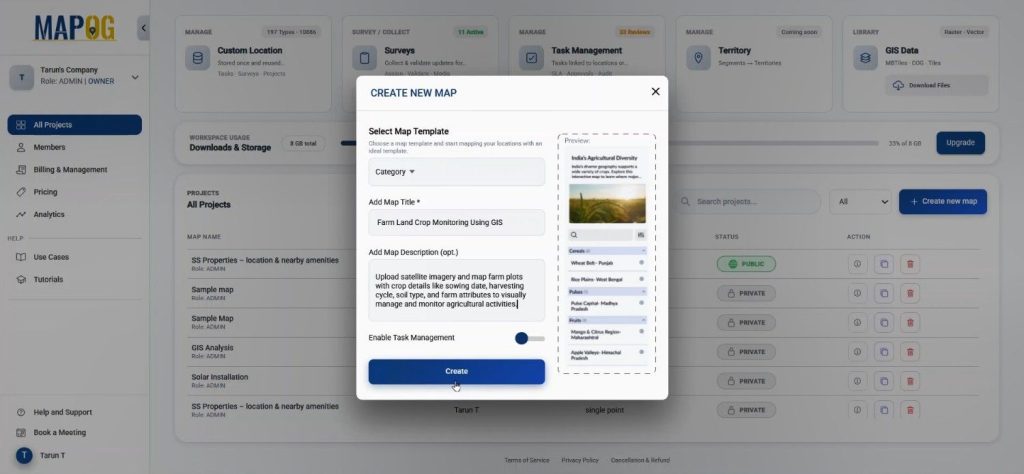
Step 1: Start a New Map to Map
To begin, open MAPOG and click Create New Map. Select the Category map template, provide name and description, and save it.
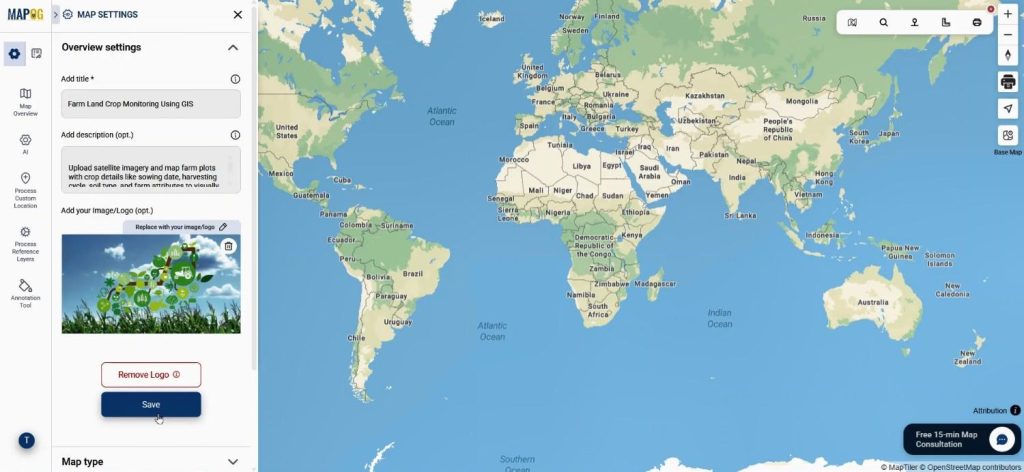
After coming to the interface, users can use the replace option to change the logo so the project reflects their organization or farmland study.
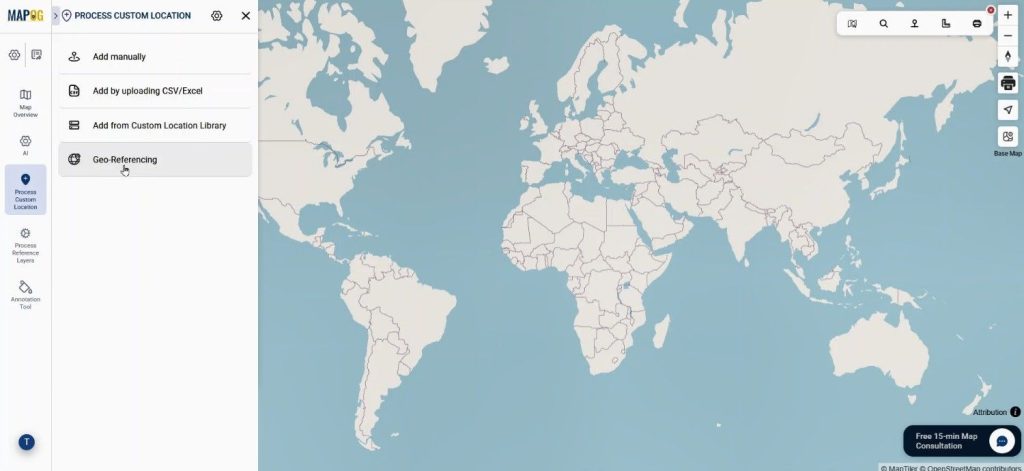
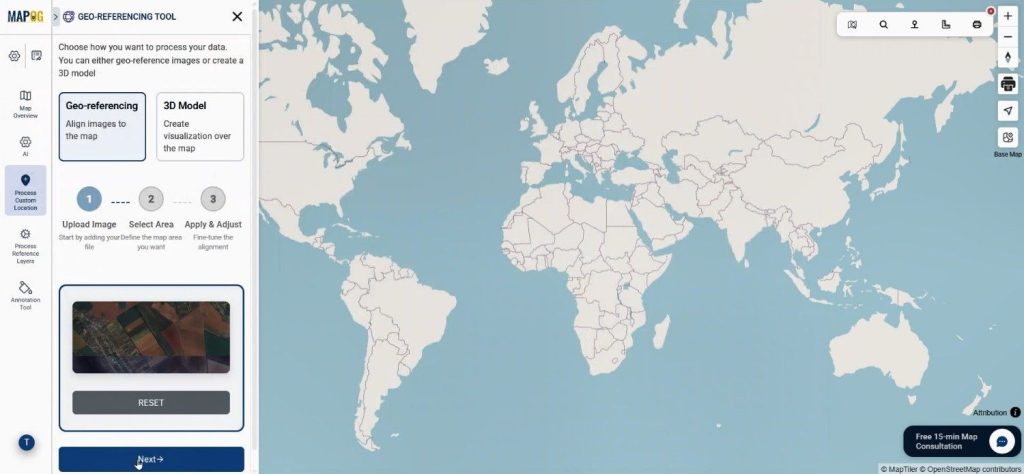
Step 2: Overlay Satellite Imagery Using Georeferencing
Next, open Process Custom Location and select the Georeferencing. Through these users successfully overlay Images with precise geographic alignment.
First, upload the satellite image. This tool in MAPOG allows users to accurately place satellite images in JPG or PNG format on the map.
Now, move to the Select Area Phase, here add image label. Then search the real-world location using coordinates so the correct area appears on the map.
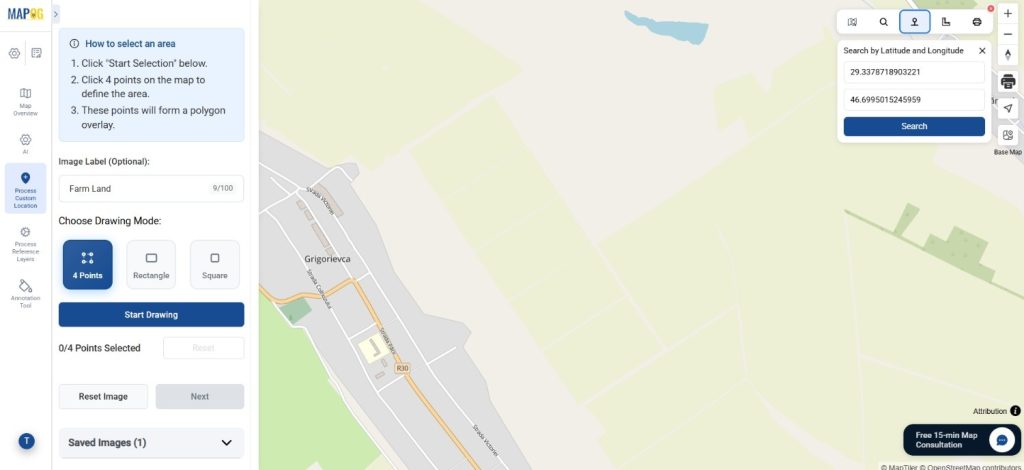
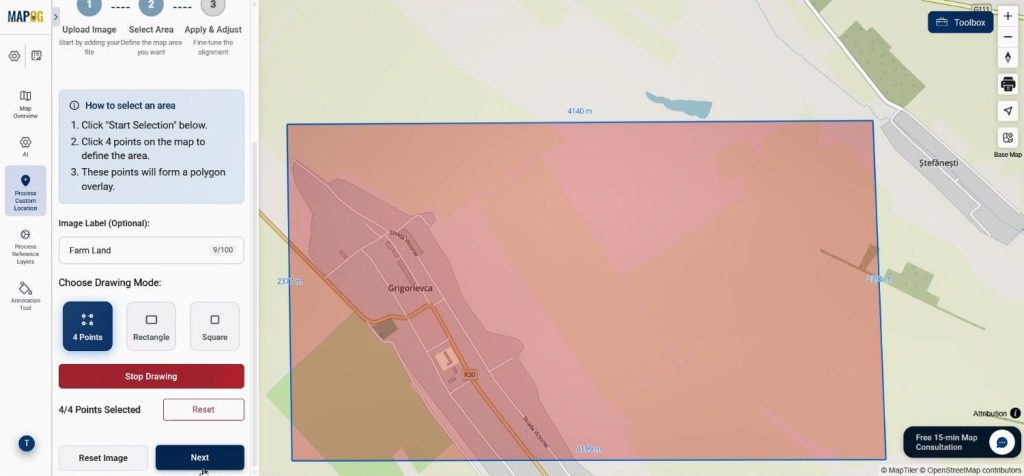
After that, select a drawing mode such as four points, rectangle, or square, and begin drawing around the visible farmland area. Click next when done.
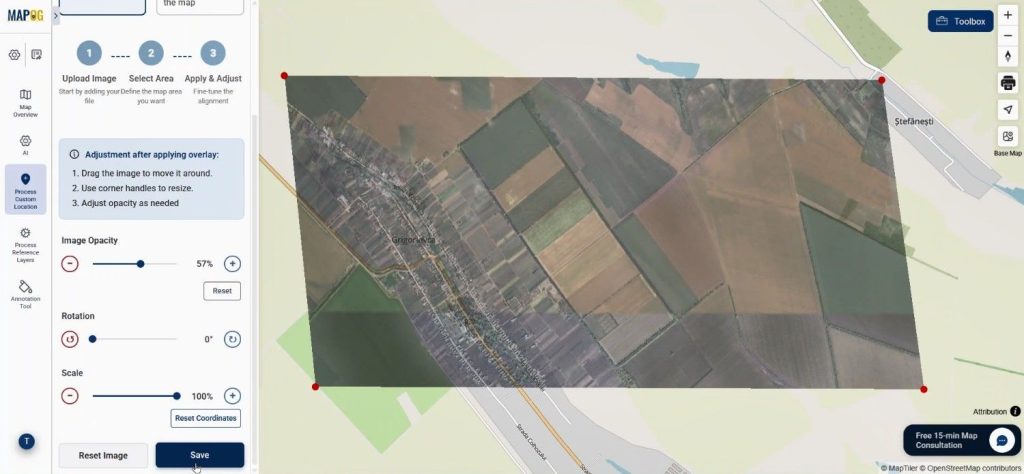
Once users place the reference points, they can adjust the image by dragging it until it aligns with nearby roads and rivers. Opacity, rotation, and scale tools help refine the positioning. When alignment is accurate, click Save.
Step 3: Draw Crop Land Boundaries with Polygons
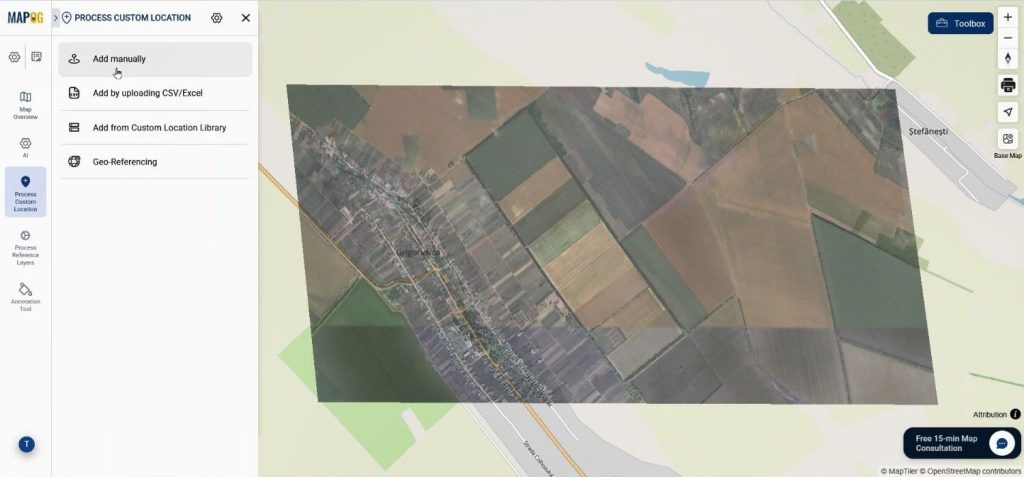
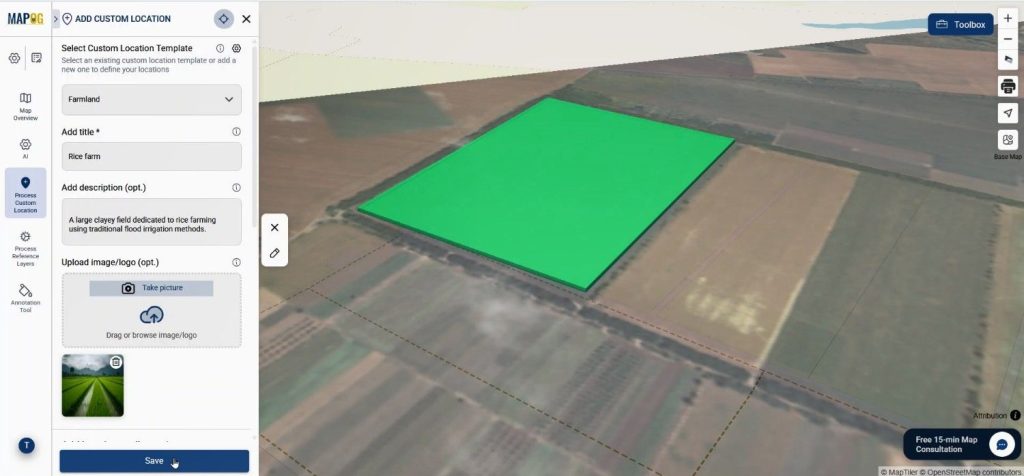
Navigate to Process Custom Location and select Add Manually.
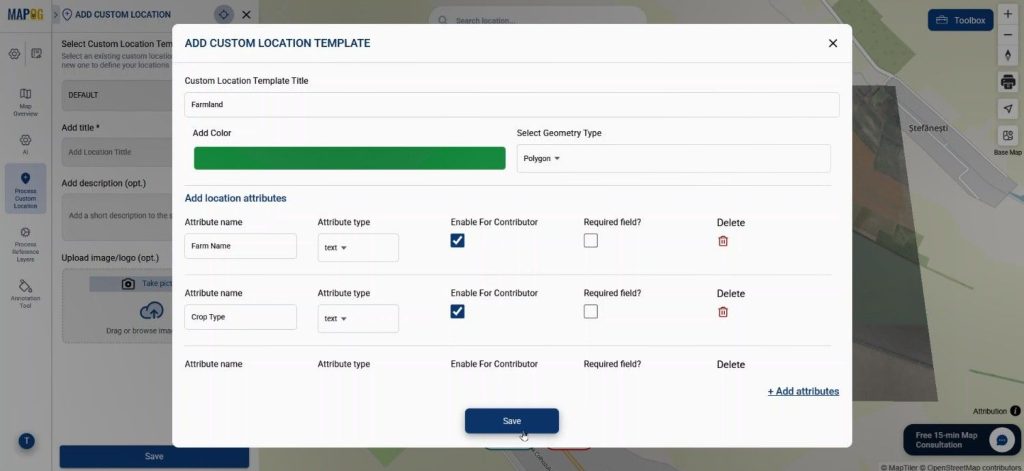
Then open Custom Location Settings and create a new template called Farm Land. Set color & since farms cover an area, the geometry type should be Polygon. Next, users can add several attributes such as Crop Type, Sowing & Harvesting Date, and Soil Type in text, date, or selection formats and enable contributor access so field teams can update crop information themselves.
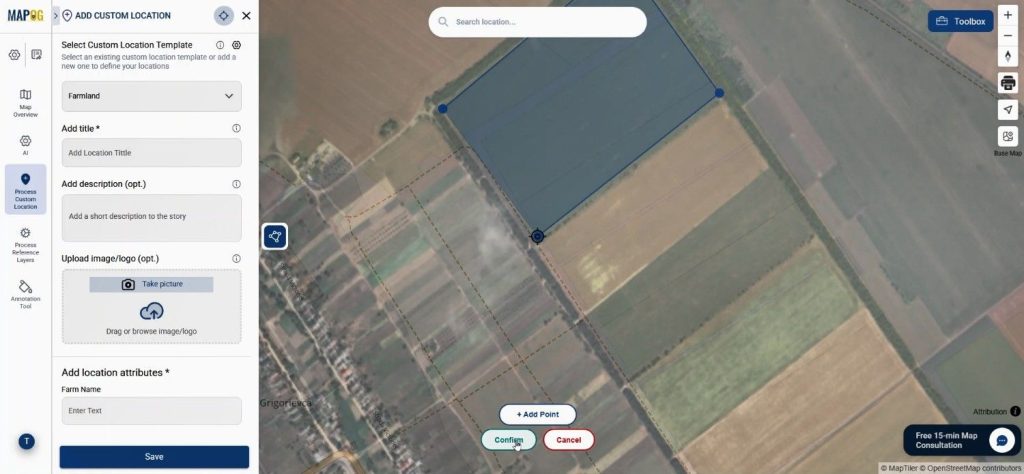
After saving the template, users select it from the dropdown and use the draw polygon tool to start drawing polygons along the edges of each crop field using add point, and when the boundary is done they confirm it.
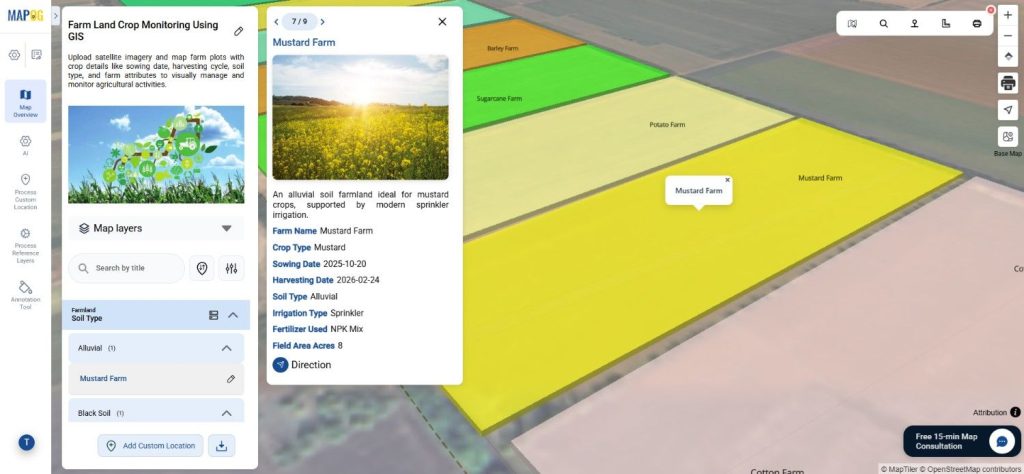
Step 4: Add Crop Details and Improve Visualization
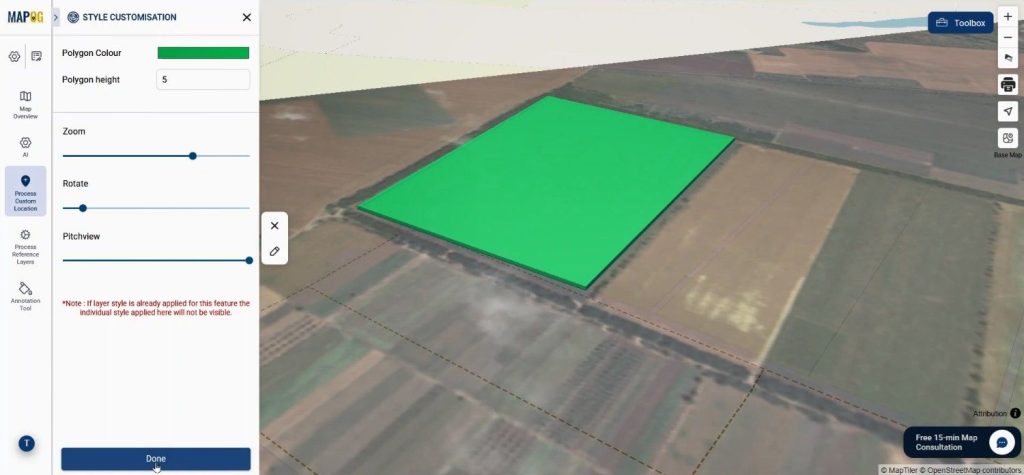
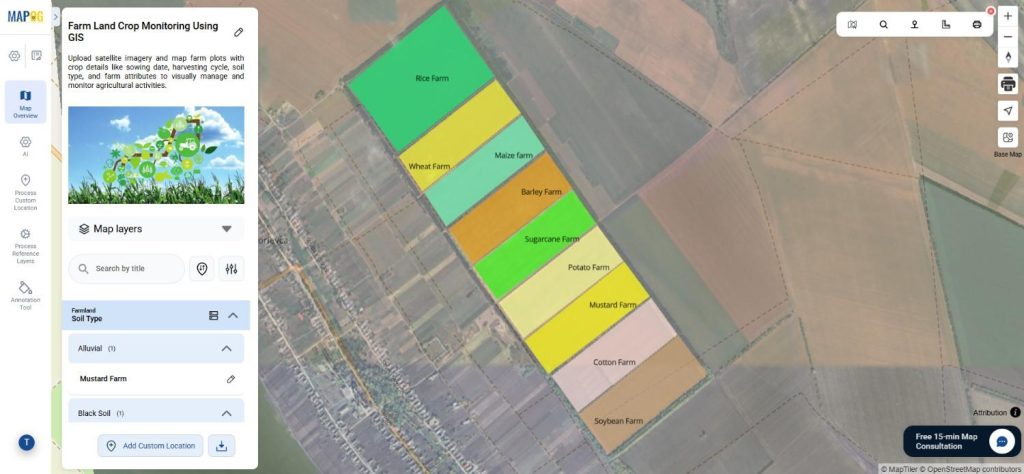
Using the Edit Attribute option, users can adjust color and height values along with Zoom, Rotate, and Pitch so different crops appear visually distinct
Now, users can insert crop data such as farm name, description, images, and attribute details.
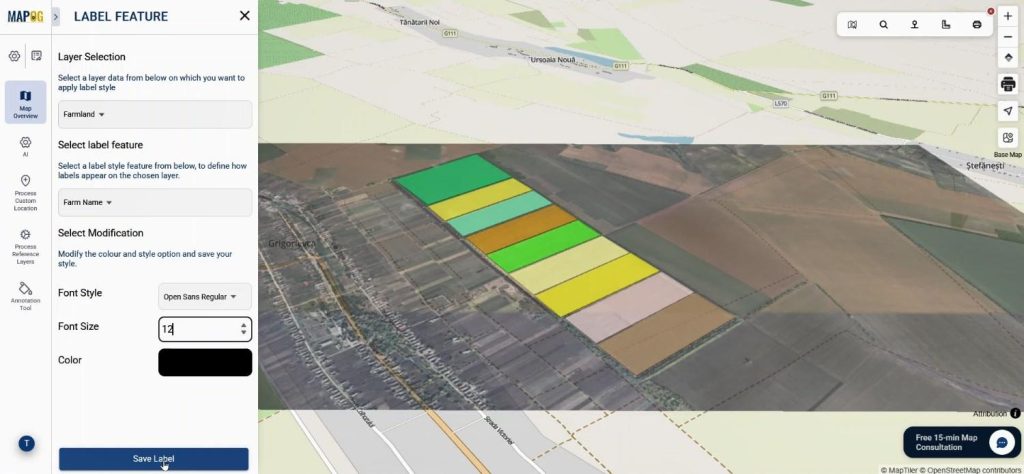
Meanwhile, the Label Feature allows farm names to appear directly on the map by selecting an attribute and customizing font, size, and color.
Step 5: Filter, Organize, and Share the Farm Map
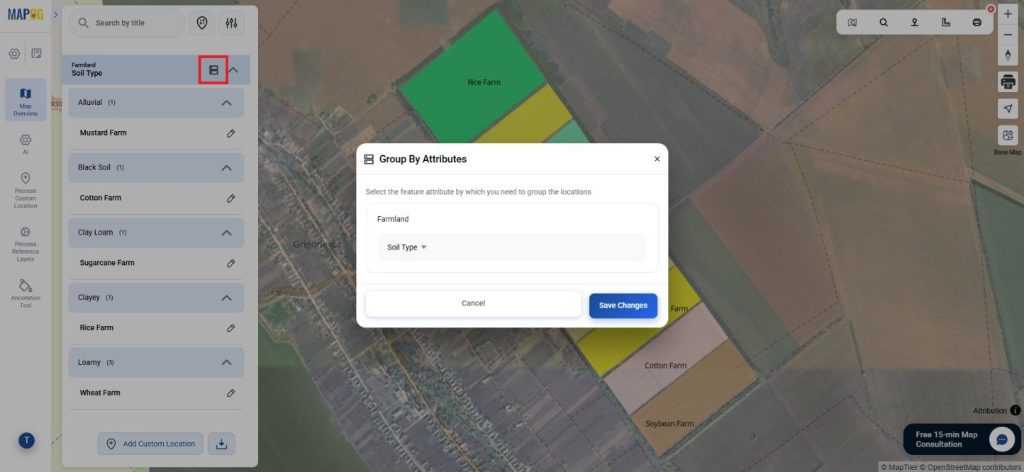
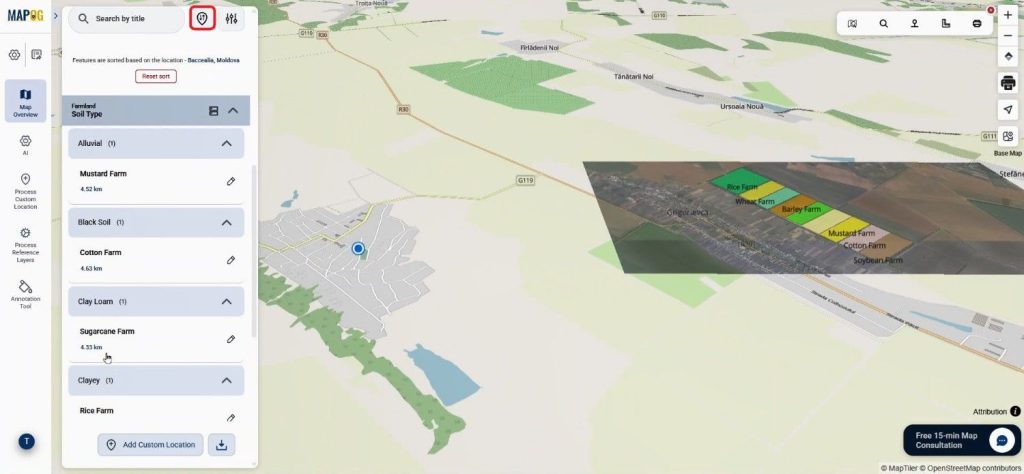
The Group by Attribute option clusters farms based on attributes such as crop type or soil condition.
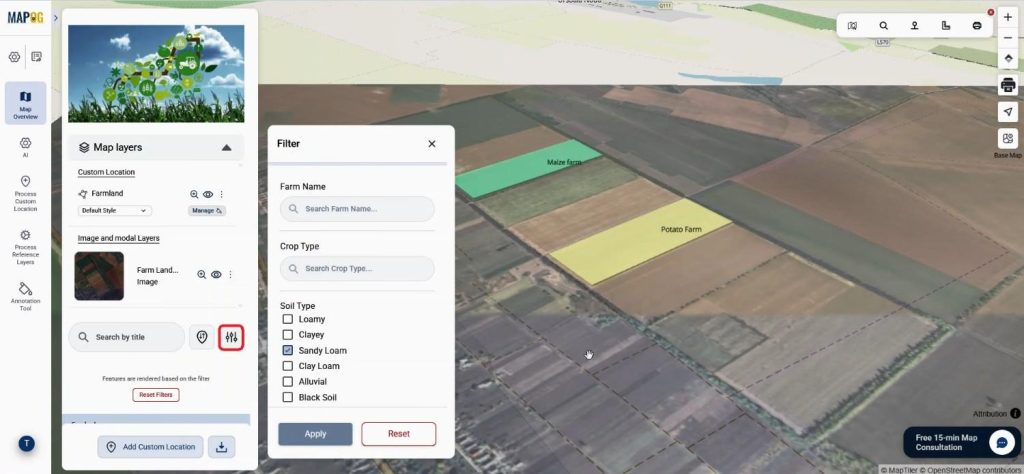
Meanwhile, the Filter Tool allows only selected farms to appear on the map, which helps during crop analysis.
Another useful feature is Sort by Distance, where a location can be searched and the system shows nearby farms based on proximity.
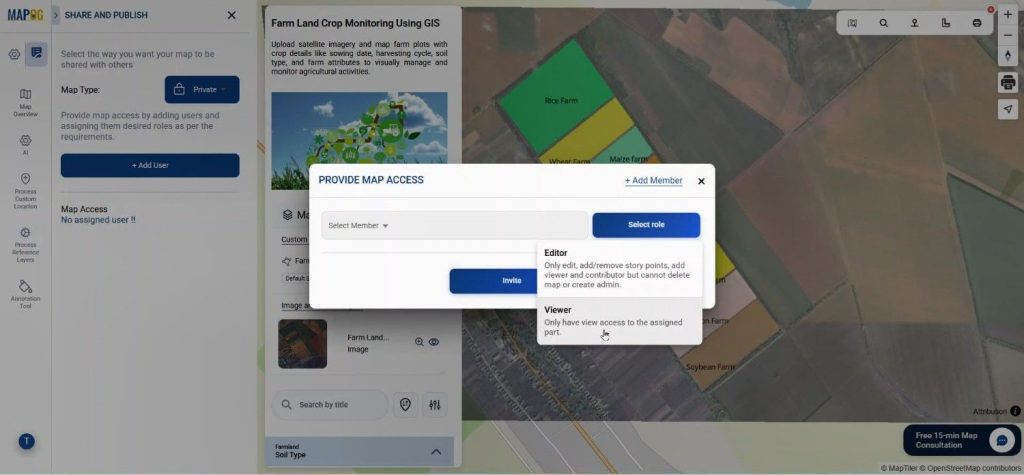
Step 6: Preview & Share
Finally, the map can be shared using Preview and Share. With private option we can select add user & provide significant roles to members & invite them for collaboration.
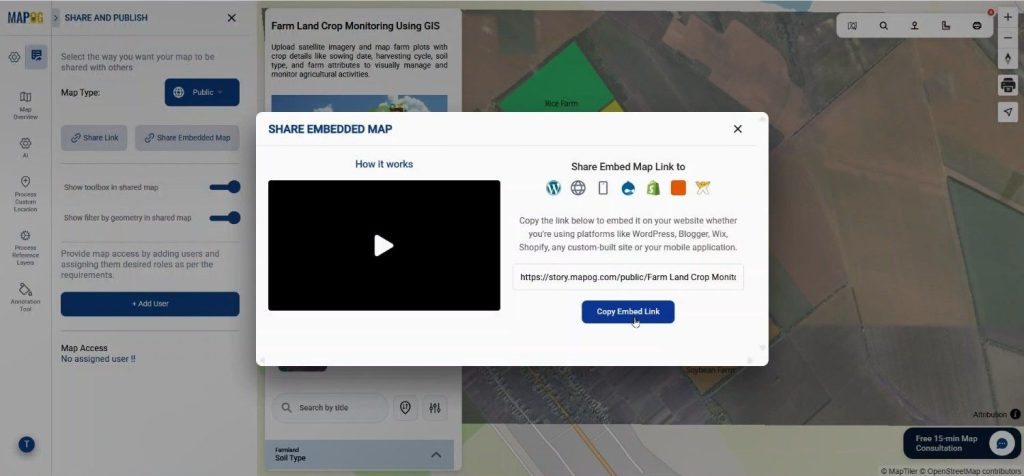
by changing the map sharing to public, we can share the map link or embed to any website as per choice.
Industry Benefits of Mapping Farm Land Using Satellite Images
Mapping farmland using satellite images offers numerous advantages for organizations. Real estate planners can assess land prior to acquisition, while agricultural teams can visually monitor crop cycles and soil conditions. Large estates are documented more accurately compared to traditional surveys. For instance, land developers can identify crop zones and irrigation patterns, and agricultural consultants can track sowing and harvesting schedules through polygon mapping. Thus, MAPOG effectively connects satellite imagery with agricultural management.
Conclusion
Today, digital mapping of farmland is accessible to everyone, not just GIS experts. Tools such as Georeferencing and Add Manually in MAPOG allow users to map farmland using satellite images and store detailed crop data on an interactive map. This enables agricultural professionals and real estate planners to gain better insights into land use, crop distribution, and management, facilitating improved planning decisions. Sharing experiences of using satellite images for land mapping could inspire others in agriculture and real estate.