Optimizing logistics requires a clear view of how goods move from warehouses to retail outlets. Mapping your supply chain improves visibility, efficiency, and decision-making. To map a supply chain the best platform is MAPOG, where, you can create an interactive map that visualizes every point in your logistics network. GIS optimizes supply chains by enabling route planning, fleet tracking, warehouse site selection, demand forecasting, and risk assessment, while improving inventory management, reducing costs, enhancing delivery efficiency, and supporting data-driven decisions across the supply network.
Key Concept: Why Map Your Supply Chain
Tracking multiple warehouses, distribution centers, and retail outlets across regions can be complex. A supply chain map helps businesses see how goods move across warehouses, distribution centers, and retail outlets. Mapping transforms this complexity into clarity by:
- Visualizing the full supply chain network
- Identifying bottlenecks and inefficiencies
- Supporting strategic expansion and inventory management
- Enabling faster, data-driven decision-making
Step-by-Step Guide to Mapping Your Supply Chain
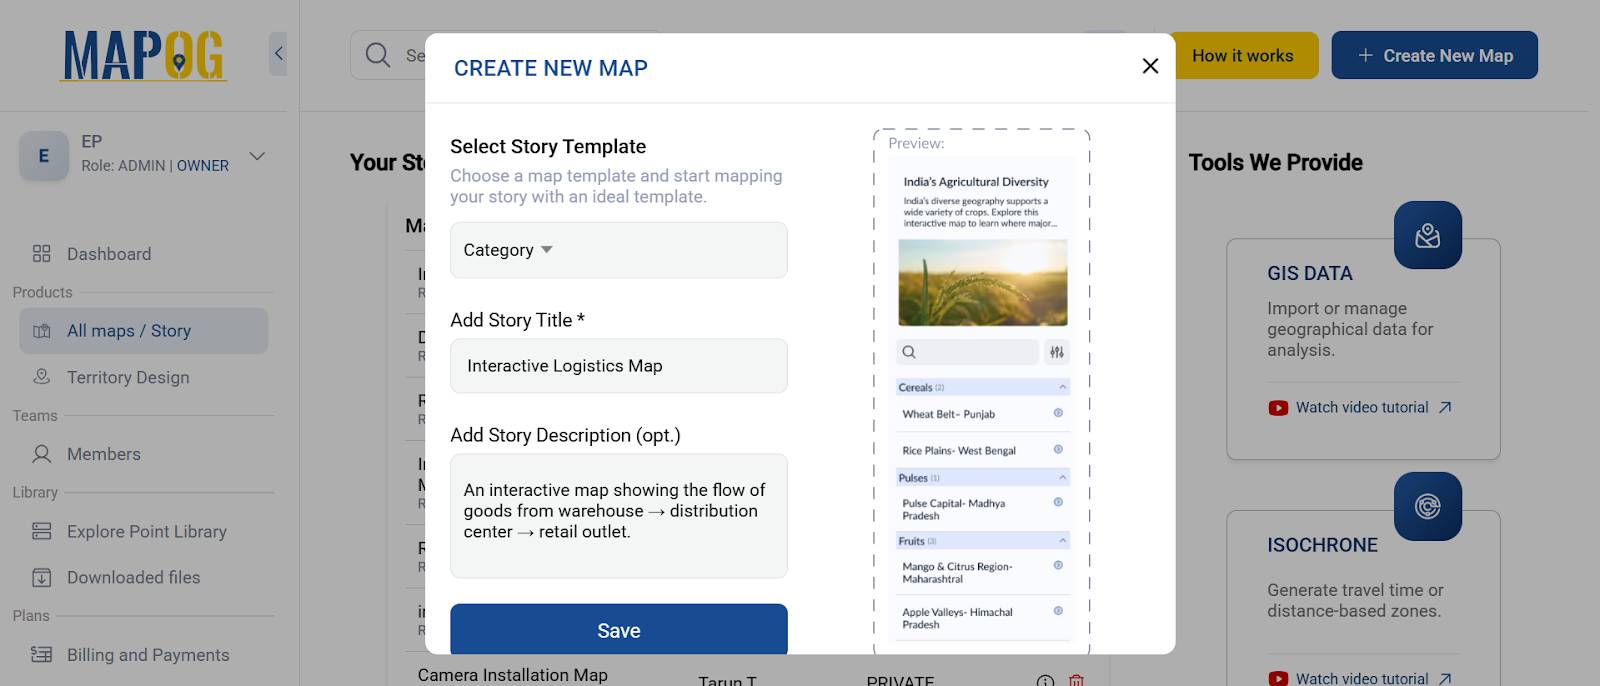
1. Begin by opening MAPOG and creating your Supply chain map.
- First, go to MAPOG and click Create new map.
- Then, select the Category template.
- Next, add a clear title (e.g., “Interactive Logistics Map”) and a short description.
- Finally, Click Save to begin.
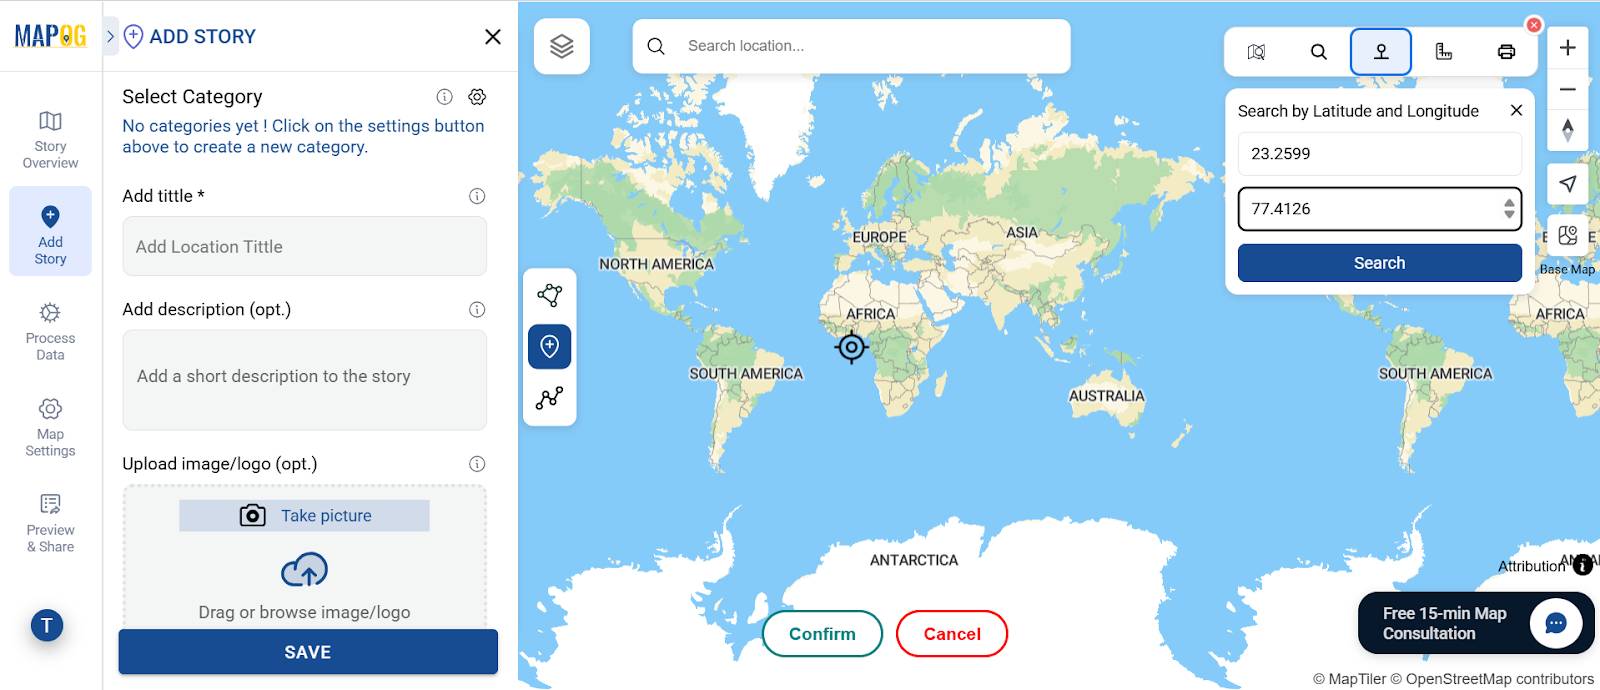
2. Add the point locations to build your map.
- Enter latitude and longitude coordinates for all supply chain points:
- Warehouses – act as hubs
- Distribution centers – connect to warehouses
- Retail outlets – connect to distribution centers
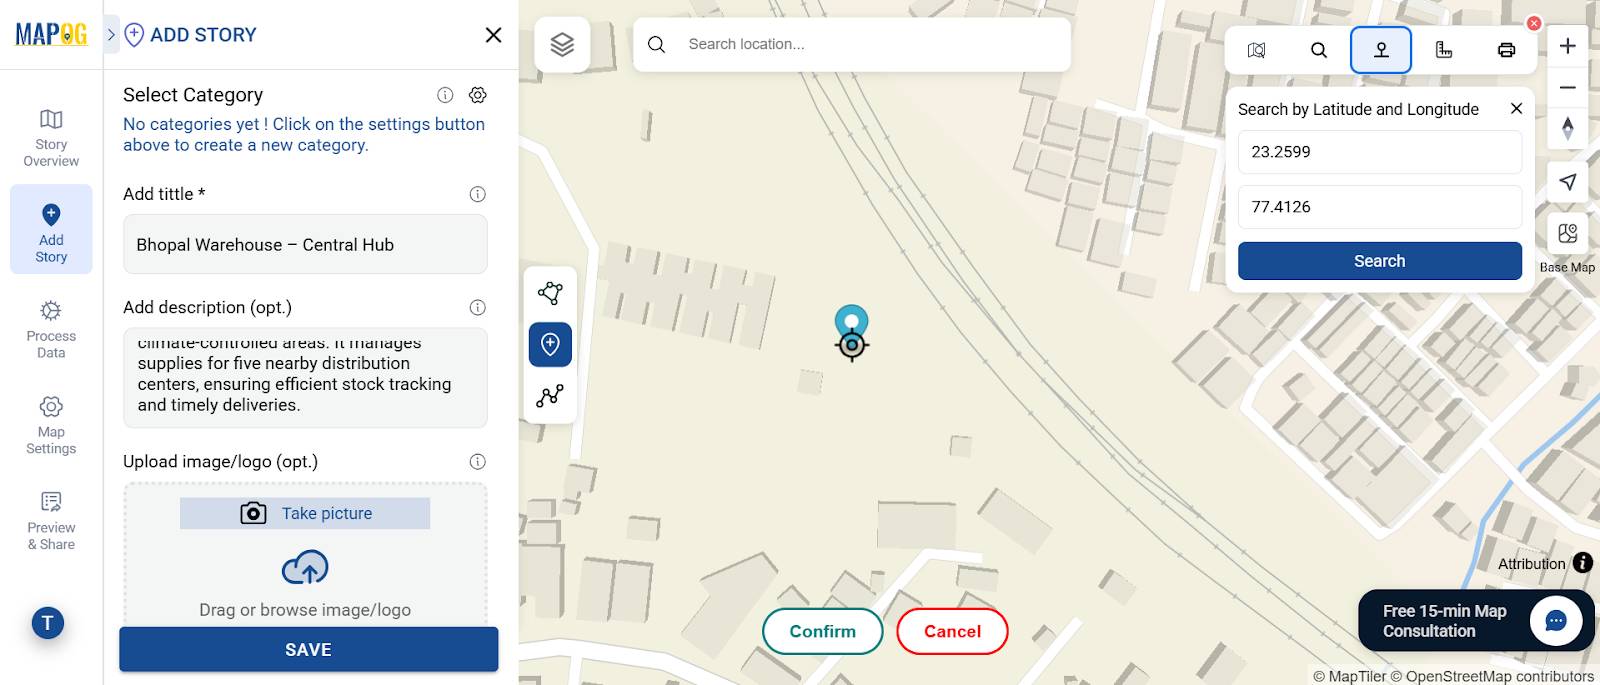
3. Proceed by marking the locations on the map.
- First go to Add Story → Add Manually → Add Point to place pins on the map.
- In addition add titles and descriptions for each point.
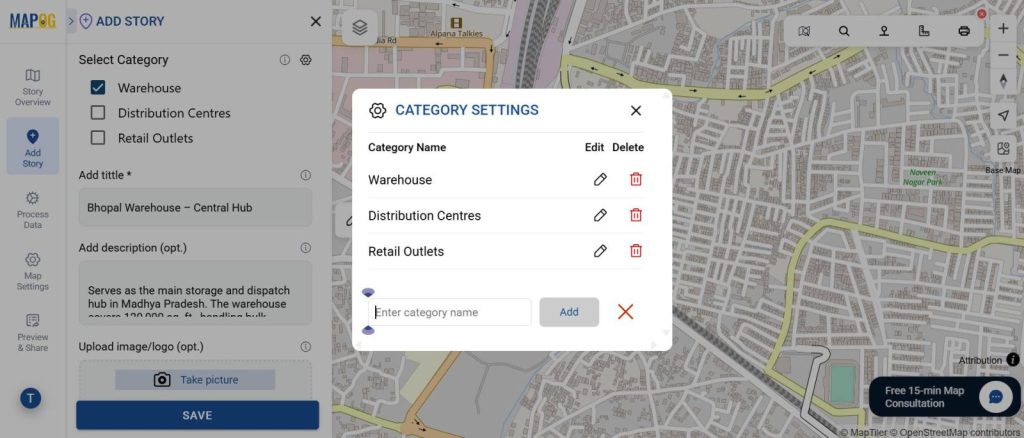
4. Assign each point to the right category.
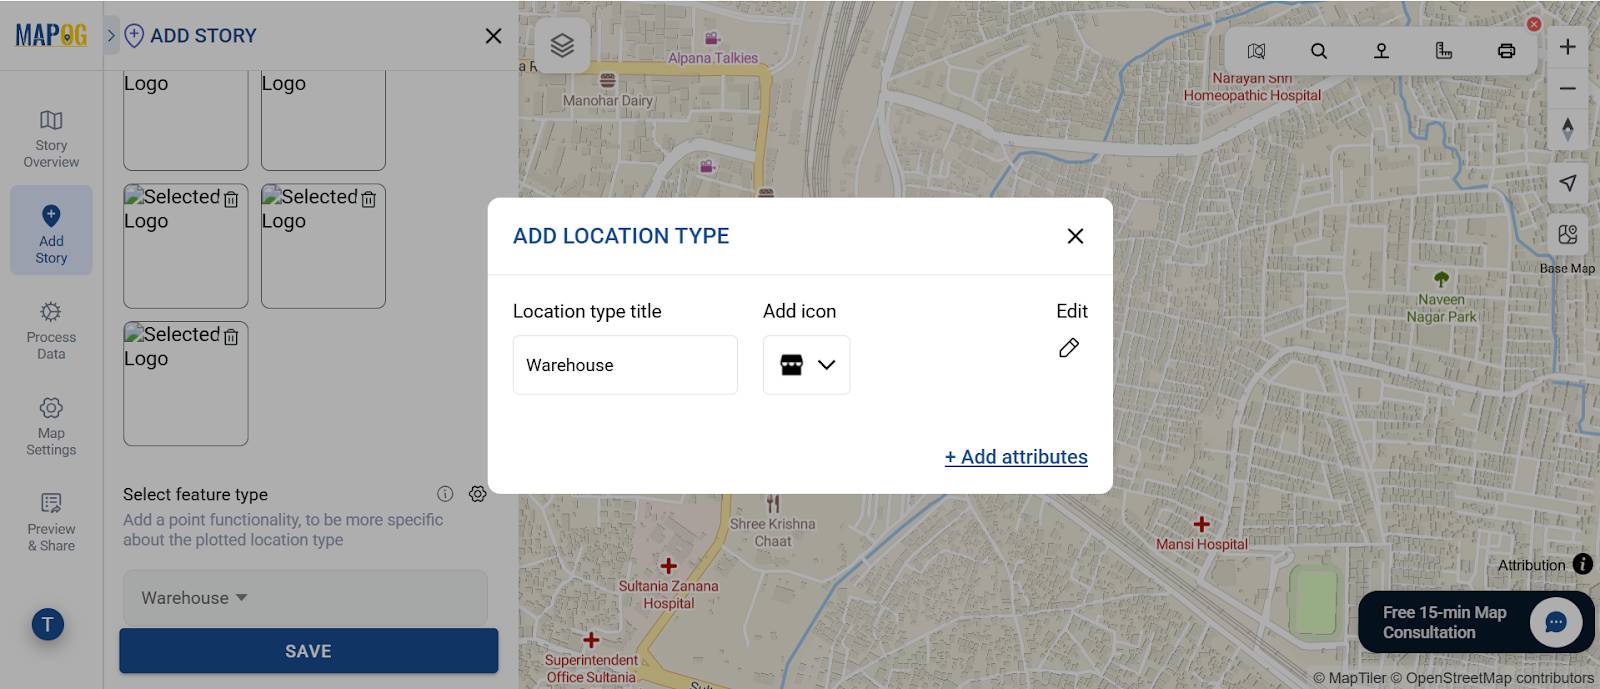
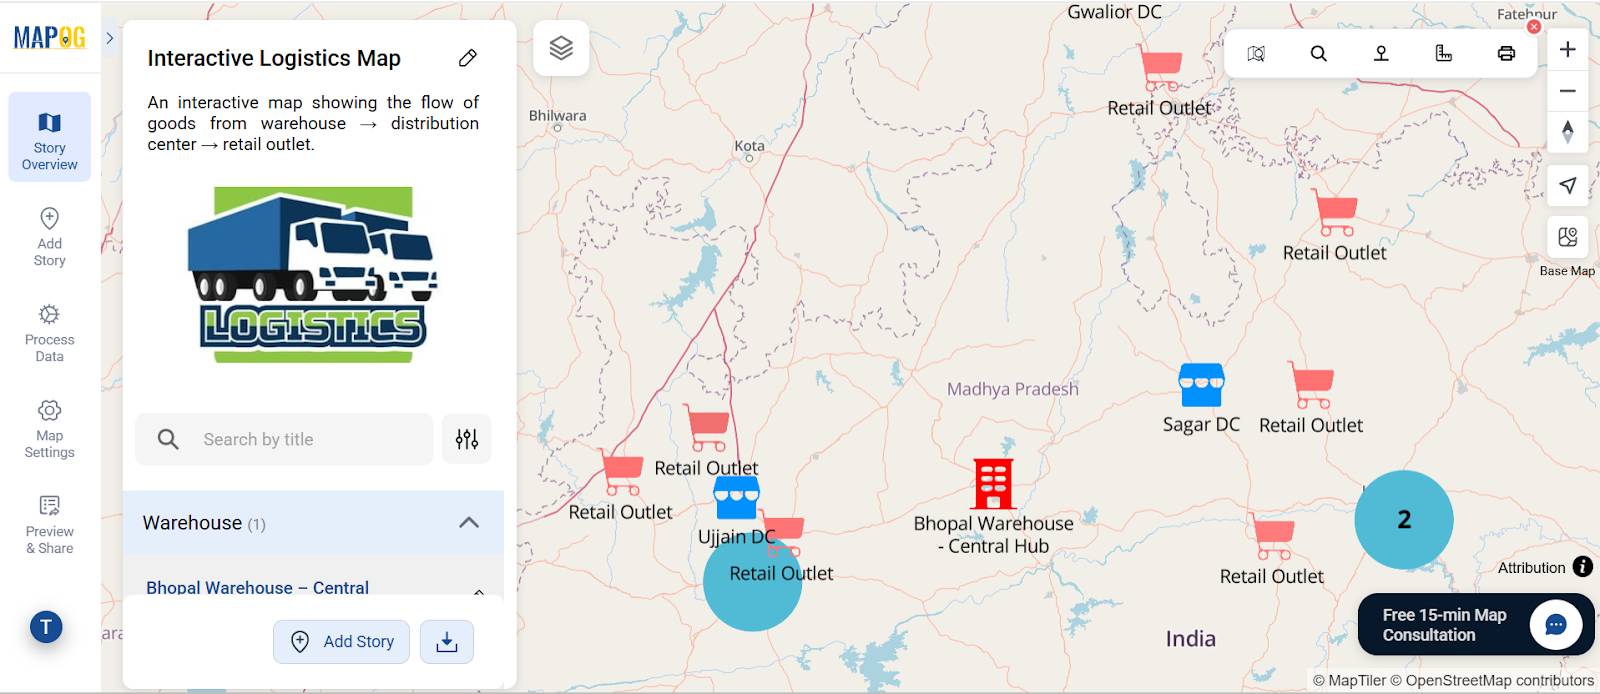
Next, it’s time to bring clarity to your map by categorizing your points. Head over to the Select Category Settings option. Here, create three main categories: Warehouse, Distribution Center, and Retail Outlet. Then, assign each point to the correct category by choosing it from the dropdown.
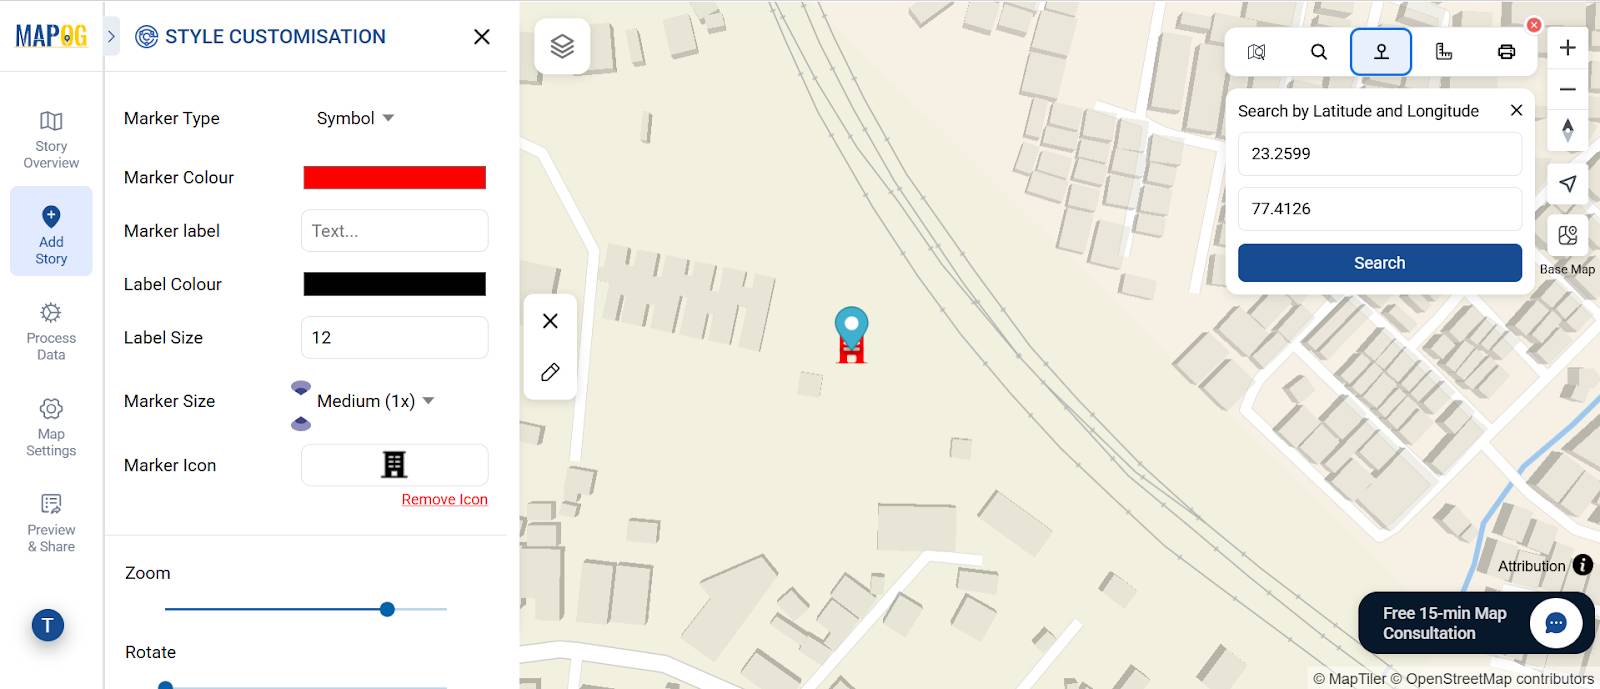
5. Personalize your pins and markers to make the map visually clear.
- Adjust pin shapes, colors, and labels for each category by clicking on the pencil icon.
- Moreover, add images or other contextual information for stakeholders.
- Optionally, use contour lines or markers for visual enhancement.
6. Enhance your map by adding linking attributes to every point.
Define Relationships Between Points Using Attributes
First, Select Feature Type – Click on the settings icon next to the feature type you’re working with (e.g., Warehouse, Distribution Center, Retail Outlet).
Next, Open Attributes Tab – Inside the feature type settings, go to the “Attributes” tab.
Then, Add Custom Fields – Create new fields to capture relationships, details and descriptions.
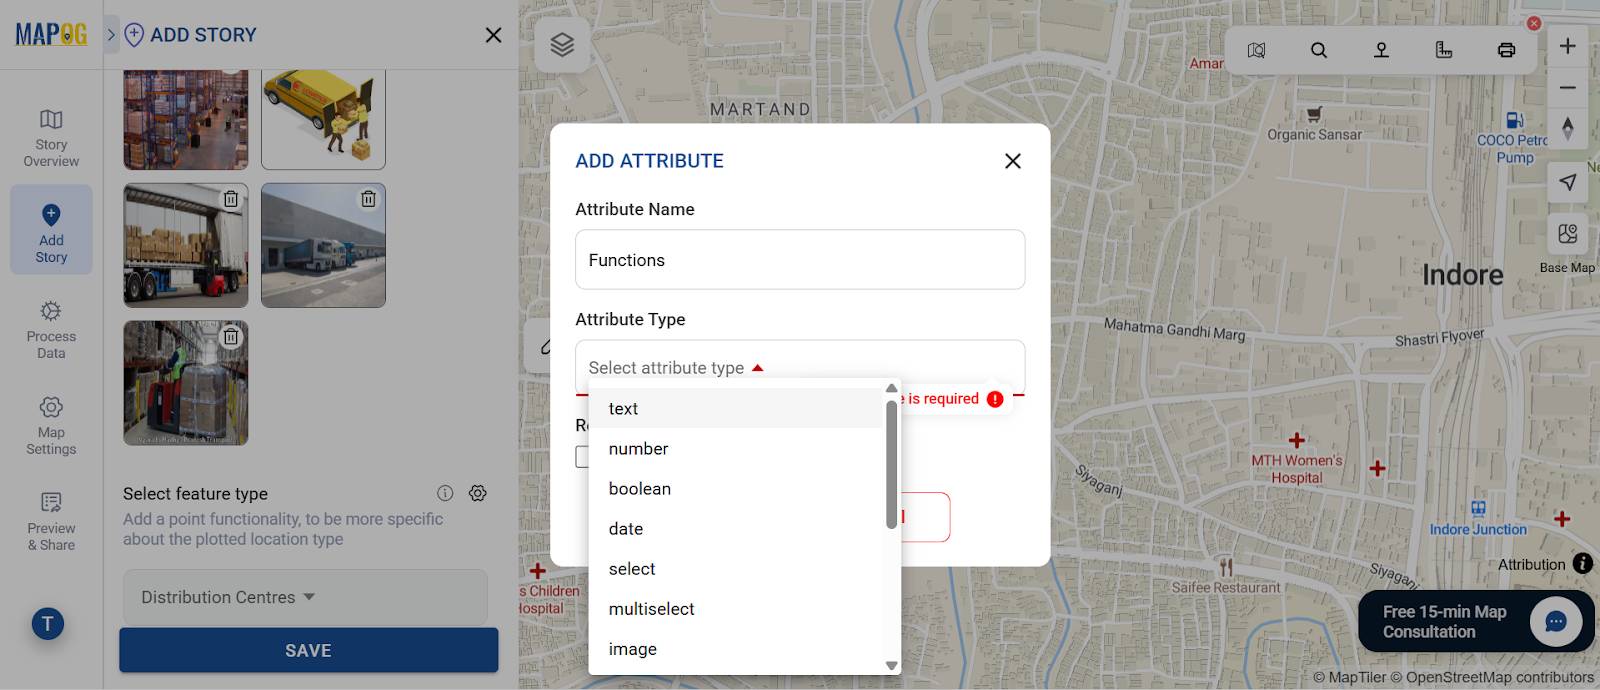
- Attribute types like,
- Text → names, IDs, or locations
- Number → storage capacity or outlet count
- Boolean (Yes/No) → features like cold storage
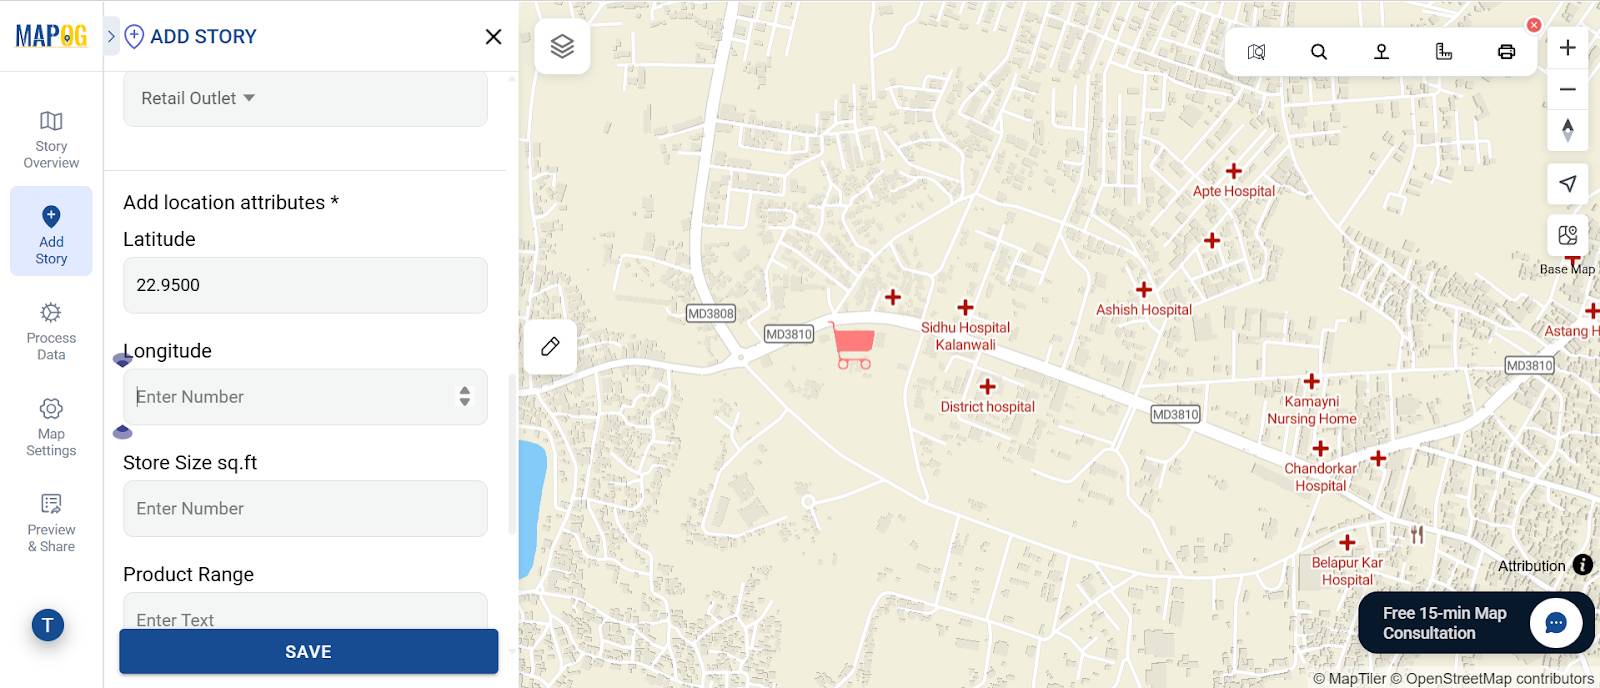
- Assign attributes to each point to make the map interactive and filterable.
Then, fill up all the required information and save it.
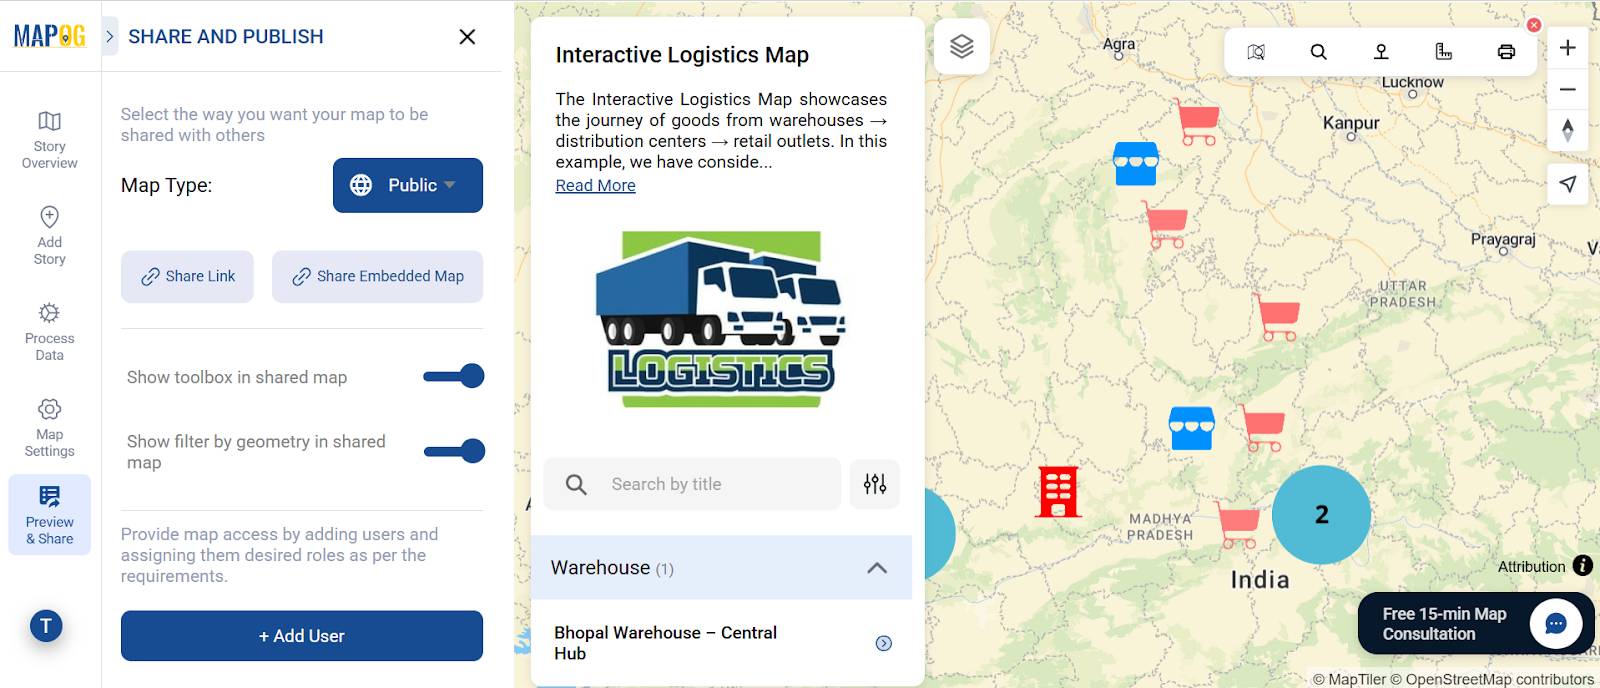
6. preview your map and share it once it’s ready.
- After adding all points, categories, and attributes, your map is ready.
- Use the Preview & Share option to share the map publicly.
Benefits of Supply Chain Mapping
With MAPOG, supply chain mapping becomes simple, interactive, and efficient. Mapping your supply chain provides:
- A visual overview of the logistics network
- Identification of bottlenecks and underperforming nodes
Support for inventory management, cost reduction, and strategic planning - Easier understanding for stakeholders and team members
- Optimizes operations and efficiency across industries such as retail, manufacturing, e-commerce, and logistics
Conclusion
Effective supply chain management goes beyond moving goods, it’s about making informed decisions. Mapping warehouses, distribution centers, and retail outlets with categories, custom pins, and linking attributes allows managers to track, analyze, and optimize every node. MAPOG simplifies the process, making your logistics network transparent, interactive, and actionable.