Collect Location-Based Field Data face many challenges due to reliance on paper records and delayed updates, leading to errors in water source mapping and village development projects. The MAPOG Survey and MAPOG Contributor mobile app address these issues by enabling real-time data collection on live maps, improving accuracy and decision-making. With MAPOG, teams can assign survey locations, track submissions, and maintain connectivity between office and field contributors.
Key Concept of Collect Location-Based Field Data
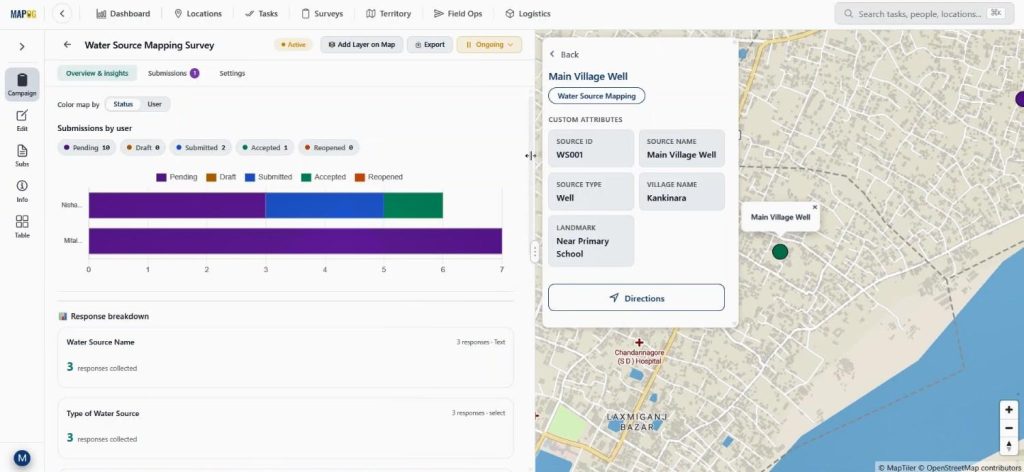
To collect location-based field data, a proper location template, survey structure, and mobile workflow are essential. For instance, in water source mapping, users should detail all wells, ponds, hand pumps, and drinking water points with IDs, types, conditions, and photos.
MAPOG facilitates this by allowing users to create structured surveys that plot locations on maps and assign them to contributors, enabling field staff to visit specific points, update records, and submit verified information through the MAPOG Contributor app.
Step-by-Step Process to Collect Location-Based Field Data
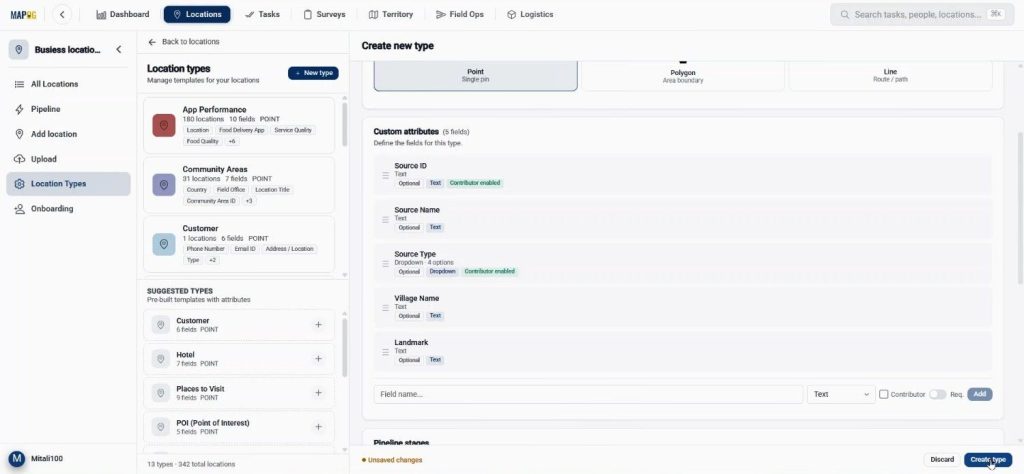
Step 1: Create a Location Type for Field Data Collection
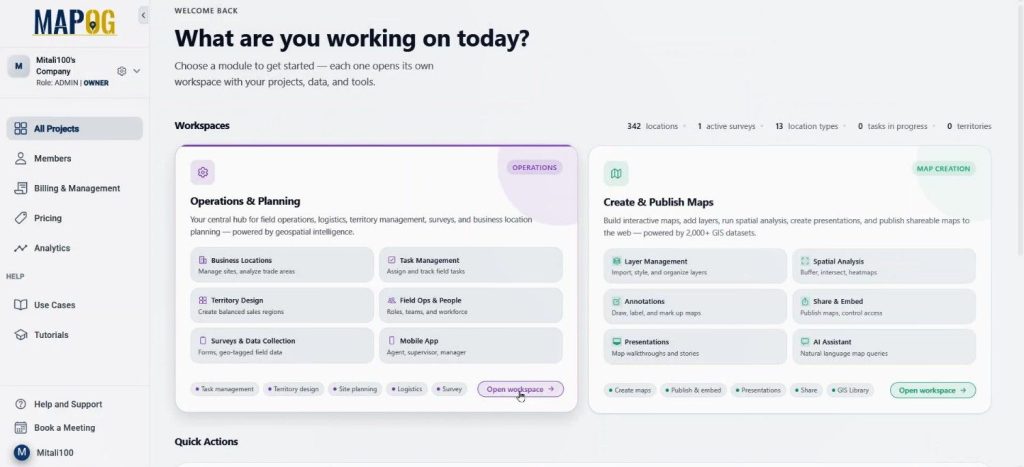
First, open MAPOG and go to Operation & Planning workspace.
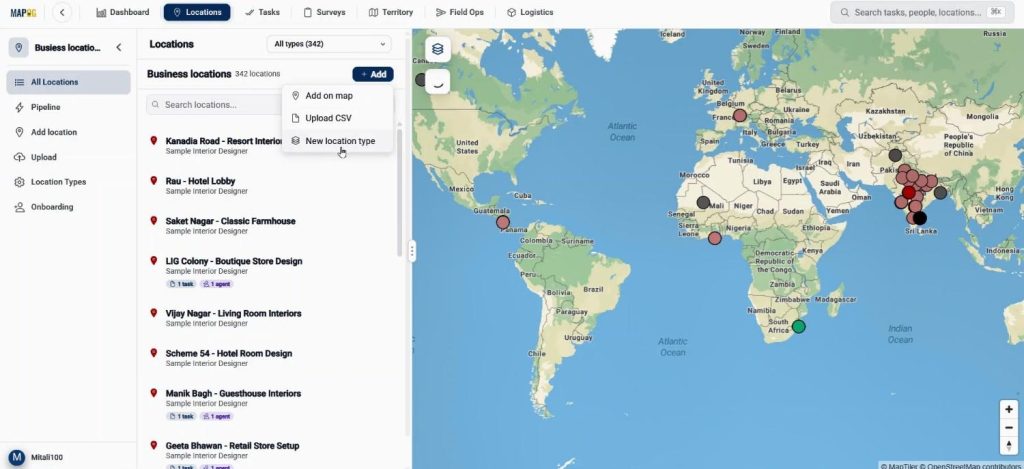
Then, move to the Location section and click Add. Here, select New Location Type to create a reusable template.
Now, provide the name, choose a color, and set geometry as a point.
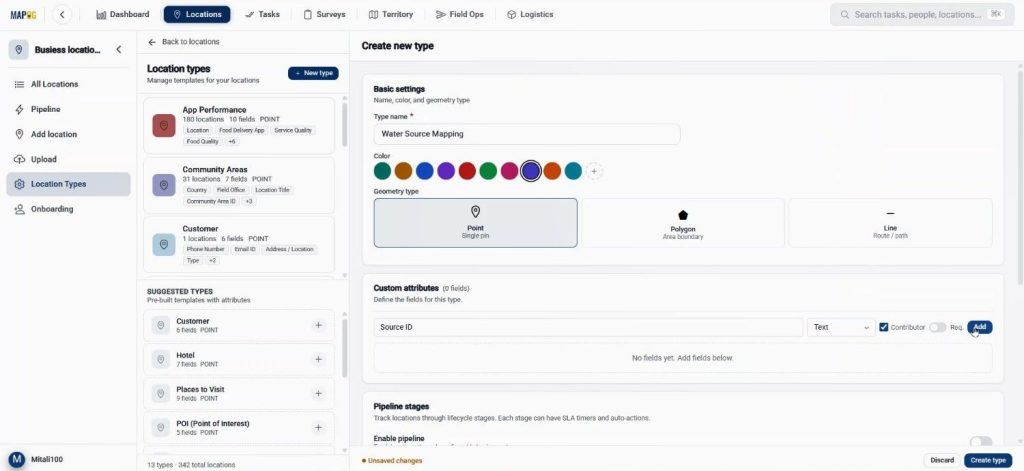
After that, add fields such as Water Source ID, Type using text, and select formats. Users should also enable contributor access so field teams can make updates from the field side. Once completed, click Create Type.
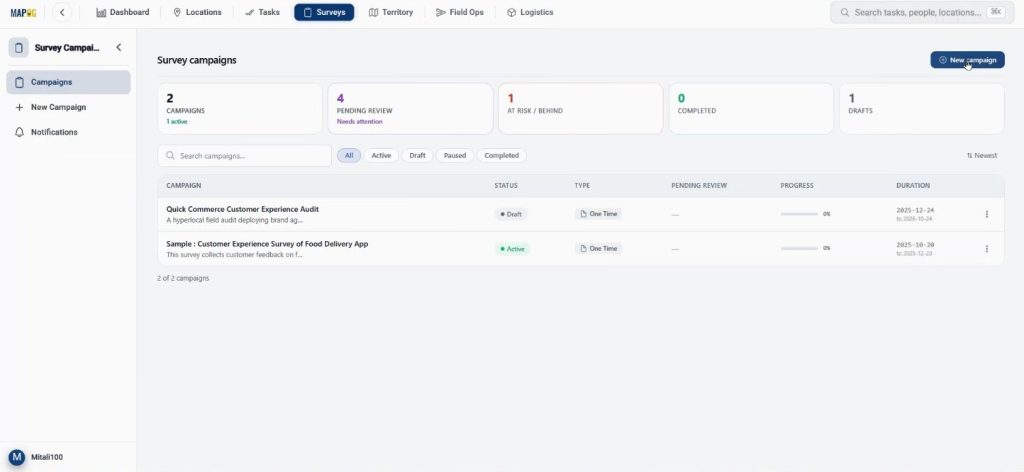
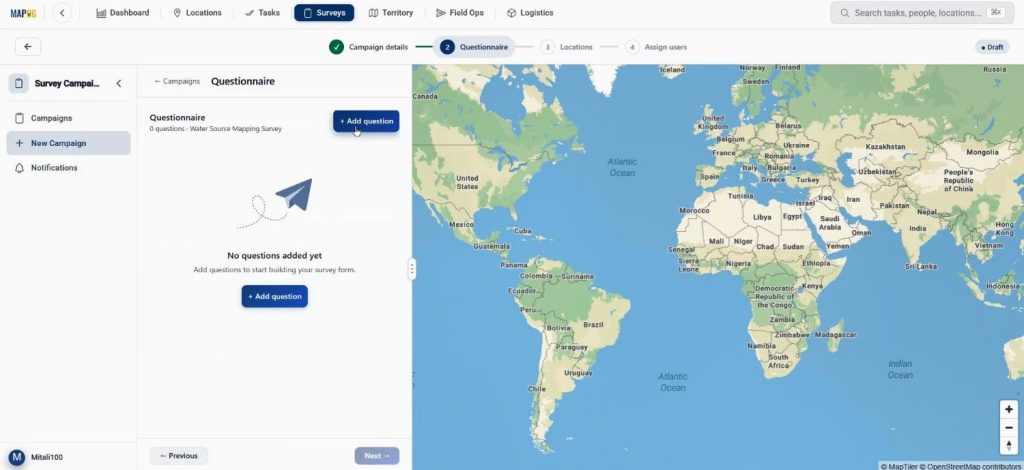
Step 2: Build the Survey Campaign for Location-Based Field Data
Next, go to the Survey section and click New Campaign.
In campaign details section add the project title, description, duration, and survey type.
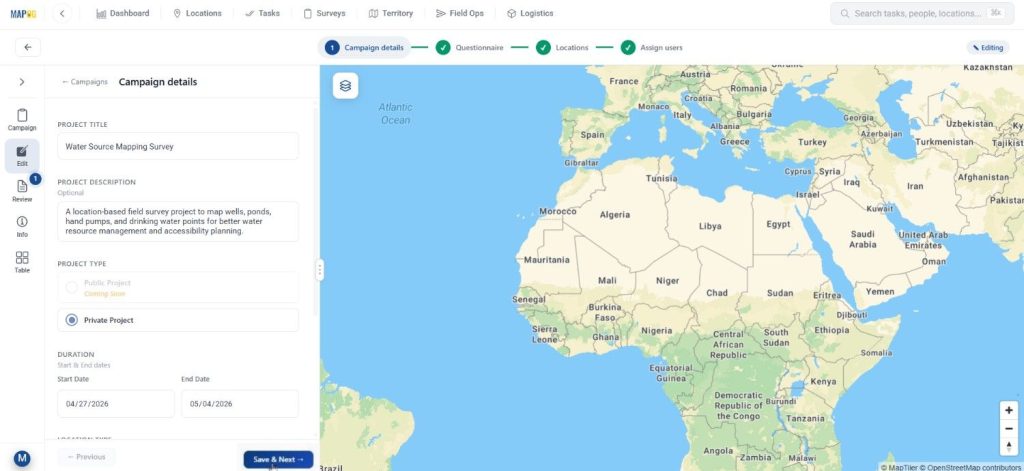
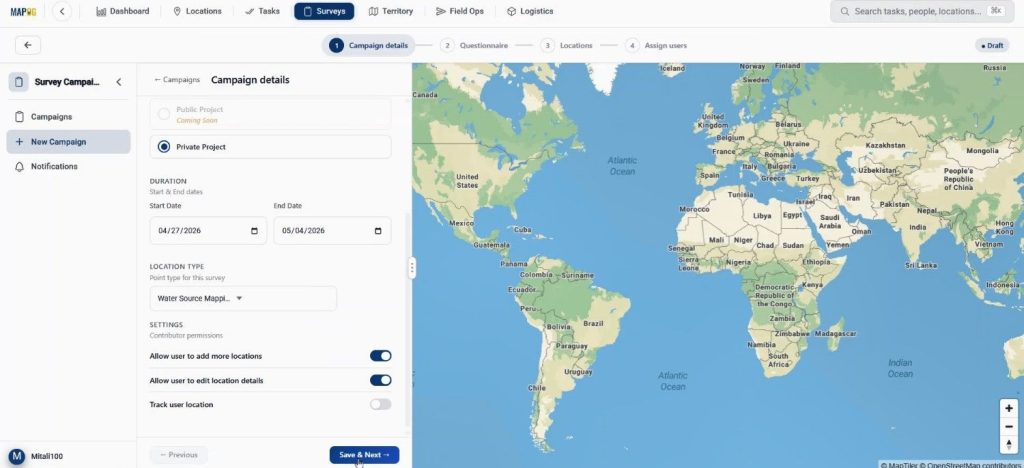
Then, choose the recently created location type from the dropdown. After that, enable settings like Add and Edit Location so contributors can update missing locations directly from the field. Then click save & next.
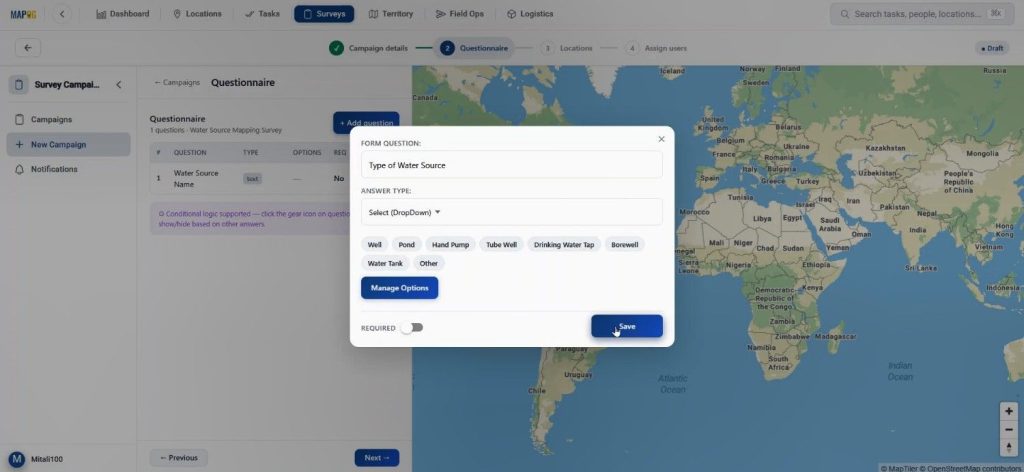
In the questionnaire section, using add question add different kinds of question such as source condition and image upload.
Since the platform supports different answer types, users can easily use text, select, and multi-select fields. Using manage option add different options for answers.
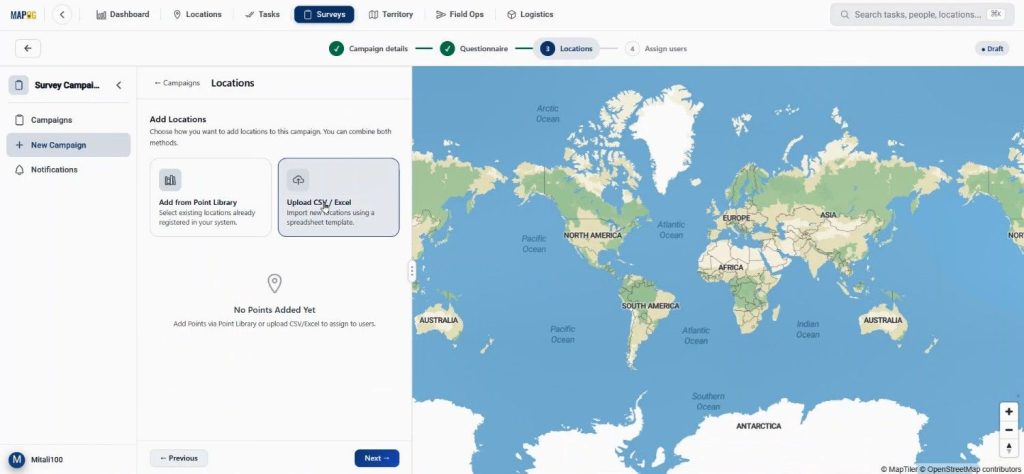
Step 3: Upload Locations and Plot Data on the Map
Now, move to the Locations section and click on upload csv/excel.
Browse & upload your prepared CSV or Excel file containing water source points.
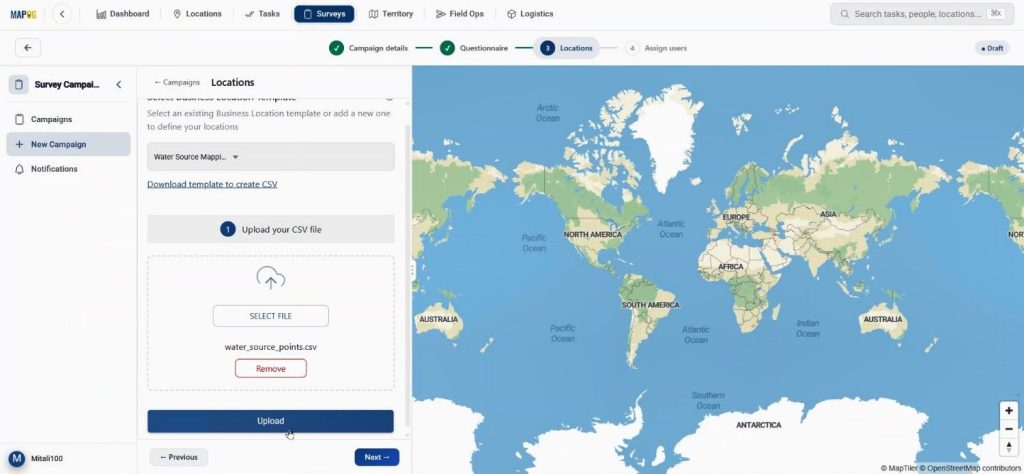
Select a unique ID to avoid duplication.
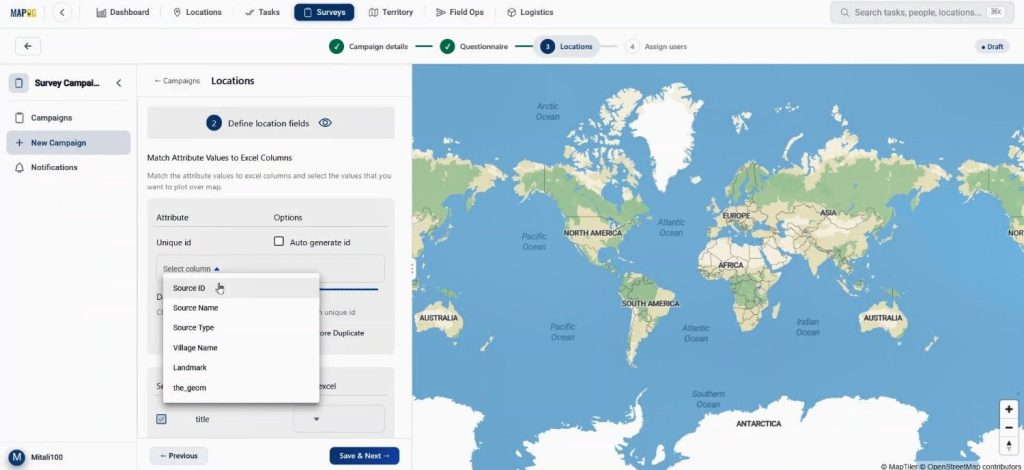
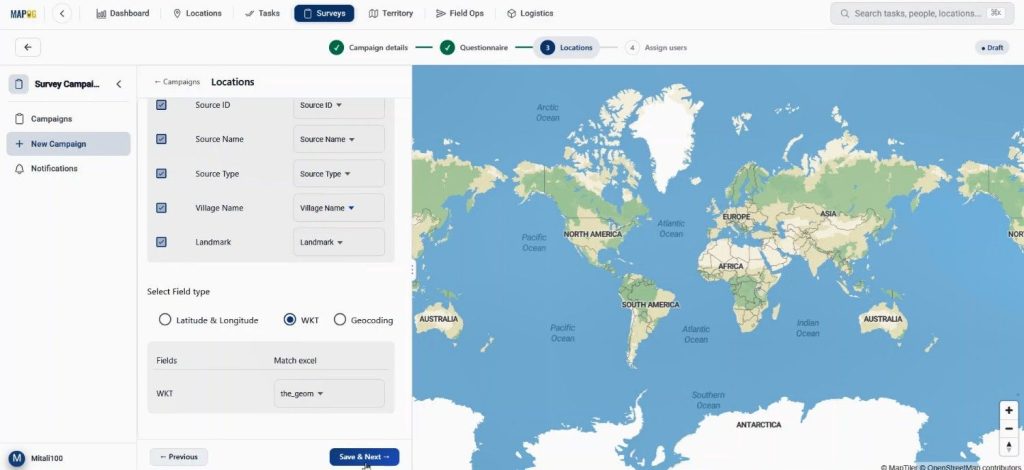
match the attributes properly.
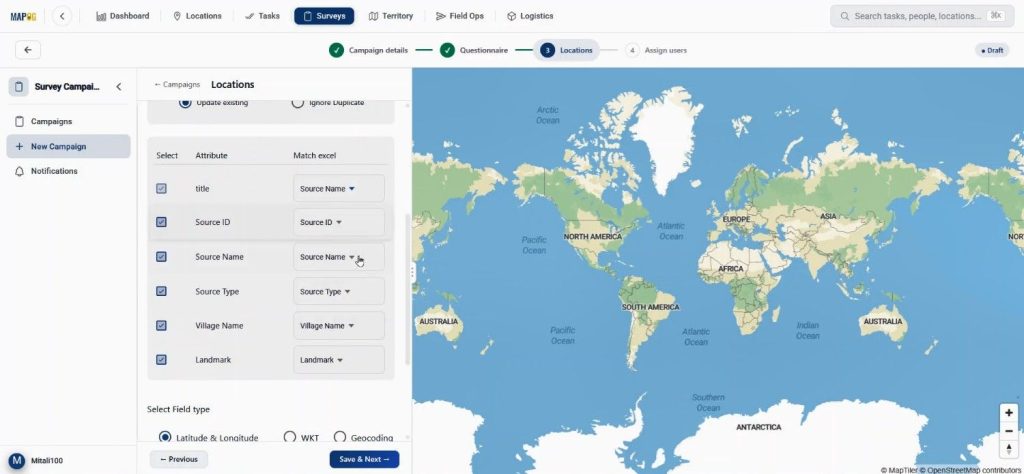
and choose WKT as the field type. Then hit save & next. Then, the system automatically plots all points on the map.
Step 4: Assign Users and Launch the Survey
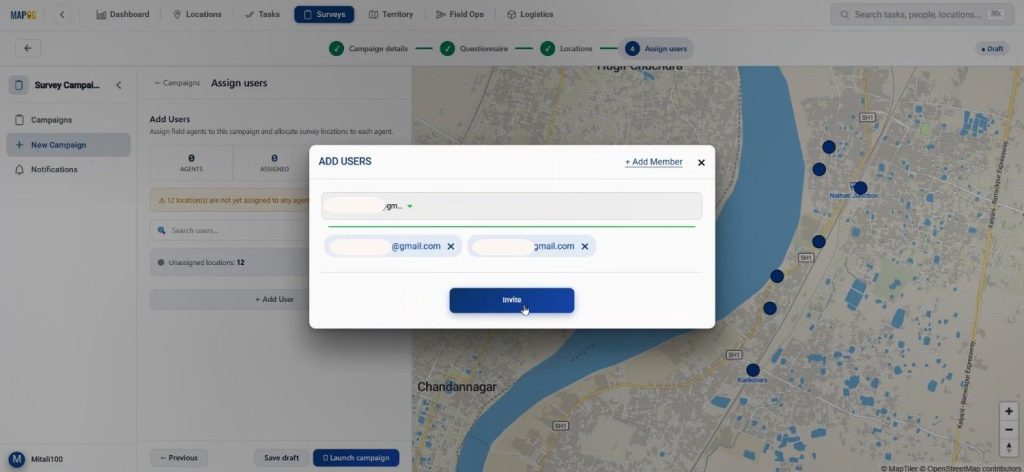
Then, go to Assign Users and click Add Member through Add User. Enter the assignee’s email and set roles like Admin or others depending on access needs.
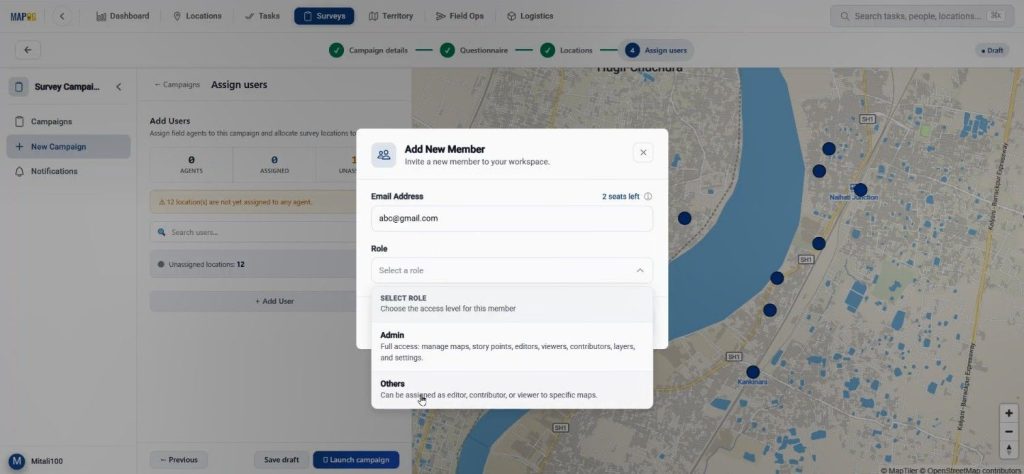
Then, select members from the drop down & invite them to participate on the survey.
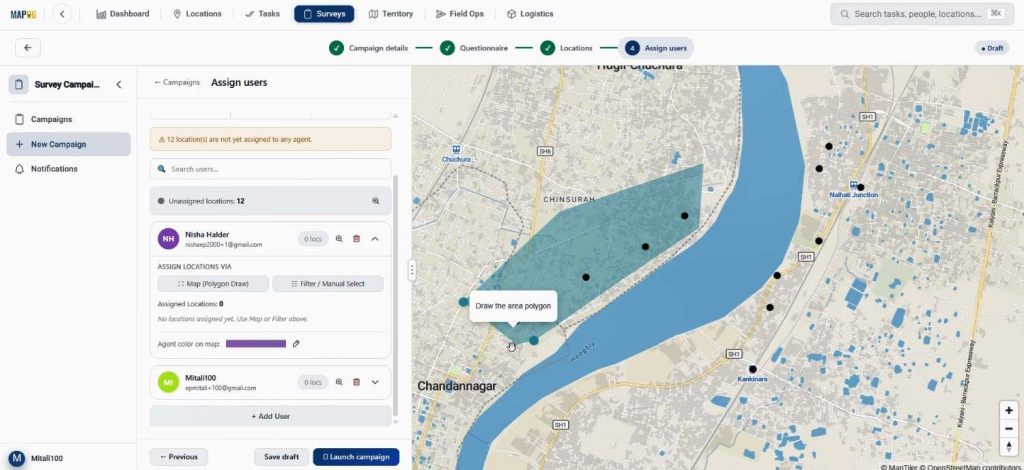
To assign specific points to team members, draw a polygon on the map by clicking on Map (Polygon Draw). This tool helps users divide areas among assignees.
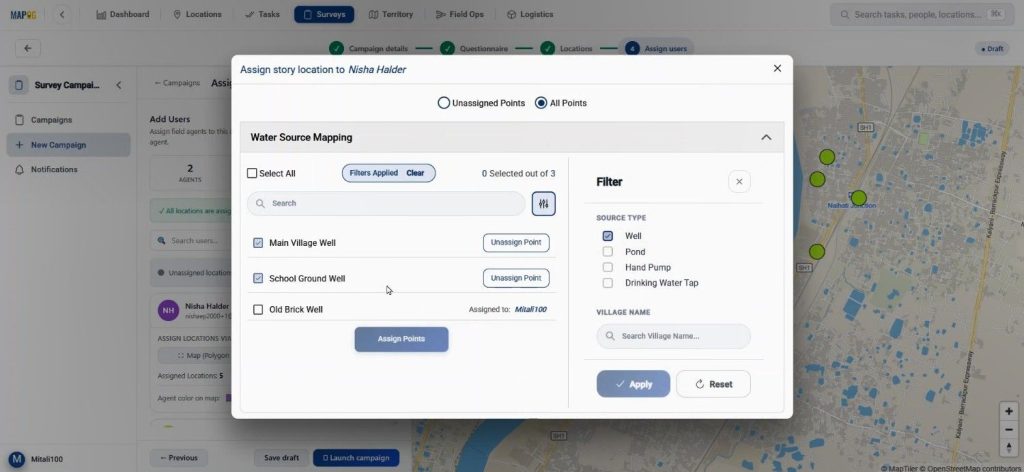
Additionally, filters help separate unassigned locations by village, type, or source category.
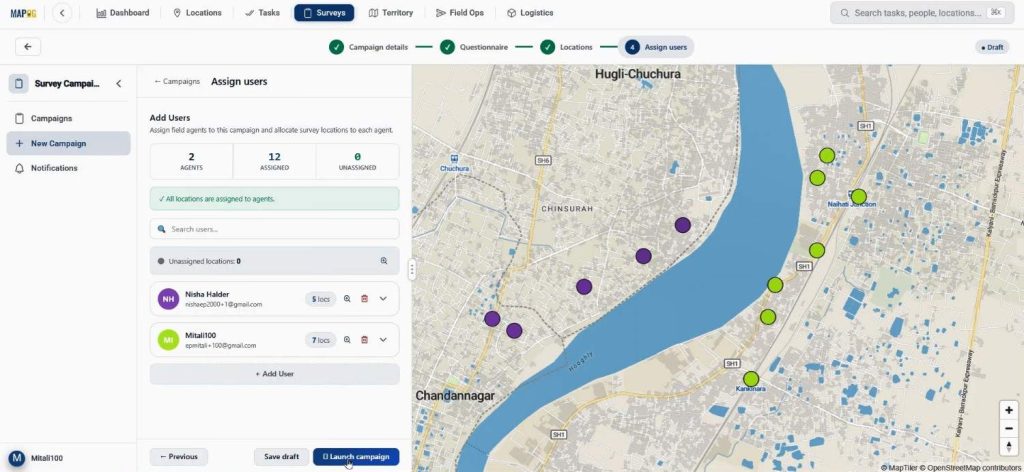
Finally, click Launch Campaign. Now the survey becomes active, and assignees receive tasks directly on MAPOG Contributor app.
Step 5: Field Survey Using MAPOG Contributor App
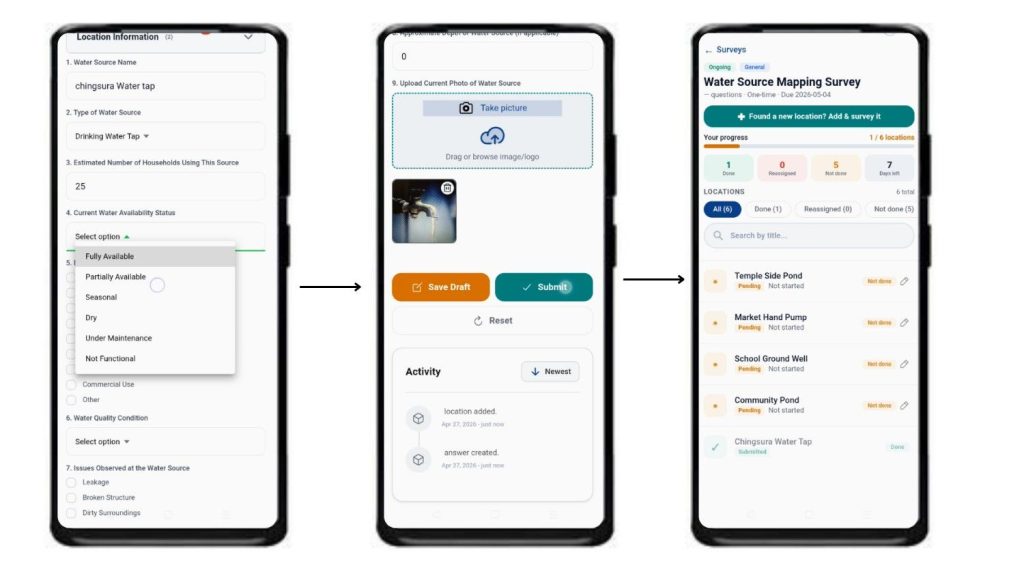
After opening the MAPOG Contributor app, contributors go to the Survey section and open their assigned project. If users find a new unregistered location, they can click + Find a New Location and place the point directly on the map. Then they can add required details & save the location.
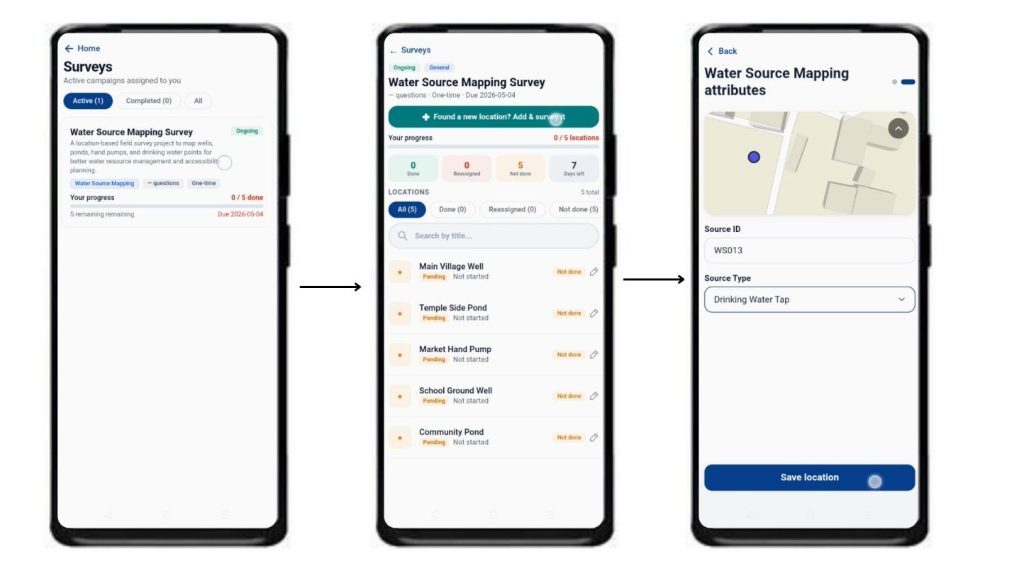
After saving the location, the survey form appears and can be completed with all field observations. It may be saved as draft or submitted directly. Because of this, field reporting becomes faster, cleaner, and easier to review later.
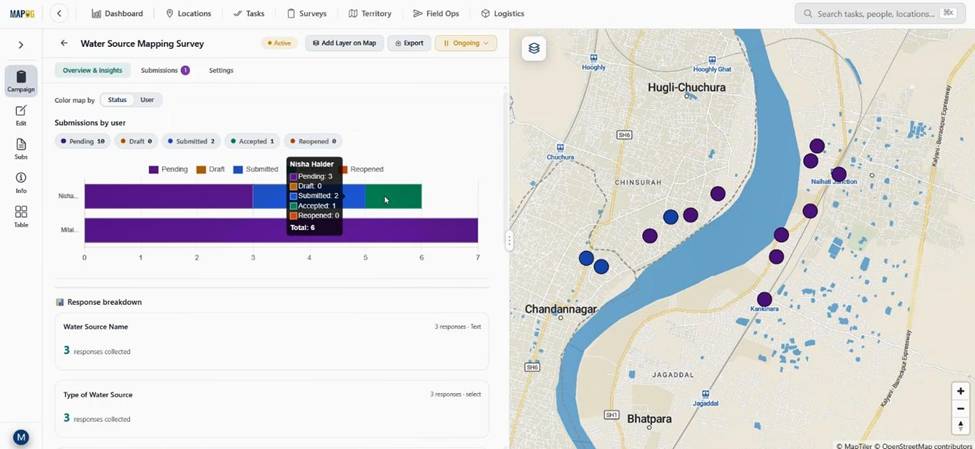
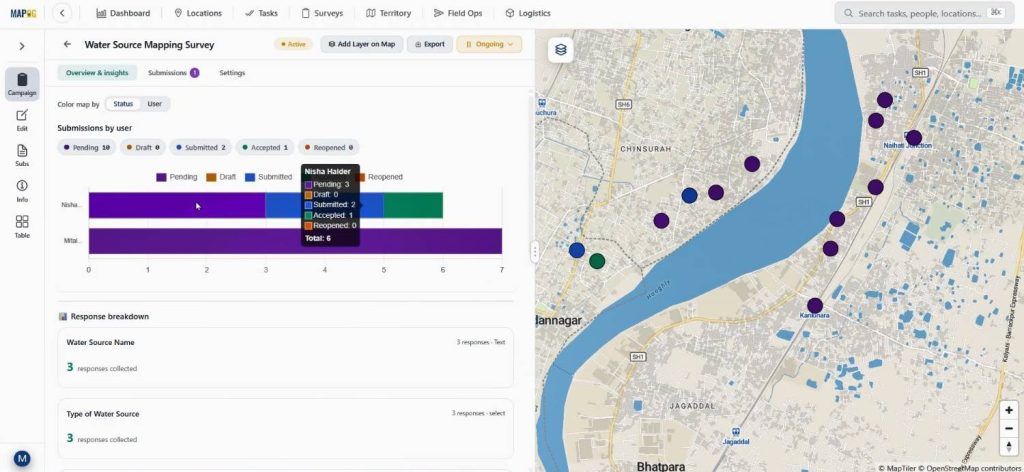
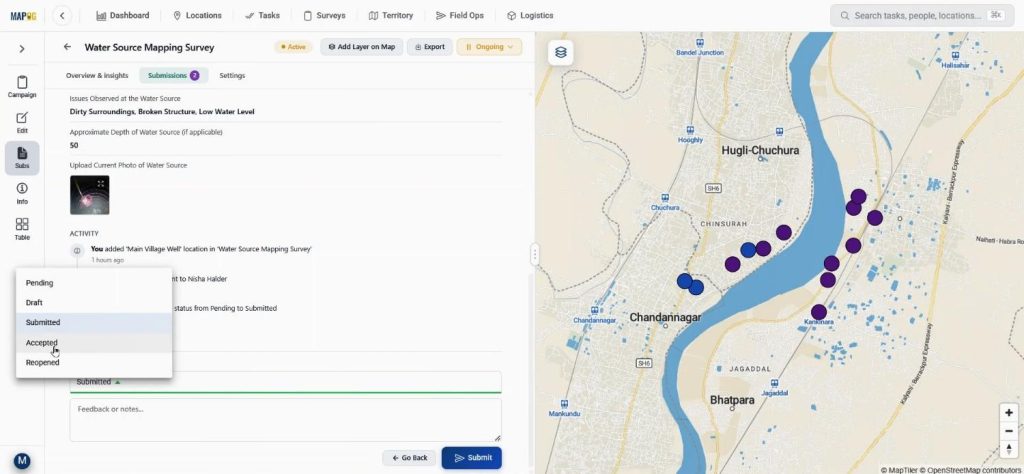
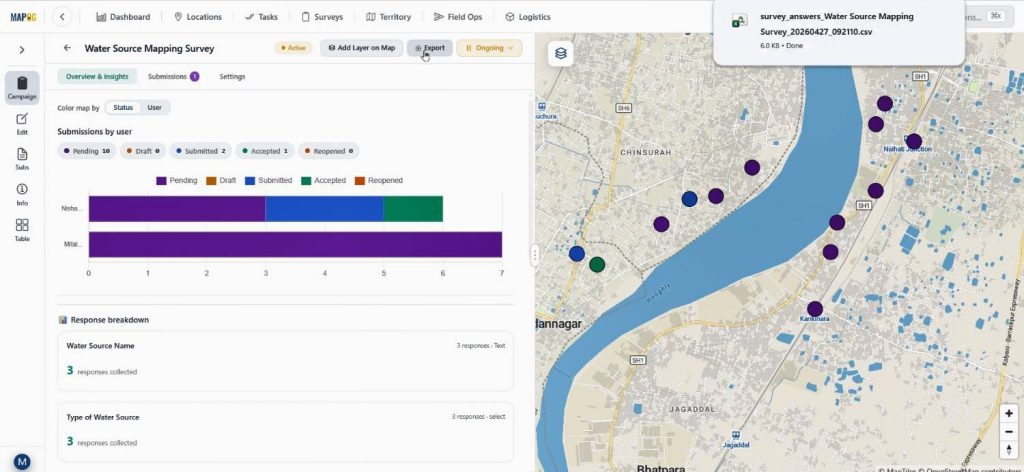
Step 6: Review and Export Collected Field Data
After submission, managers can check all entries from Campaign Overview and Insights. Data can be viewed by user and submission status.
In the Table section, filters help review records by assignee or status.
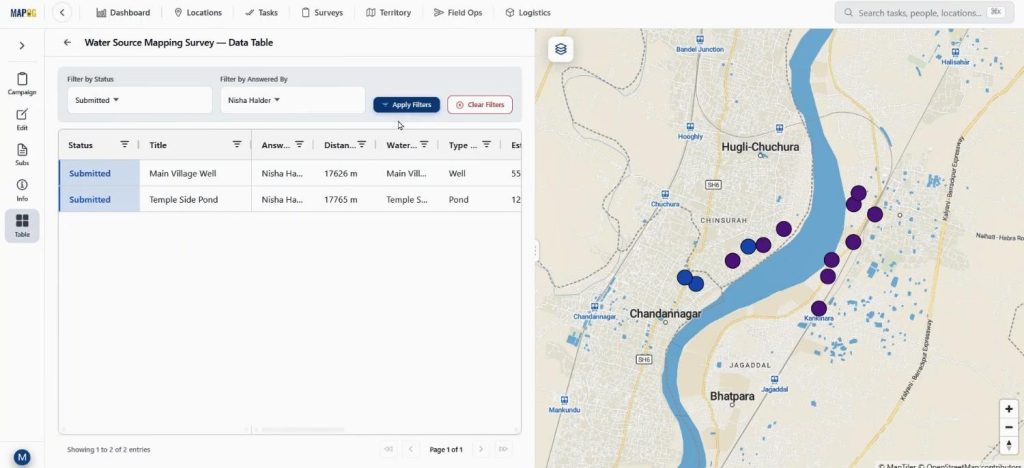
Then, in the Review section, submitted forms can be checked, feedback can be added, and approval status can be updated.
Finally, the dataset can be exported using export option for reporting.
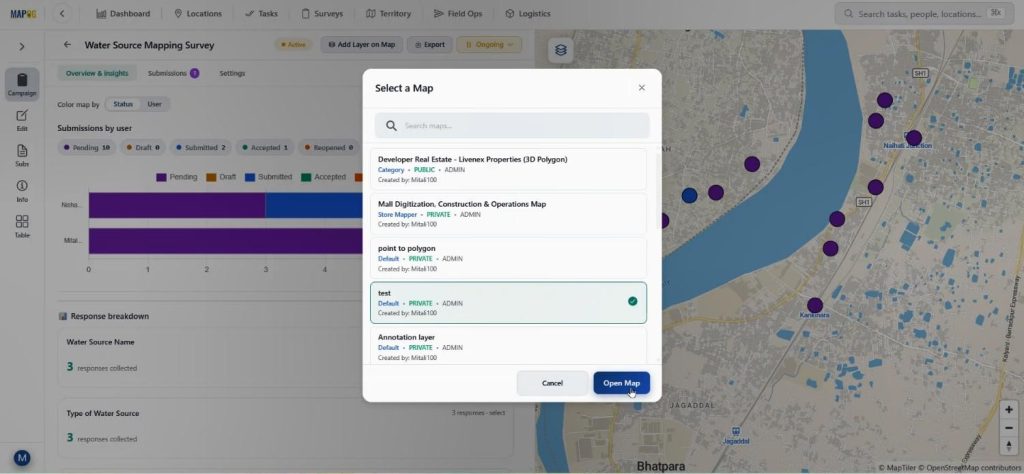
or added as a new layer inside an existing map using add layer on map option for future GIS analysis. Thus, the complete field workflow remains connected from collection to decision-making.
Industry Applications and Benefits of Analyze Bridge & River Crossings
Many sectors benefit from proper collection of location-based field data. Water resource management teams track wells, NGOs conduct health surveys, urban planners inspect assets, and agriculture teams monitor irrigation. Real-time updates reduce delays, avoid duplicates, and strengthen field verification. Live mapped information enhances planning and accountability. MAPOG facilitates this by connecting office planning with field execution through Survey and MAPOG Contributor.
Conclusion
To effectively collect location-based field data, both accuracy and speed are essential. Traditional methods often fall short due to delayed updates and limited visibility. MAPOG addresses these issues by utilizing location templates, survey campaigns, and the MAPOG Contributor app, connecting every step from creating survey forms to reviewing submissions on the map, enabling teams to work more efficiently and make quicker decisions. Users are encouraged to share their experiences with mobile GIS surveys and discuss how advanced mapping can enhance workflow.
Download the contributor app from here: