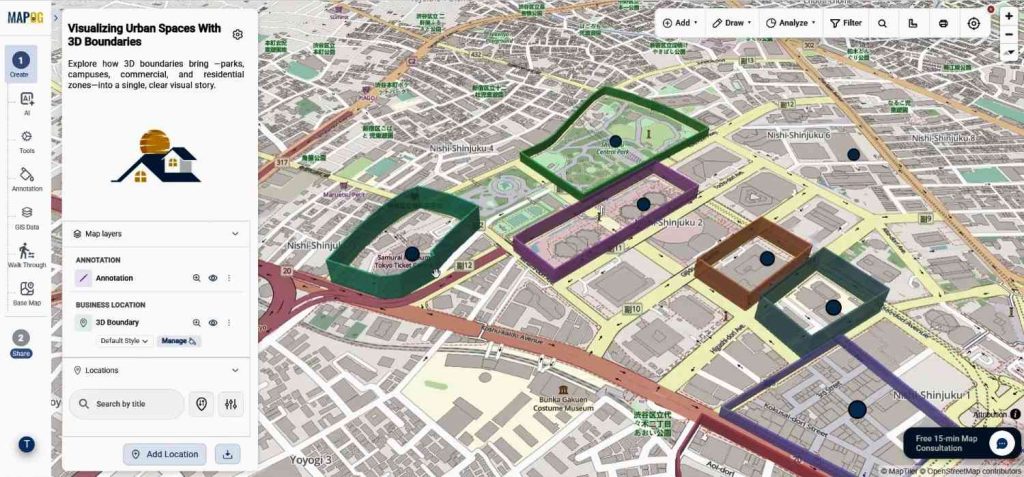
Interactive maps often look flat and difficult to interpret, especially when multiple business zones, campuses, tourist spots, or infrastructure projects are involved. As a result, many teams struggle to explain spatial boundaries clearly. However, when you Create 3D Boundaries on maps, locations become easier to understand, visually engaging, and far more interactive.
MAPOG help solve this issue by combining map storytelling, CSV-based location uploads, annotations, and 3D visualization tools in one workflow. Moreover, businesses, planners, educators, and tourism teams can organize large location datasets while making their maps more professional and easier to share.
Key Concepts Behind Create 3D Boundaries
Creating 3D Boundaries utilizes polygon-based annotations to visually elevate maps, enabling viewers to identify zones and project areas easily. Layered visualization enhances storytelling and spatial analysis, beneficial for various fields like tourism, urban planning, and event organizing. An additional feature, Upload CSV, facilitates the instant plotting of numerous locations, simplifying the management of large datasets.
Step-By-Step Guide To Create 3D Boundaries
Step 1: Create 3D Boundaries with a New Map Setup
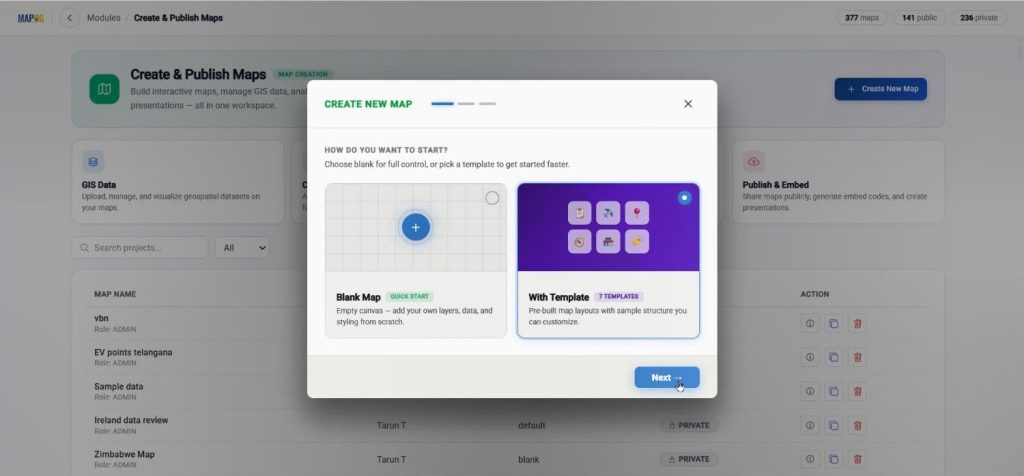
To begin, open MAPOG and go to the Create & Publish section. Then click Create New Map & choose the with template option.
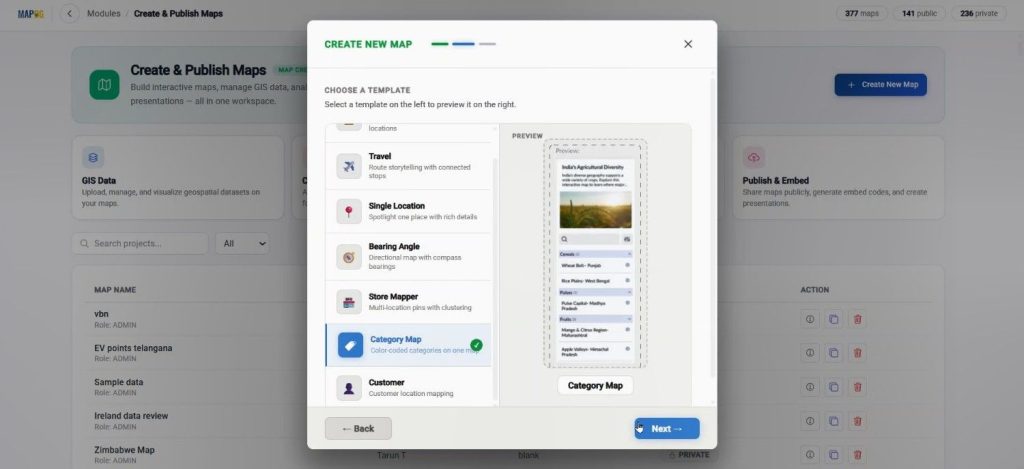
Choose the Category Map template.
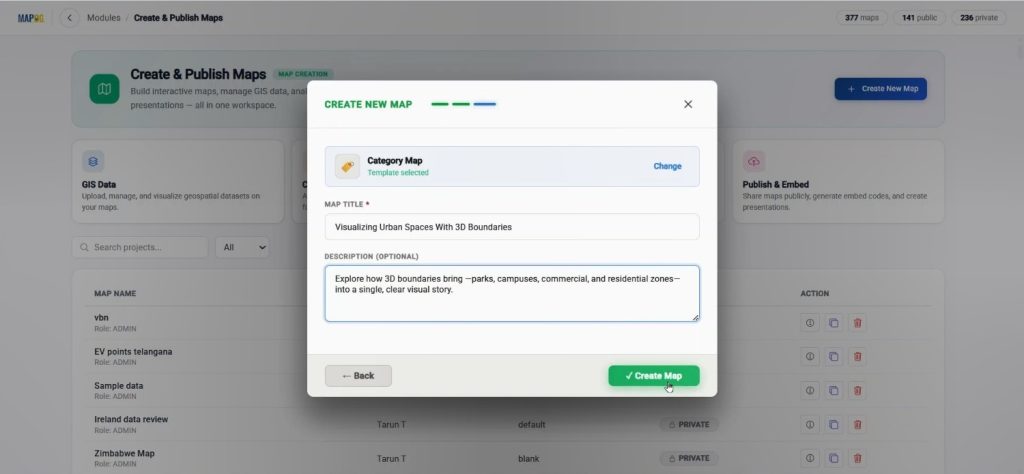
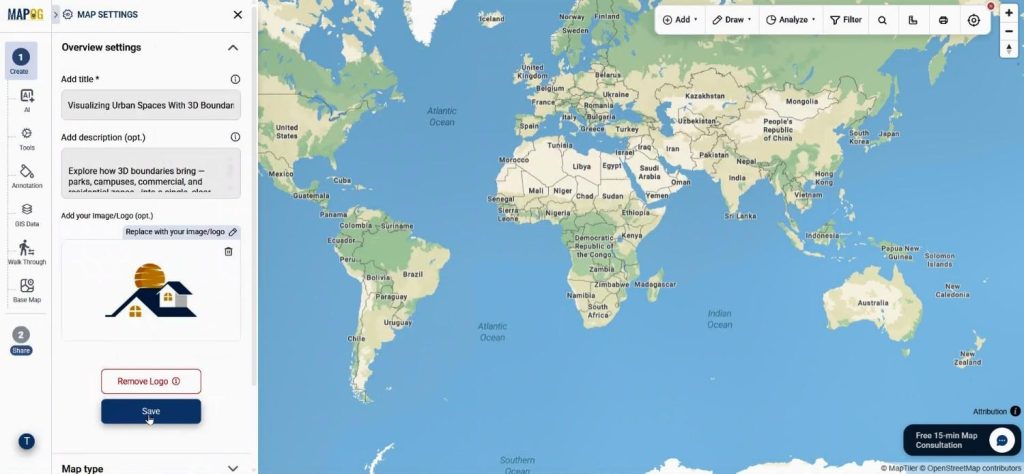
After adding the title and description, create the map and open the workspace.
Next, go to Map Settings & upload your logo for branding.
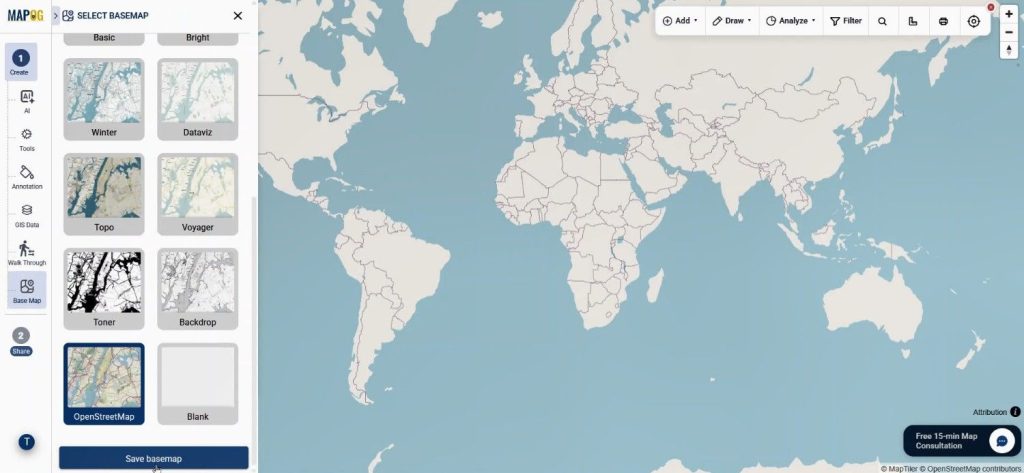
Meanwhile, change the basemap to satellite or road view for a better spatial perspective.
Step 2: Create 3D Boundaries Using Upload CSV
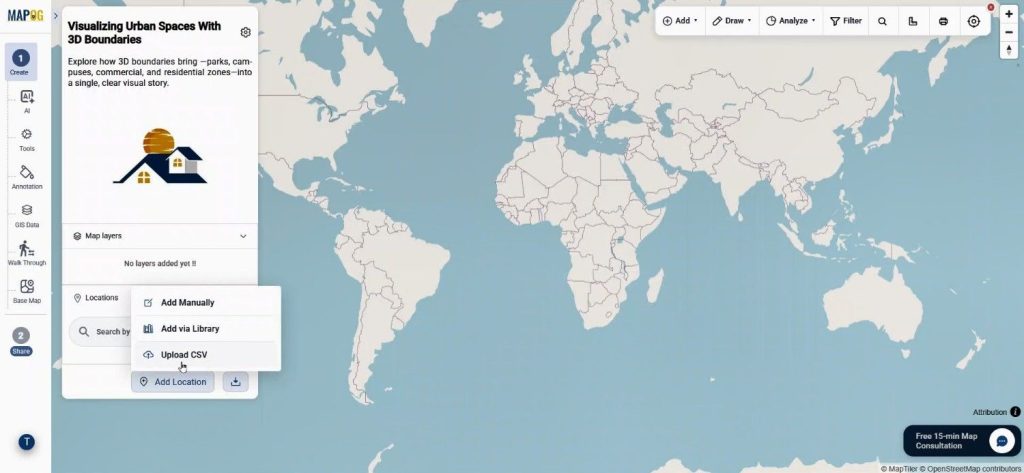
Now move to Add Location and select Upload CSV.
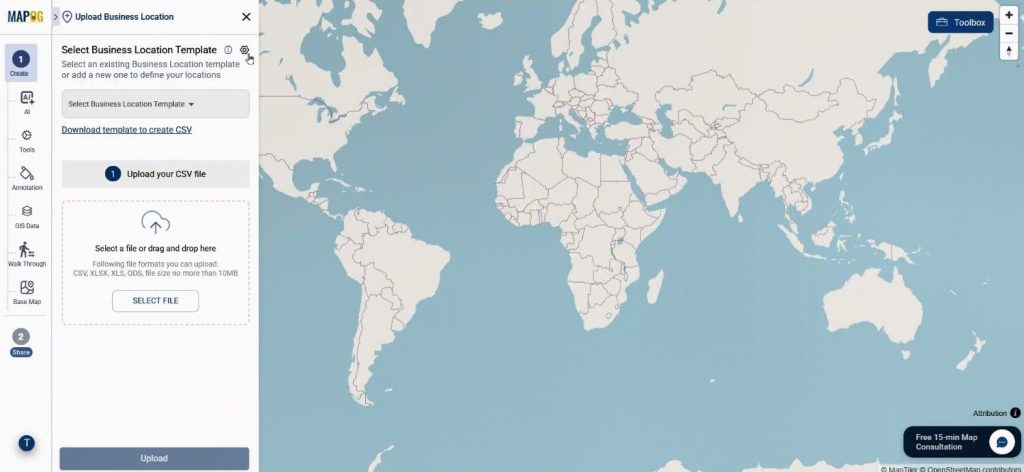
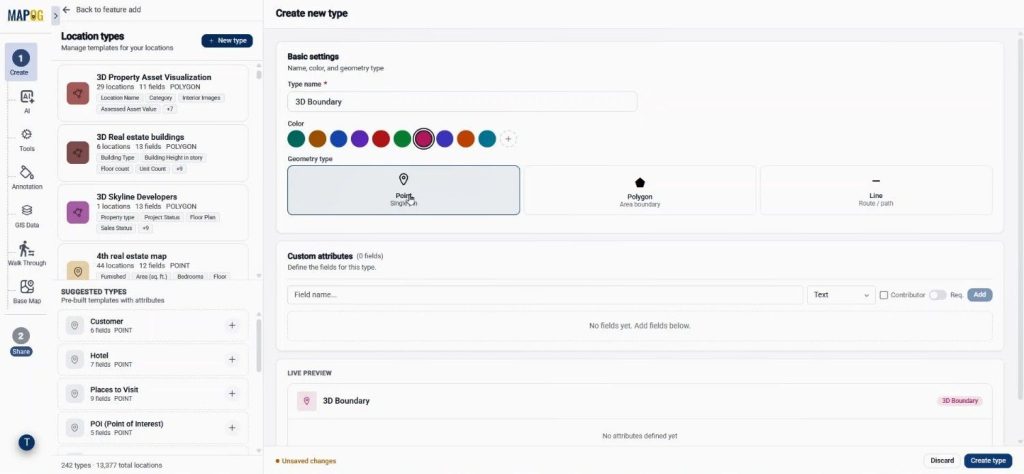
Before uploading data, click on Select Business Location Template to create a reusable template. This feature in MAPOG is extremely useful because the same structure can later be reused across different maps.
Click new type to begin. Inside the template setup, add the title, choose a color, and set geometry as Point.
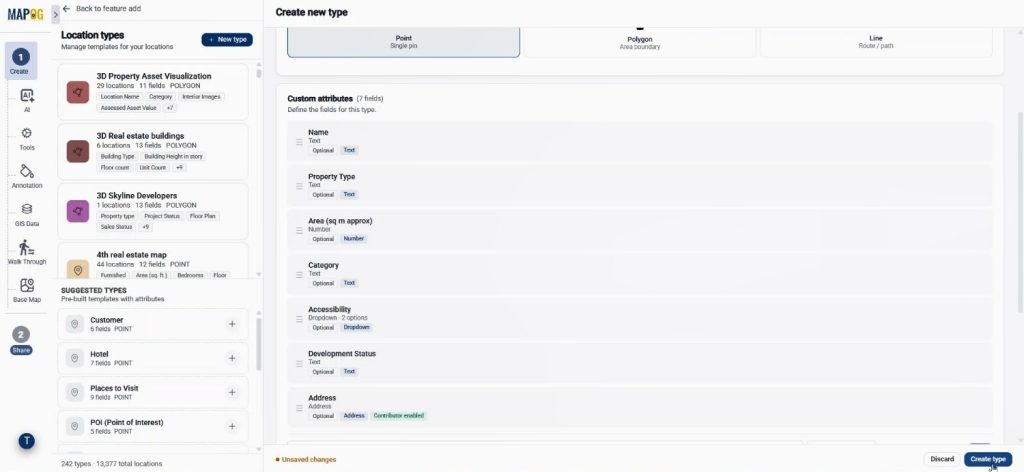
Then create fields like name, type, category, and numbering formats. Enable Contributor access so teams may update location data collaboratively.
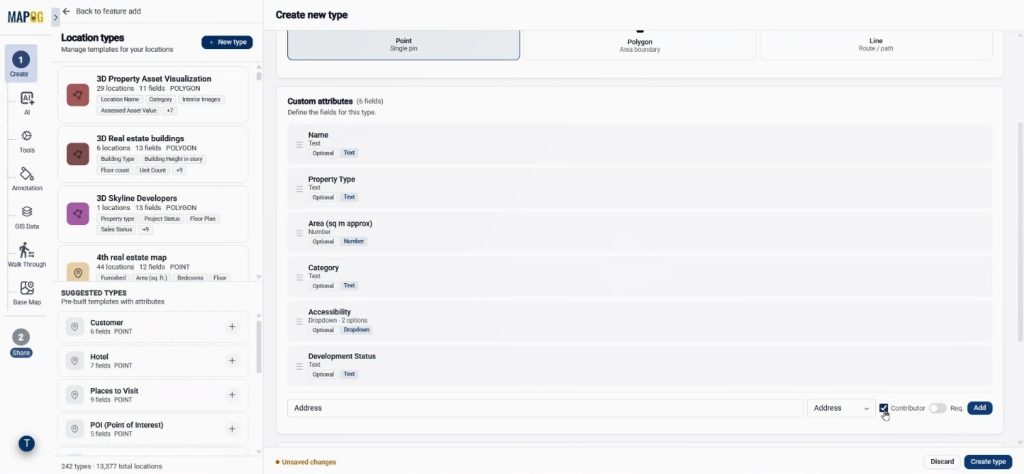
Click create type to save the templaet.
Afterward, return to Upload CSV, select the template, and upload your prepared CSV file.
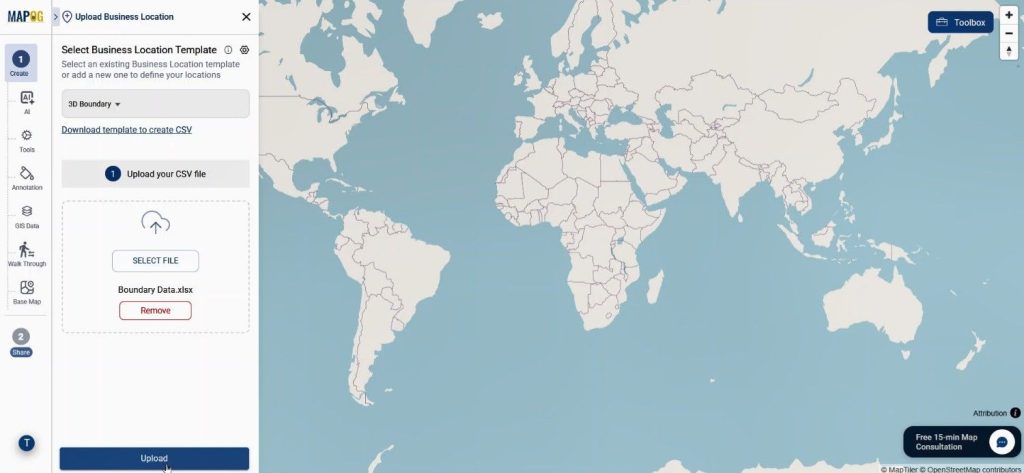
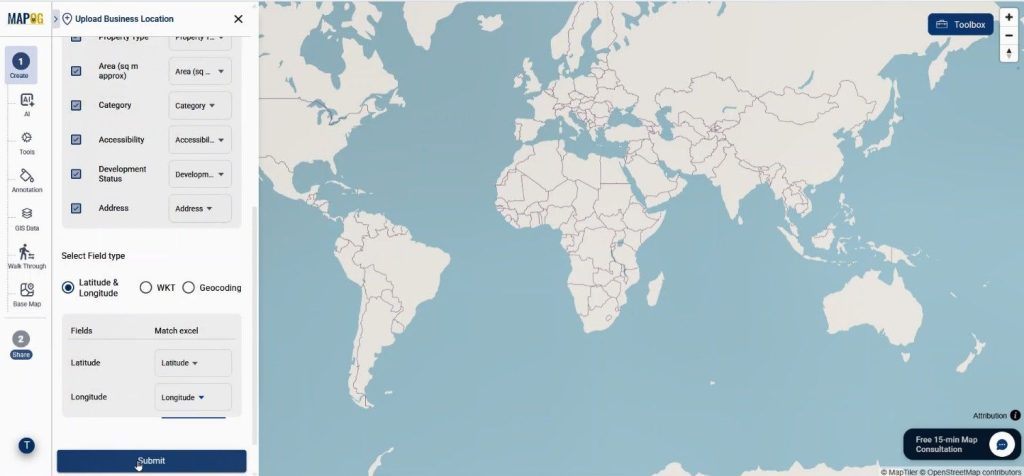
Select a unique ID to prevent duplicate entries.
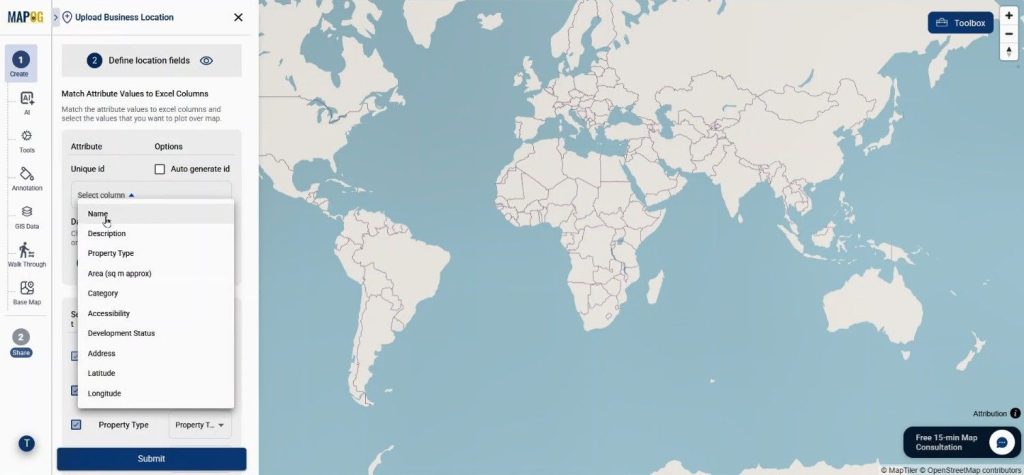
Match the fields properly, define latitude and longitude columns. Once submitted, all locations will automatically appear on the map.
Step 3: Create 3D Boundaries with Annotation Tools
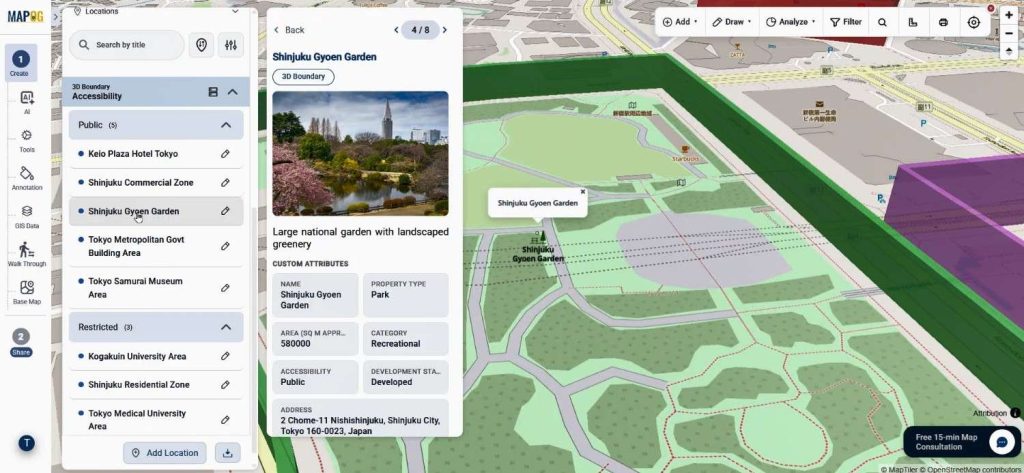
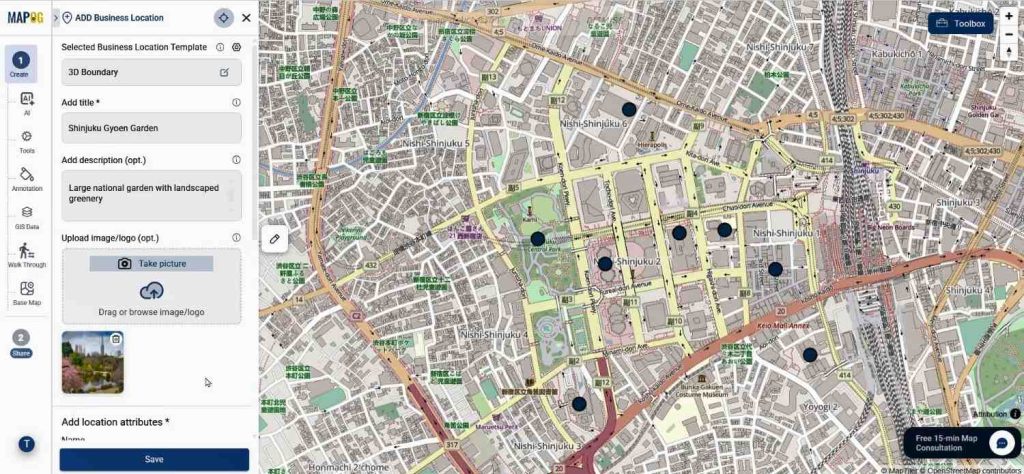
After plotting locations, open any location and go to edit. Select edit business location details & add details by adding descriptions and images. As a result, every point gain proper context and becomes more informative for viewers.
Then go to the Annotation section.
Select freehand option using the 3D Boundary.
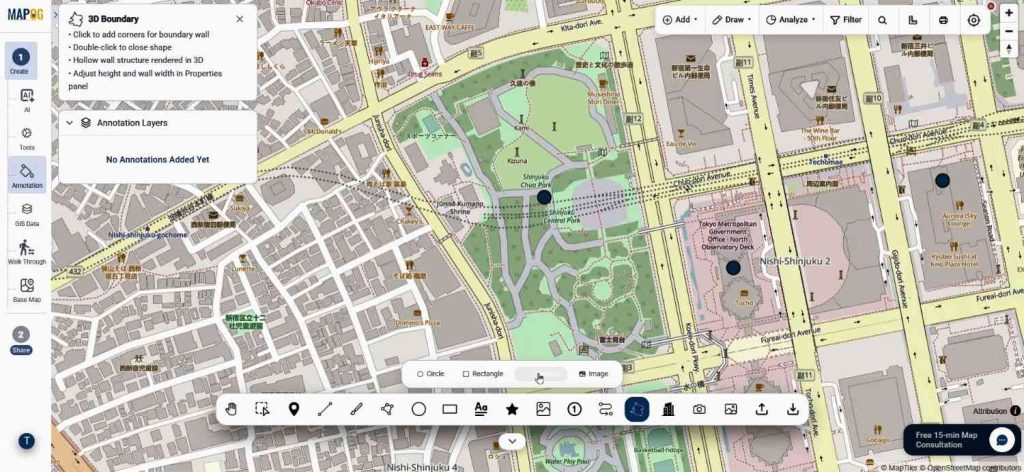
draw polygons around areas you want to highlight.
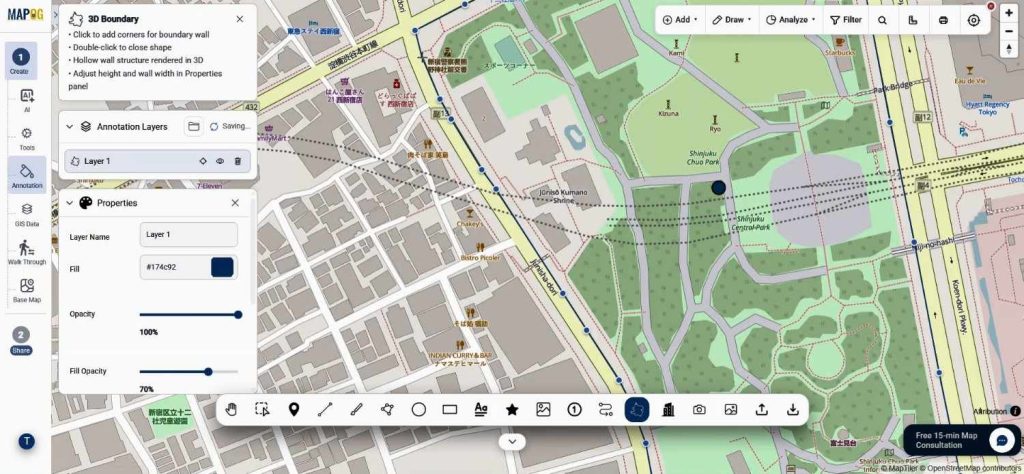
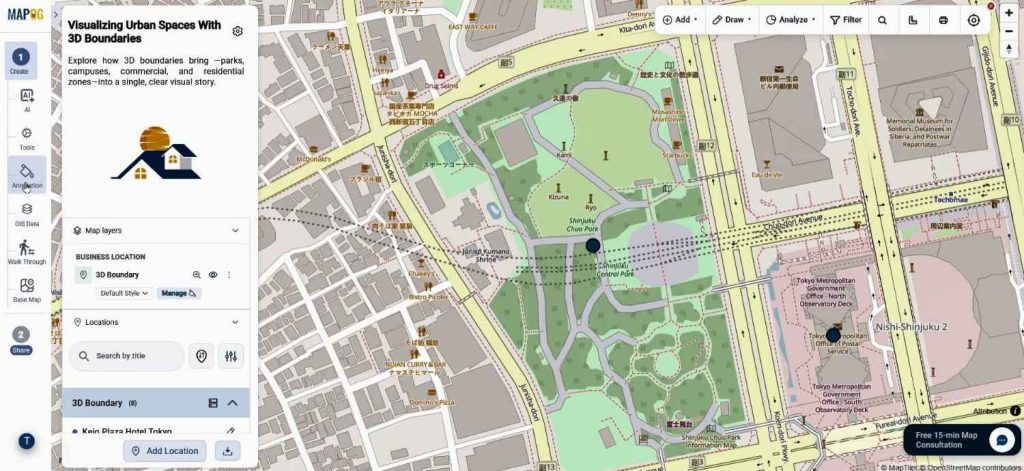
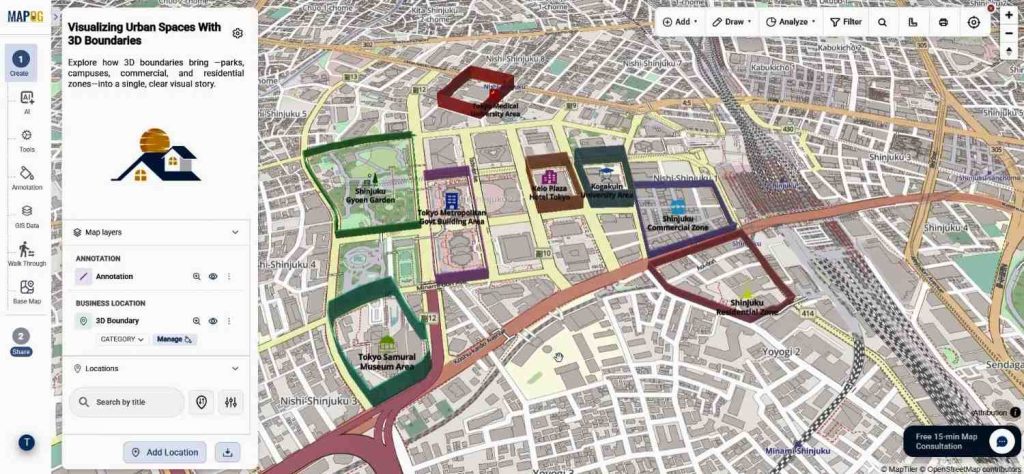
After double-clicking, a 3D structure instantly appears on the map. Moreover, MAPOG allows customization of the height, opacity, color, and boundary name.
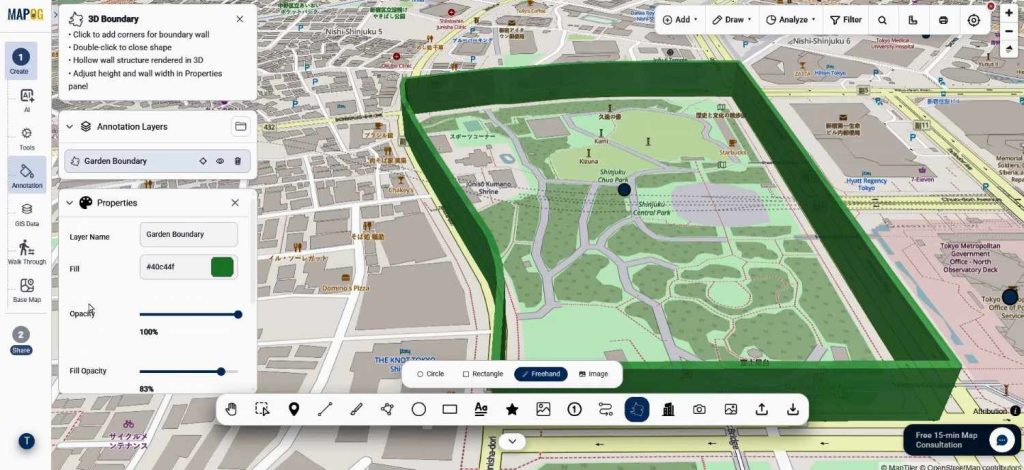
Like this do for all other locations boundary. This feature becomes highly useful for real estate projects, smart city planning, campus mapping, tourism zones, and logistics hubs because boundaries can be differentiated visually.
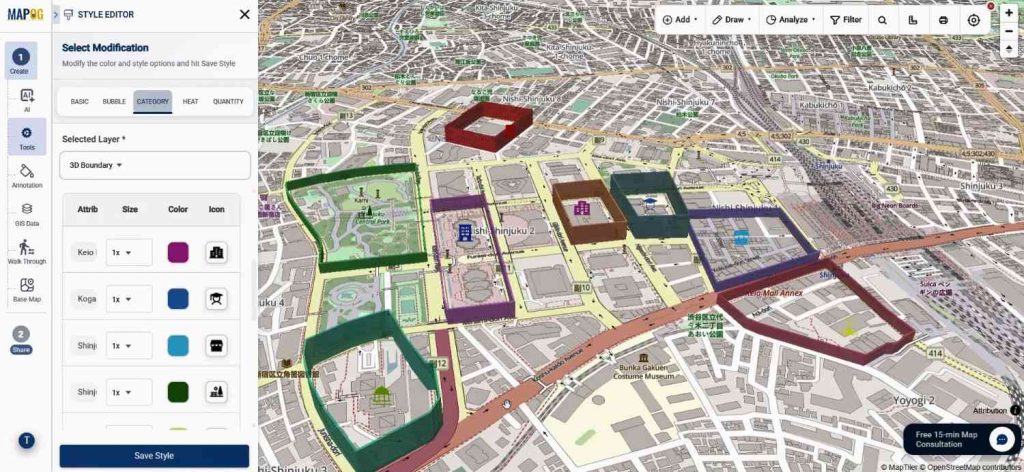
Step 4: Improve Visualization After You Create 3D Boundaries
After creating boundaries, go to Layer Style and select the Category option. Here, assign different icons and colors based on attributes. Consequently, locations become visually organized and easier to interpret.
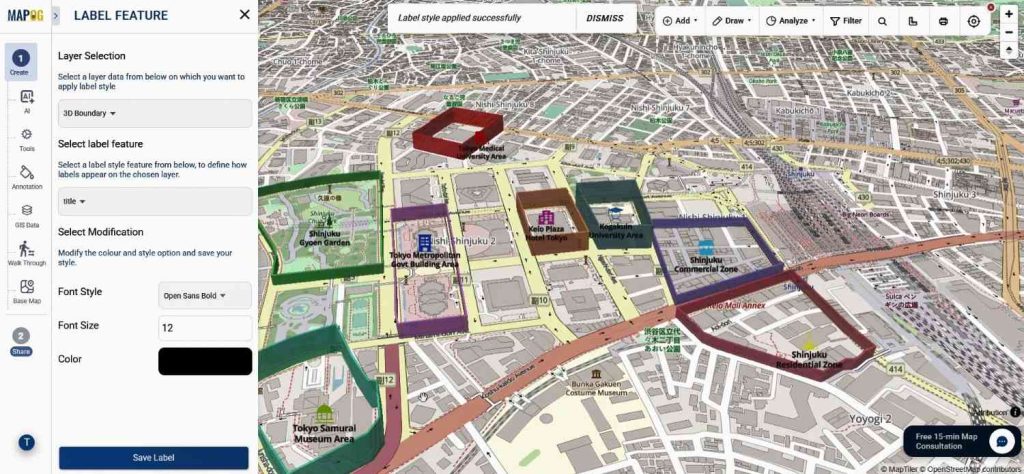
Next, open Label Feature and use an attribute as the title label. Customize Font style, text color, and display settings & save it.
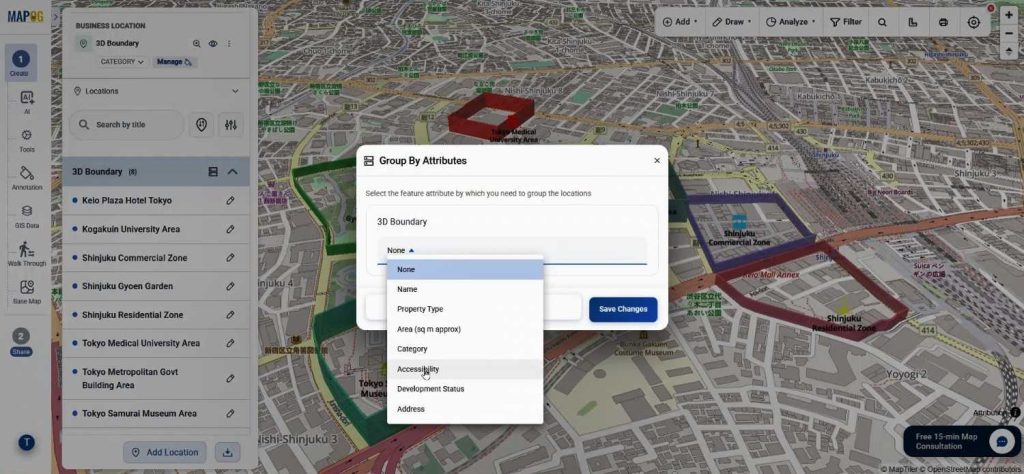
In addition, the Group By feature helps categorize locations into specific business types or operational zones. These improvements make maps more presentation-ready and easier for audiences to understand.
Step 5: Share and collaborate on 3D Boundary Maps
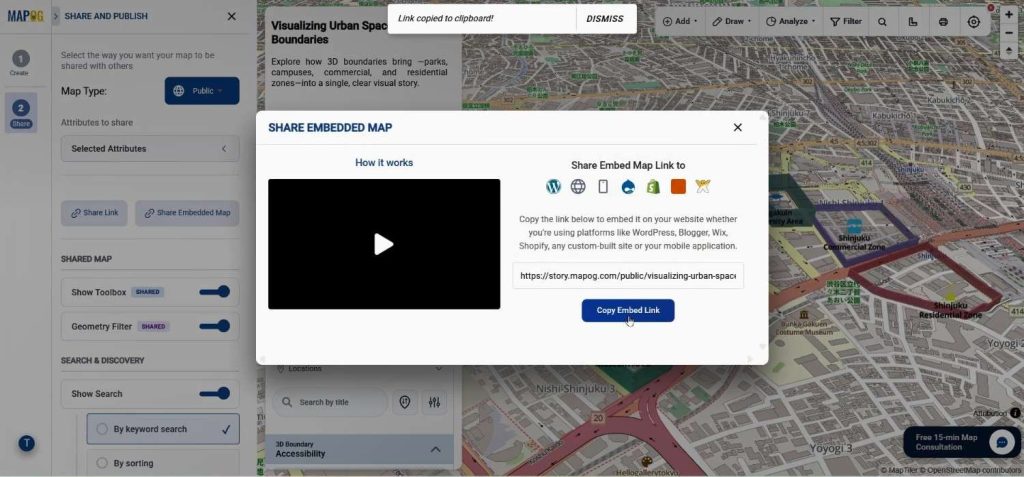
Finally, open the Preview & Share section. Keep the map private for internal collaboration or made public for wider access.
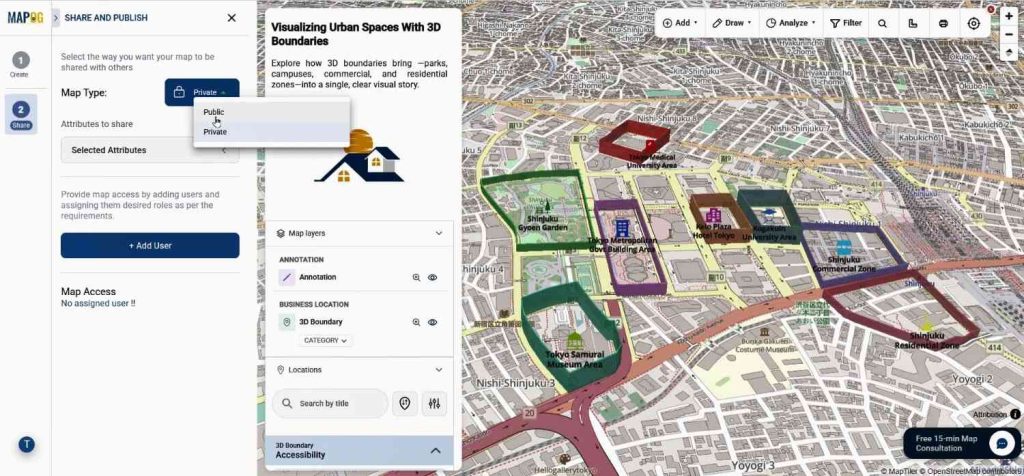
Share links and embed links are also available, allowing maps to be added directly to websites or presentations.
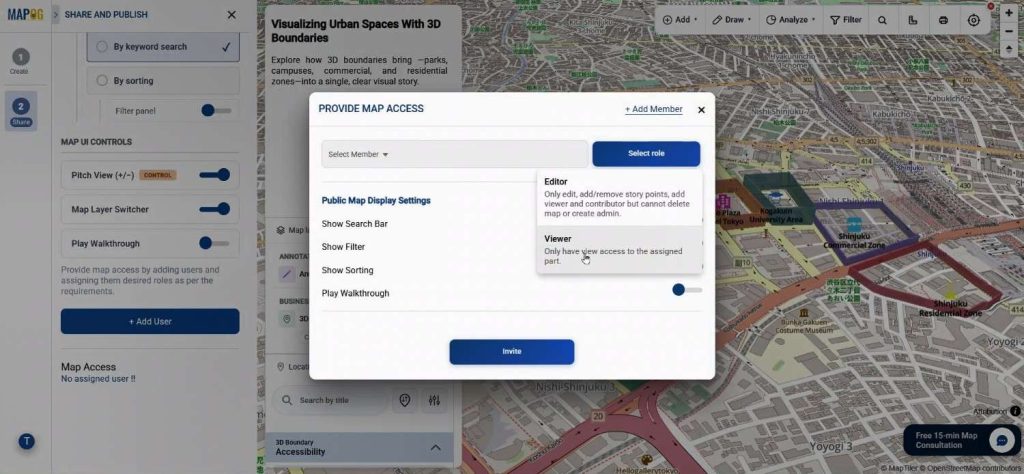
Additionally, add team members with role-based permissions so collaborative editing becomes more secure and organized.
Industries Benefiting from Create 3D Boundaries
Interactive 3D map visualization is increasingly utilized across various sectors. Urban planners use it for zoning and infrastructure, tourism agencies for landmarks, retail businesses for franchise territories, and universities for campus layouts. Logistics companies apply it to delineate warehouse areas and routes. MAPOG facilitates efficient management of large datasets through features like CSV uploads, collaborative editing, and shareable maps.
Conclusion
As spatial datasets expand, interpreting flat maps is increasingly challenging, prompting businesses and planners to favor interactive visual storytelling. The creation of 3D boundaries enhances map engagement and clarity. MAPOG facilitates advanced map visualization through features like Annotation, CSV uploads, reusable templates, and collaborative sharing, making it accessible even to those without GIS expertise. This approach significantly improves the presentation and understanding of spatial information in various applications, such as business mapping and infrastructure projects.