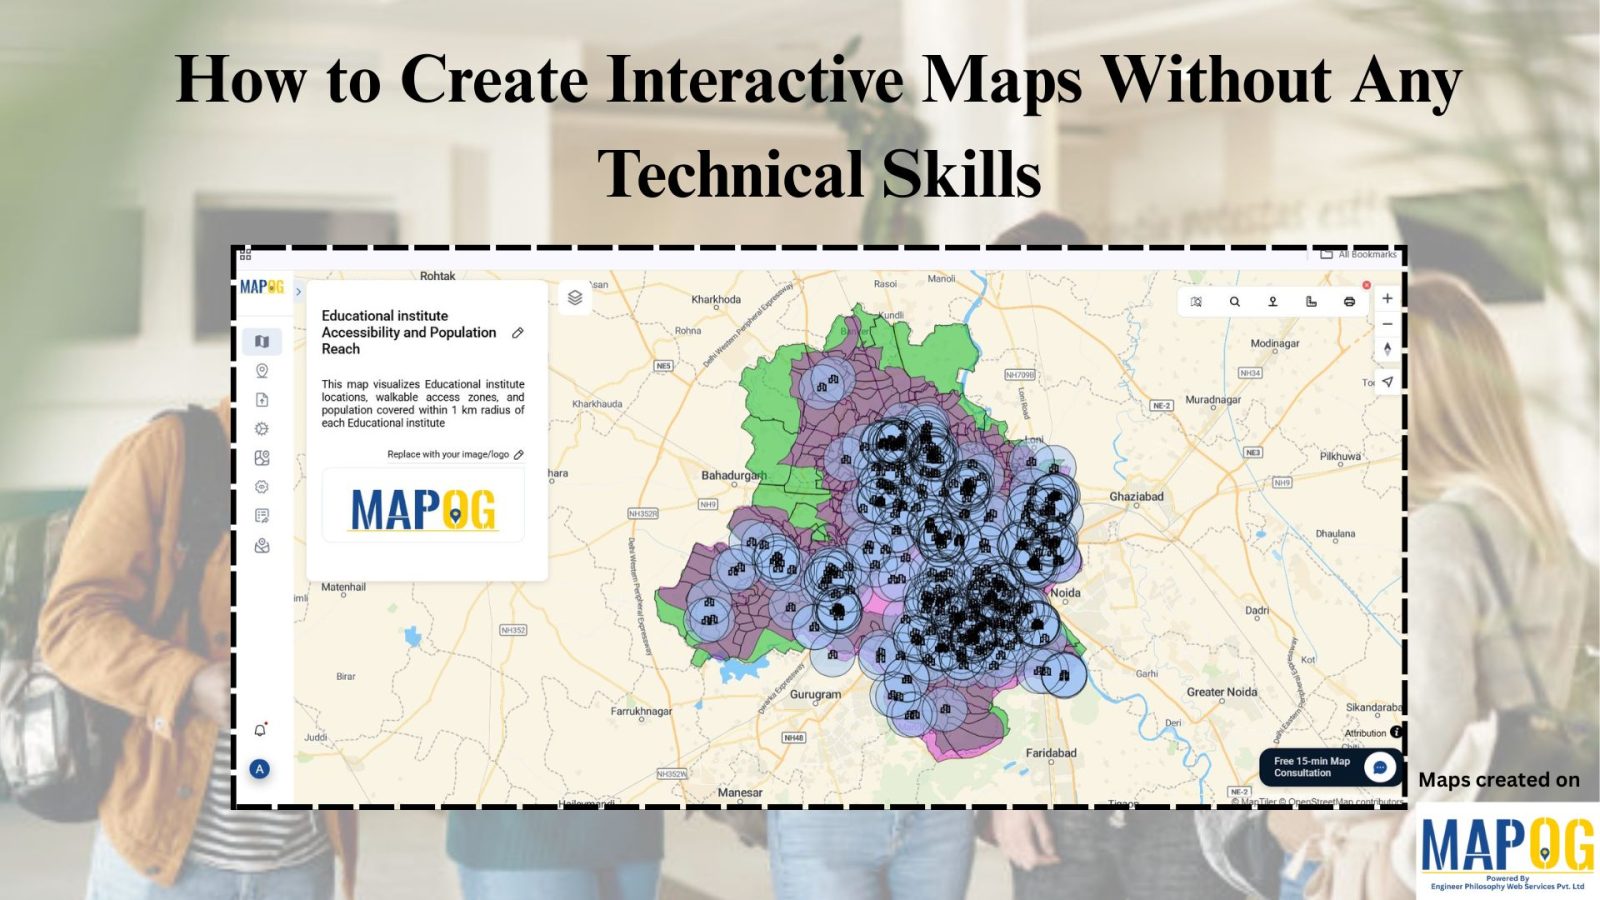
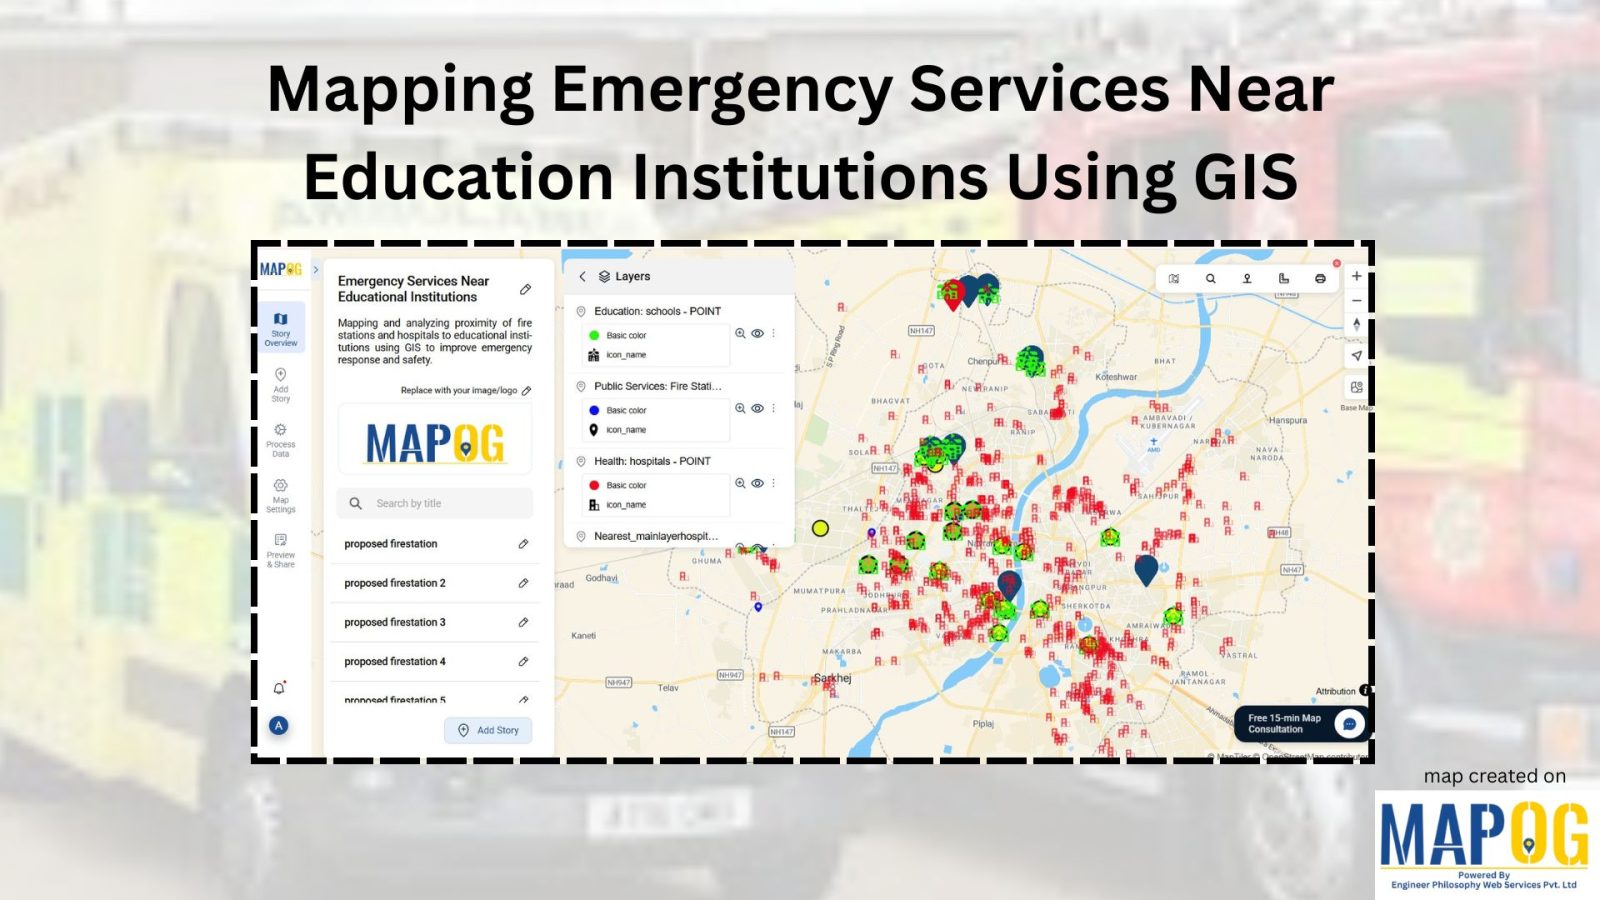
Use Case - Map Analysis

District-Wise Disability Population Analysis Using Heat Maps Easy Insights & Mapping

District-Wise Disability Population Analysis Using Heat Maps | Easy Insights & Mapping

Dive into the world of Disability Population Heat Map Analysis, where advanced mapping techniques provide district-wise insights with ease. By leveraging heat maps, we simplify complex data interpretation, offering a clear visual representation of disability distribution. This approach empowers policymakers, urban planners, and organizations to make informed decisions for improved accessibility and resource allocation. Explore … Read more

Facilitating warehouse location selection

Optimizing Warehouse Location Selection with GIS for Supply Chain Efficiency

GIS optimizes supply chains and logistics by enabling precise route planning, fleet tracking, warehouse Site Selection, Demand Forecasting, and Risk Assessment. It enhances inventory management, facilitating warehouse location selection, reduces transportation costs, improves delivery efficiency, and supports data-driven decision-making, ensuring streamlined operations, better resource utilisation, and improved customer satisfaction across supply networks. Key Concept in … Read more

Role of GIS In Irrigation Planning and Water Resource Management

Role of GIS In Irrigation Planning and Water Resource Management

GIS plays a vital role in irrigation planning and water resource management by optimising site selection, assessing water demand, designing irrigation networks, and analysing crop suitability. Additionally, it enhances decision-making through spatial analysis, monitors water distribution, prevents water logging, and integrates data for sustainable and efficient water resource utilisation. Key Concept in Monitoring GIS in … Read more

How to Style Maps by Categories or Quantities in MAPOG?

Interactive maps are powerful tools for visualizing data in a way that’s easy to understand and engaging. Style Maps by Categories or Quantities in MAPOG allows you to highlight trends, differences, and relationships effectively. Whether you’re mapping demographic data, business insights, or geographical patterns, the ability to customize styles is crucial for making your data … Read more

Forest Boundary Analysis: Precision Polygon Splitting for Sustainable Planning

Unveil the power of precision in GIS with MAPOG’s Split Polygon by Line tool. Explore how this innovative feature revolutionizes polygon splitting, facilitating nuanced analysis and insightful mapping with ease and accuracy. KEY CONCEPTS Our goal is to split the Polygons using the split-by-line tool from MAPOG Map Analysis. Learn more about the analyses using … Read more

Mastering the Merge Polygon Tool: Simplifying Protected Areas Management with GIS

What is Merge Polygon tool? The Merge Polygon tool is a functionality that enables the combination or consolidation of adjacent or overlapping polygons into a single, cohesive polygonal feature. This tool is essential for spatial data processing and analysis, allowing users to simplify complex datasets, resolve geometric inconsistencies, and streamline data representation. This article delves … Read more