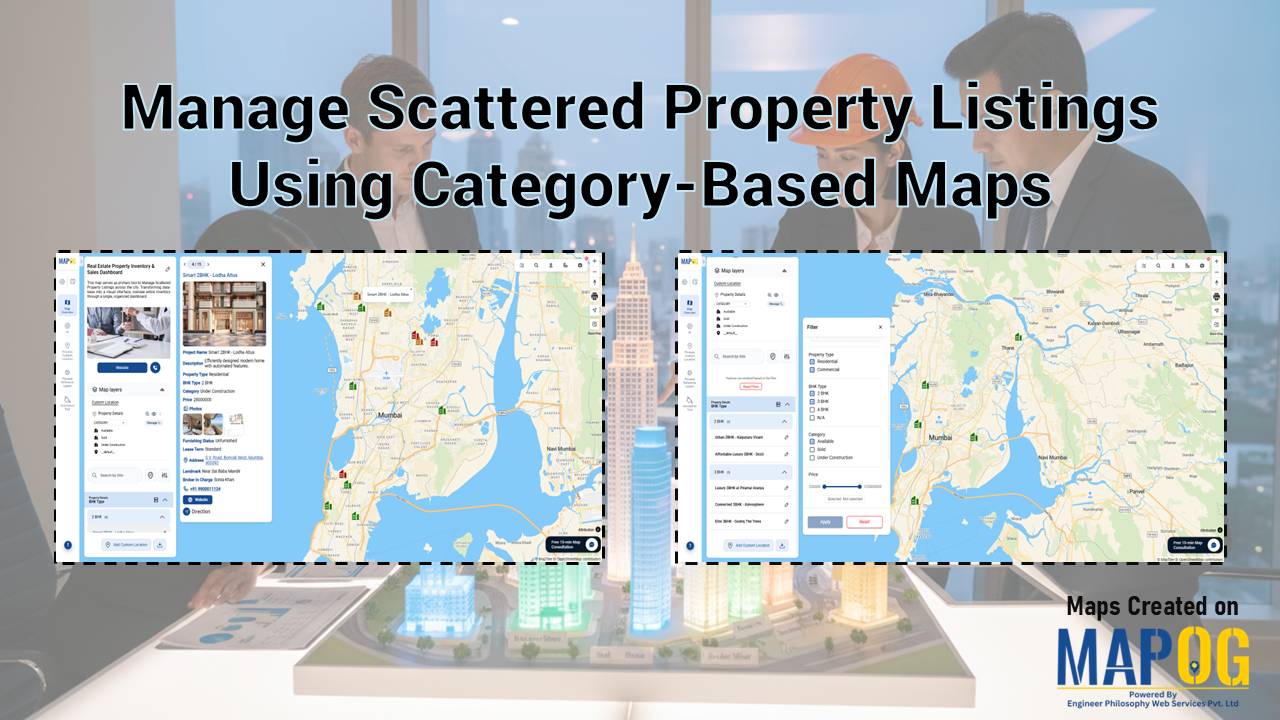
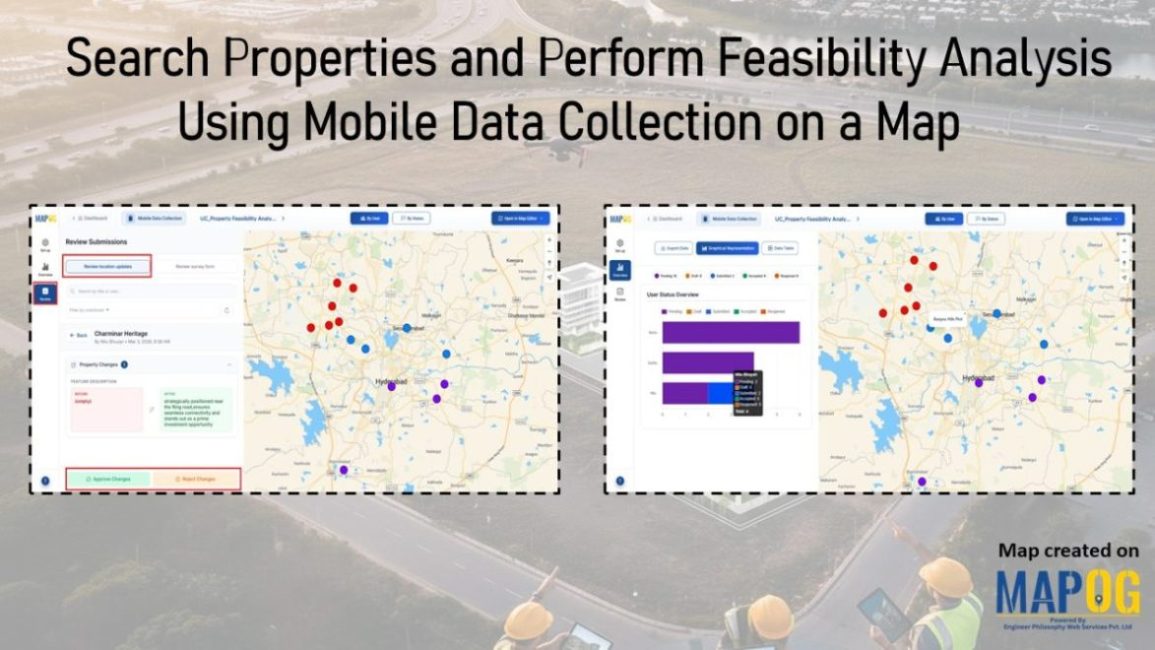
Data Visualisation in Map

How to Map Destination Wedding Venues with Photos & Details

How to Map Destination Wedding Venues with GIS: Interactive Planning, Travel Insights & Venue Storytelling

How to map Destination weddings venues. It combine travel, culture, and celebration into one unforgettable experience, finding facilities like hospitals, and even explore different styles. In addition, this approach promotes better decision-making, while simultaneously inspiring new ideas and allowing for interactive exploration of venues. Moreover, by integrating GIS tools like MAPOG with venue data, wedding … Read more

Mapping Coastline Marathon with GIS

How to Use GIS for Coastline Marathon Route Mapping and Logistics

Mapping Coastline Marathon organizing a marathon along coastline requires accurate GIS mapping . By plotting hydration points, medical tents, and key milestones, planner, smooth logistics, and a great runner experience without complex crowd-flow simulations, using interactive maps with coastline and checkpoint data. Key Concept: Mapping Coastline Marathon Identifies: Uses of Mapping Coastline Marathon Methodology: Mapping … Read more

On-Map Travel Planning How to Build and Share Interactive Itineraries

On-Map Travel Planning: How to Build and Share Interactive Itineraries Transform Client Experiences

On-Map Travel Planning: How Interactive Itineraries Transform Client Experiences In modern travel , clients no longer want static itineraries—they want to see their journey unfold. Traditional PDFs and spreadsheets may list activities, but they fail to convey geography, movement, or the emotional arc of a trip. This is where on-map travel planning changes the game. … Read more

How to Map Crops Online: Step-by-Step Guide for Farmers, Planners, and Researchers

Mapping crops on a map platforms provides an effective way to categorize, analyze, and visualize agricultural data. By organizing crop information into clear layers, farmers, planners, and researchers can better understand agricultural trends and regional strengths. This method not only helps in identifying where each crop thrives but also supports long-term planning, monitoring, and sharing … Read more

electric aerial vehicle routes

How to Plan Efficient Electric Aerial Vehicle Routes Using Bearing Angle and Distance

Planning efficient electric aerial vehicle routes is, therefore, becoming essential in industries like logistics, disaster response, and surveillance. Not only does a precise route save time, but it also ensures flight safety and energy optimization. Consequently, MAPOG simplifies this process by combining bearing angle & distance calculations with real-world coordinates. In this article, we’ll explore … Read more

GIS for Deforestation Tracking

How to Use GIS for Deforestation Tracking and Forest Loss Analysis

Using GIS for deforestation tracking has become a powerful approach in environmental research. Every year, massive tree cover disappears. Therefore, tracking these changes accurately becomes essential for timely forest conservation efforts. GIS helps researchers and conservationists visualize forest loss clearly and over time. Consequently, it enables faster and smarter decision-making. One of the simplest tools … Read more

Add Excel Data to Geographic Boundaries

Visualize Excel Data on a Map: Join Spreadsheet Data with Location Layers

If you’re looking to add Excel data to geographic boundaries using Excel attributes, you’re stepping into one of the most efficient ways to visualize and analyze location-based data. Whether it’s population statistics, sales figures, or demographic details, aligning spreadsheet data with geospatial boundaries helps uncover trends you might otherwise miss. Fortunately, MAPOG simplifies this process … Read more

Create a Buffer Analysis to Locate Hospital Within 5km radius of Village

Finding healthcare gaps isn’t just about counting hospitals. Rather, it’s about understanding access, travel range, and unserved rural zones. Therefore, with the help of MAPOG, planners and health departments can visualize these relationships using buffer analysis. Additionally when used in combination with choropleth-style overlays, village point layers, or service area mapping tools, MAPOG makes it … Read more

How to Map and Manage a Franchise Business with Location and Service Filters

If you’re planning to expand your food chain or track multiple branches across cities, then learning how to map a franchise business with smart filters is a true breakthrough. By doing so, you can visualize store data on an interactive platform, which in turn helps you easily organize locations, services, and customer insights. Whether you’re … Read more

Mapping Hospital Coverage and Categories Using Convex Hull

Mapping Rural Hospital Coverage Using GIS and Convex Hull

Mapping Hospital Coverage and Categories, locations in rural areas ensures that communities have access to essential healthcare during emergencies. Visualising hospital distribution and overall coverage helps identify underserved regions and gaps in healthcare infrastructure. With MAPOG, users can build interactive GIS maps showing hospital points, health facility types, and Convex Hull polygons that represent the … Read more