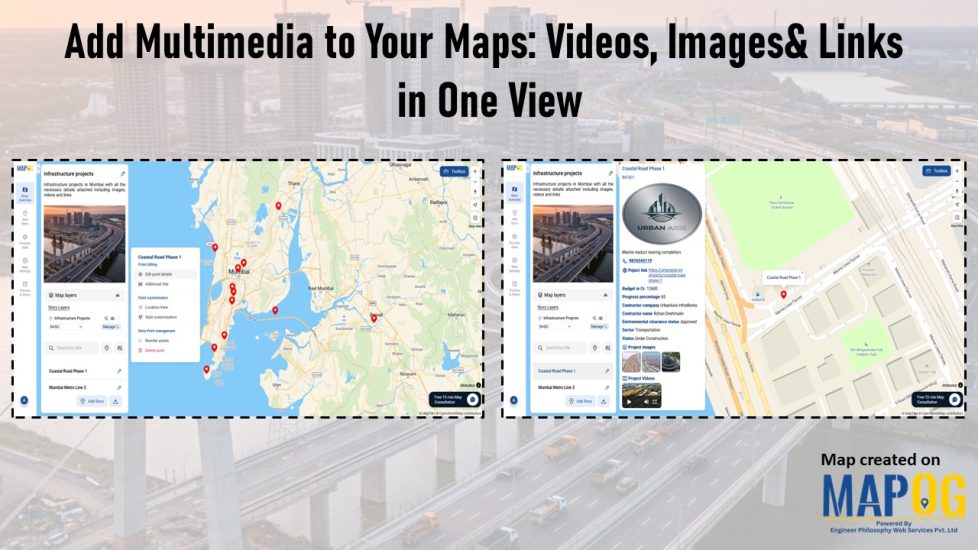
Easy Map Creation

Creating 3D Building Maps

Creating 3D Building Maps for Your Real Estate Project

In the real estate industry, clients often struggle to understand brochures or flat layouts because they don’t provide enough clarity about building height, structure, or availability. 3D Building Maps can enhance communication by providing realistic height visualizations, property details, floor plans, and furnishing status for buildings. MAPOG make this process more intuitive through features such … Read more

How to Use a Mapping Platform to Plan Travel Itineraries

How to Use a Mapping Platform to Plan Travel Itineraries

Planning trips becomes easier and more engaging through interactive travel itinerary mapping. In fact, mapping platforms transform travel ideas into clear, visual routes that anyone can follow. Moreover, these tools integrate destinations, routes, and data layers, allowing travelers to Plan Travel Itineraries efficiently and explore confidently. Key Concept: Plan Travel Itineraries Interactive mapping unites all … Read more

Properties with nearby Amenities

How Real Estate Agents Can Use Map to Show Real Estate Properties with nearby Amenities?

Looking to make your real estate property listings stand out? With MAPOG, real estate agents can map real estate properties with nearby amenities easily to create interactive property maps that enhance clarity, transparency, and decision-making for potential buyers and renters. By integrating accurate location coordinates with valuable contextual data—such as proximity to schools, hospitals, shopping … Read more

Showing map view of customer locations with popups, created after uploading excel data of customer list

How to Upload Your Customer List (CSV or Excel) and Plot It on a Map

When you upload your customer list in Excel or CSV format, you’re storing useful details like names, addresses, and service records, but the data stays flat. That’s because spreadsheets don’t show you where customers are clustered, which areas are under served, or how your field teams move across zones. As a result, it’s hard to … Read more

final visuals of GeoJSON data on an interactive map

How To Visualize GeoJSON Data On Interactive Maps

Trying to visualize GeoJSON data can be challenging when moving from raw spatial data to an interactive map. Although GeoJSON is widely used to store geographic features and attributes, it lacks built-in styling and interactivity. This makes raw files difficult to interpret, especially for non-technical audiences. Moreover, converting GeoJSON into a usable map often requires … Read more

Cover image showing how to create 3D building maps online without coding.

How to Create 3D Building Maps Online Without Coding

To create 3D building maps online without coding once felt out of reach, especially for field teams or planners without access to costly software. Yet in disaster-prone or rapidly changing areas, visualizing buildings in 3D is often essential. It helps people assess risk, communicate clearly, and act faster. That’s where MAPOG comes in: a GIS … Read more

Download Your Mapped Data in Different Formats

Download Your Mapped Data in Different Formats

Interactive maps do more than just visualize locations—they also store valuable data that can be exported, shared, and analyzed across multiple platforms. For instance, whether you’re tracking coffee shops, field points, real estate listings, or even survey data. MAPOG lets you download your mapped data layers in formats like CSV, XLS, JPG, KML, or SHP. … Read more

Why Every Business Needs a Visual Map, Not Just a Dashboard

Why Every Business Needs a Visual Map, Not Just a Dashboard

Dashboards summarize numbers, but visual maps reveal where and why things happen. Business Needs a Visual Map for example, a coffee chain can use MAPOG to see café locations, spot top performers, and analyze competitor proximity in one interactive platform. Moreover, visual maps also help real estate, logistics, healthcare, and many other industries turn complex … Read more

5 Inspiring Examples of Interactive Dynamic Maps You Can Create Online

Interactive and dynamic maps not only transform data into actionable visuals but also let users explore, interpret, and share insights. With MAPOG, you can not only map portfolios, campuses, routes, or stores but also organize, analyze, and visualize trends; moreover, this enables clearer, faster, and connected decisions. Key Concept: Why Create Interactive Dynamic Maps? Interactive … Read more

Manage and Share Location-Based Projects Online with an All-in-One Mapping Tool

In today’s fast-paced project environments, tracking multiple sites, teams, and resources across locations is a major challenge. Therefore, to manage and share location-based projects, and moreover to help construction managers track distributed sites, project mapping now provides an all-in-one solution. With MAPOG, even a simple Excel sheet can quickly transform into an interactive map; as … Read more