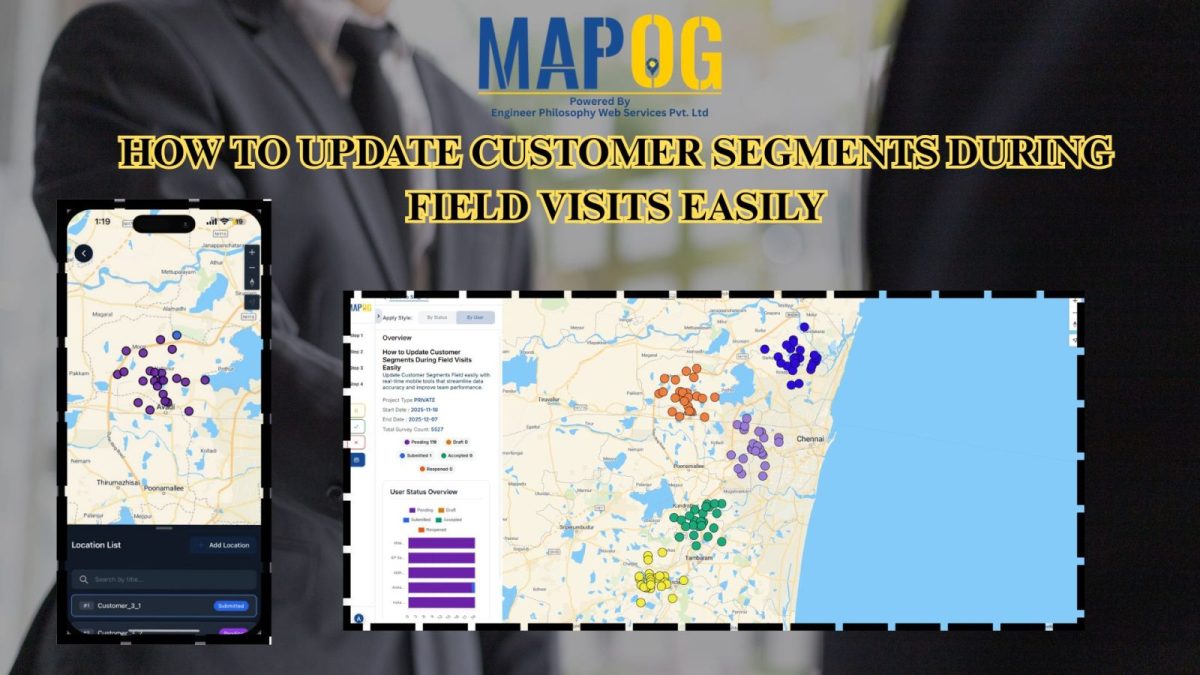
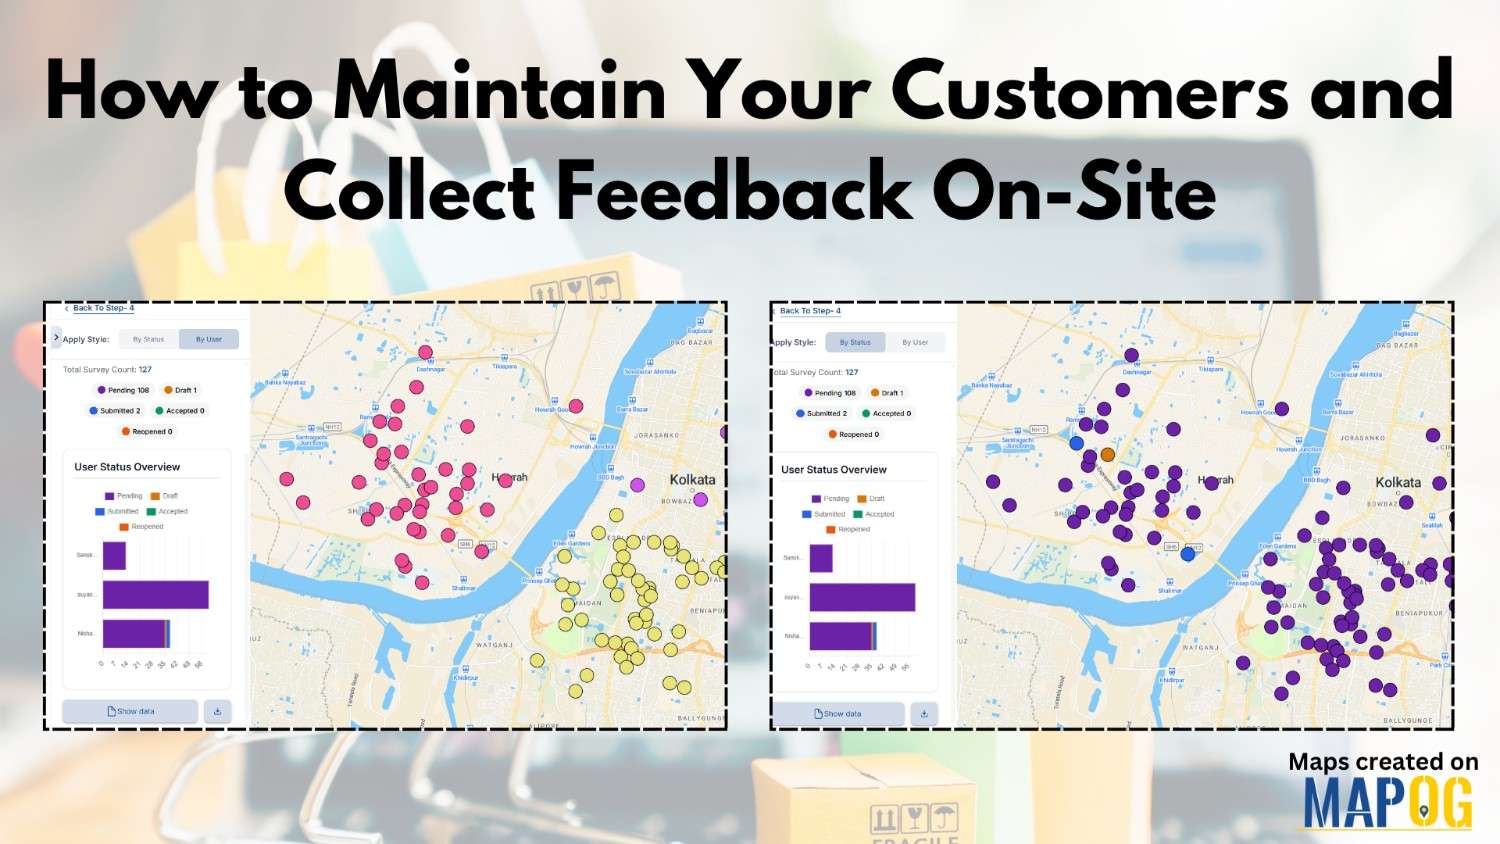
Customer Area

Cover image with article title and MAPOG screenshots showing customer location assignments to field teams.

How to Assign Customer Locations to Field Teams for Surveys

Efficient field surveys start with a clear plan, so you need a simple and accurate way to assign customer locations to field teams. When each member knows where to go, your operations move faster, data quality improves, and field time decreases. This structured approach strengthens tracking, balances workloads, and improves coverage. You can manage all … Read more

Featured image Export or Share Your Customer Maps Securely with Your Team

Export or Share Your Customer Maps Securely with Your Team

Sharing customer maps is essential for effective collaboration and decision-making when your business relies on location-based client data. With MAPOG, you can export or share customer maps showing client locations, sales regions, or service zones. Furthermore, this keeps sensitive data secure through robust permission settings and controlled access management. Key concepts: Export or Share Customer … Read more

visualize customer segments

Visualize Different Customer Segments in Different Colors on a Map

Every retail company wants to know where their customers are and how much they spend. Yet, in a busy city, even with full address data, spotting spending patterns can be difficult. High, medium and low-value customers are often scattered, making it hard to plan effectively. As a result, strategic decisions such as store expansion, marketing … Read more

Identify High-Density Customer Areas

How to Identify High-Density Customer Areas Using Interactive Maps

In every business, understanding where your customers truly come from can completely transform your growth strategy. Moreover, when you Identify High-Density Customer Areas, it becomes easier to plan expansion, target marketing efforts, and optimize logistics efficiently. For instance, imagine having a store in one area where only 20% of your customers are local, yet 80% … Read more

analyze customer distribution

How to Analyze Customer Distribution Using Map Layers

In today’s competitive market, businesses thrive when they analyze customer distribution effectively. Therefore, understanding where your customers come from, how frequently they purchase, and how their spending patterns vary across regions becomes crucial. Moreover, this insight helps you make smarter sales and marketing decisions. Fortunately, interactive mapping with MAPOG simplifies this process even further, allowing … Read more

Switch Between Map Styles

Switch Between Map Styles to View Customer Trends, Hotspots & Spending Patterns

Transform raw data into interactive visuals showing customer locations, spending, and trends. Furthermore, Switch Between Map Styles reveals interactive map insights like top buyers, regional demand, and performance gaps, enabling faster, data-driven decisions without coding. Key Concept: Switch Between Map Styles However, by smoothly Switch map styles, you can easily explore one dataset from multiple … Read more

Add Contact Details and Customer Notes

Add Contact Details and Customer Notes Directly on the Map with Location Points

Whether you are managing a business network, tracking customer locations, or simply organizing site visits, adding contact details and notes directly on the map can make your workflow far more efficient. Traditional GIS platforms can be complex, but MAPOG allows users not only to visualize data but also to attach real-world data to each location … Read more

How to Map Your Customers Using Interactive Layers

Map Your Customers with Interactive Layers: Visualize Buying Patterns, Performance & Growth in Minutes

Map your customers with interactive layers turns plain data into clear business insights. In fact, this approach visualizes buying patterns, engagement, and regional performance. Moreover, it helps identify loyal customers, new prospects, and high-value areas instantly. Key Concept: Map Your Customers Interactive customer mapping merges sales, location, and engagement data into one dynamic platform using … Read more

Showing map view of customer locations with popups, created after uploading excel data of customer list

How to Upload Your Customer List (CSV or Excel) and Plot It on a Map

When you upload your customer list in Excel or CSV format, you’re storing useful details like names, addresses, and service records, but the data stays flat. That’s because spreadsheets don’t show you where customers are clustered, which areas are under served, or how your field teams move across zones. As a result, it’s hard to … Read more