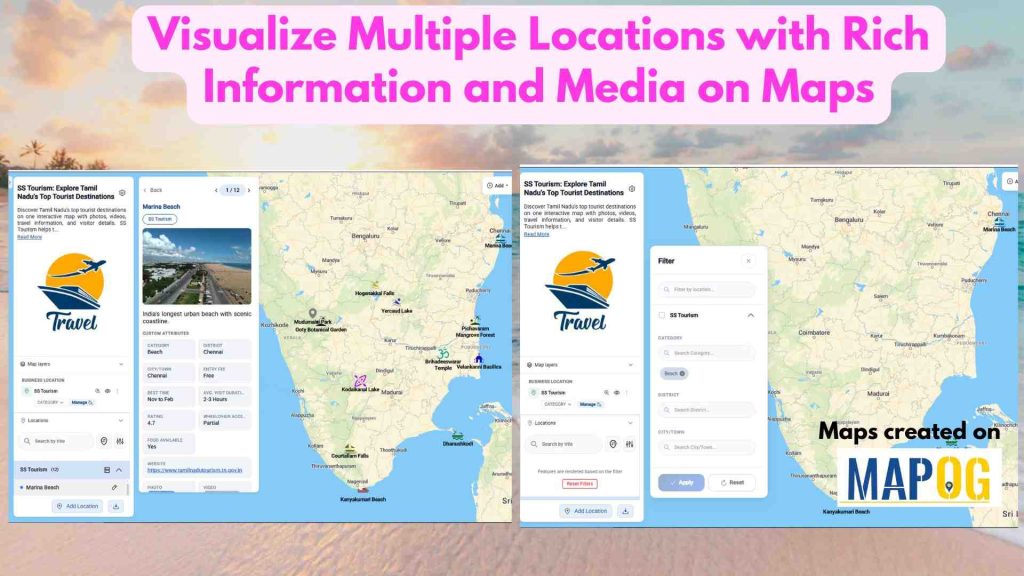
Tourism organizations often manage hundreds of destinations, including historical sites, museums, beaches, parks, hotels, restaurants, and cultural attractions. Presenting all this information through brochures or static documents can make it difficult for travelers to explore and plan their trips. With MAPOG, tourism organizations can visualize multiple locations on a single Interactive map, making it easier for visitors to discover destinations along with rich information and multimedia content.
Key Concept
MAPOG enables tourism organizations to display multiple tourist attractions on one interactive map, with each location containing detailed information such as descriptions, images, videos, opening hours, ticket prices, contact details, websites, and directions. Visitors can click on map markers to view this information, filter locations based on categories or interests, and explore destinations in an engaging and organized way.
Steps to Visualize Multiple Locations with Rich Information and Media on Maps
Step 1 :Create and Upload Locations
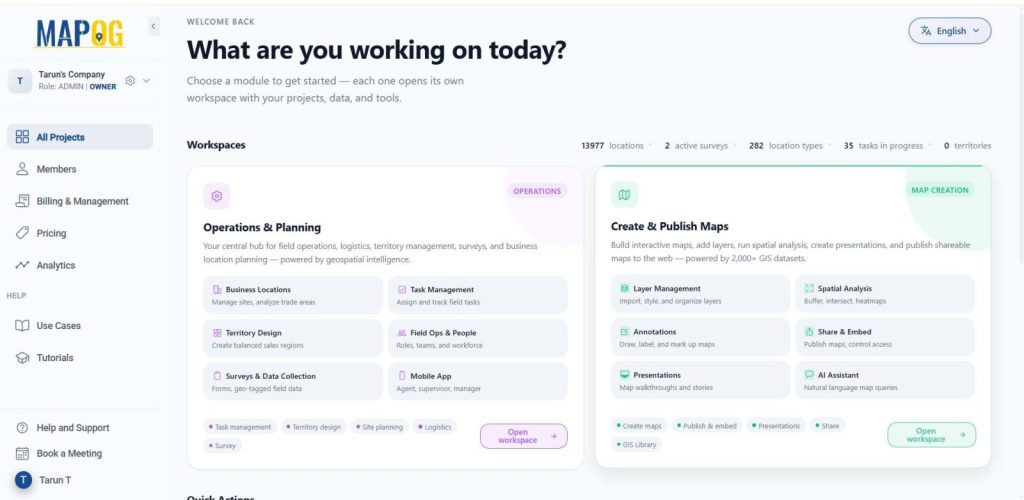
Open MAPOG, and click on Open Workspace in the Operations & Planning section
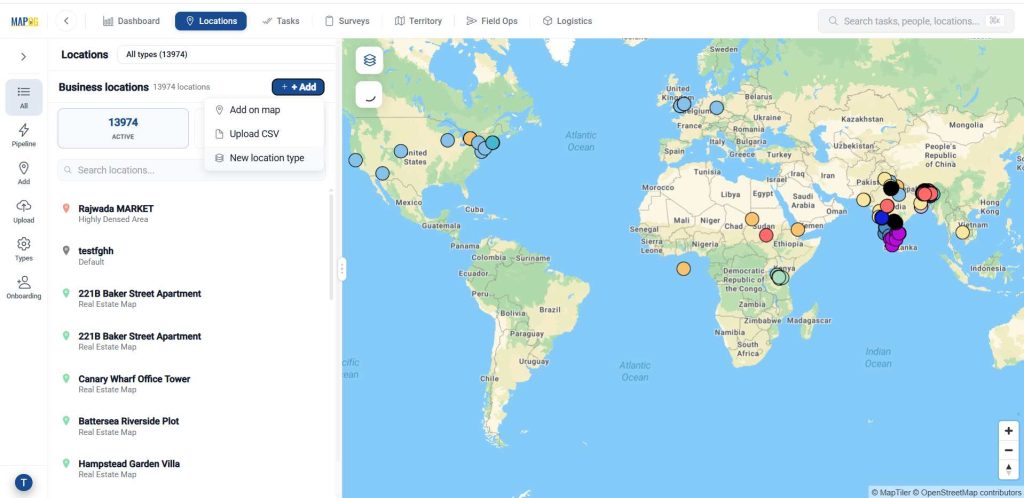
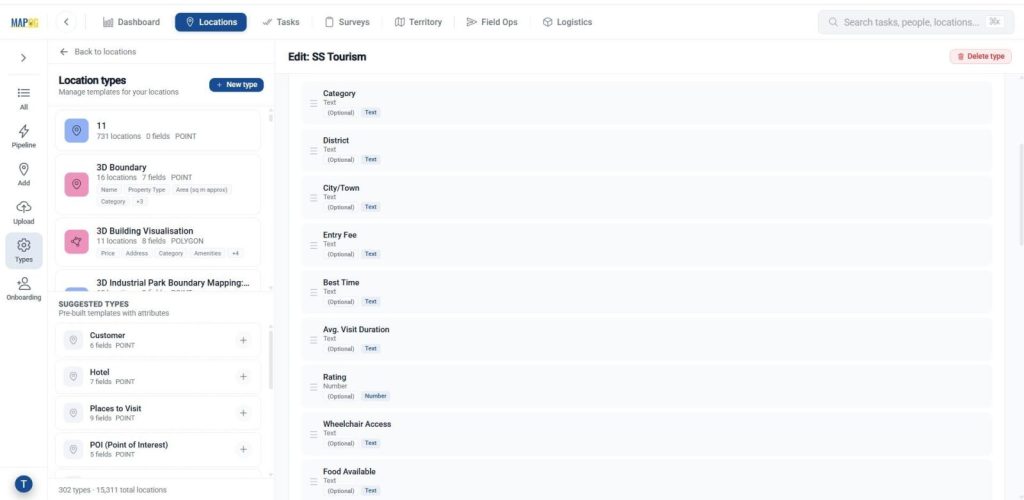
Go to Locations, and click on Add, then select New Location Type to create a new Business Location Template. This ensures consistency and reusability.
Give a name, assign a suitable color and select geometry type as point.
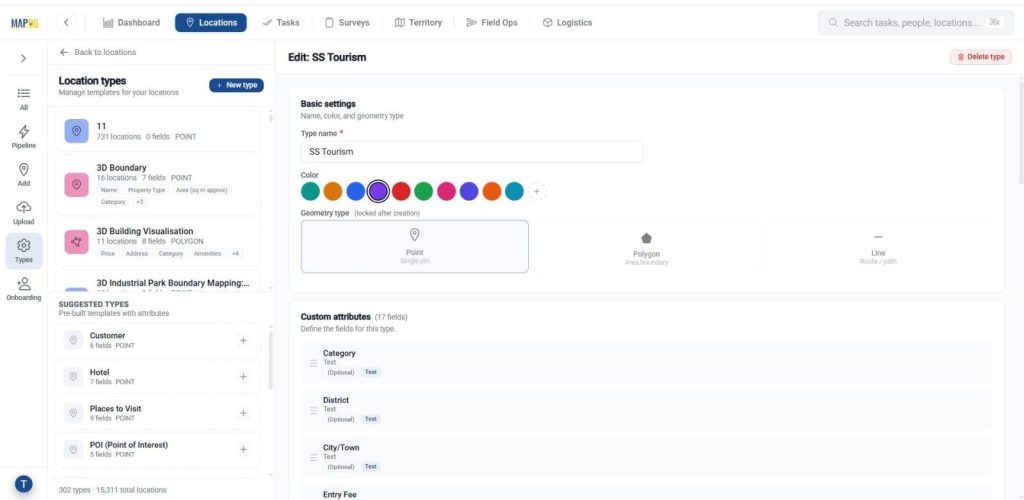
Add attributes that define your point with rich information such as address, number, email and website using text, number, dropdown, or multi-select fields based on the information you want to capture. Once configured, then click create type to save the template.
Step 2 : Create a New Map
Come to the dashboard then, Click on Open Workspace in the Create & Publish section — where you can build interactive maps, add layers, run spatial analysis, and publish shareable maps using rich GIS datasets.
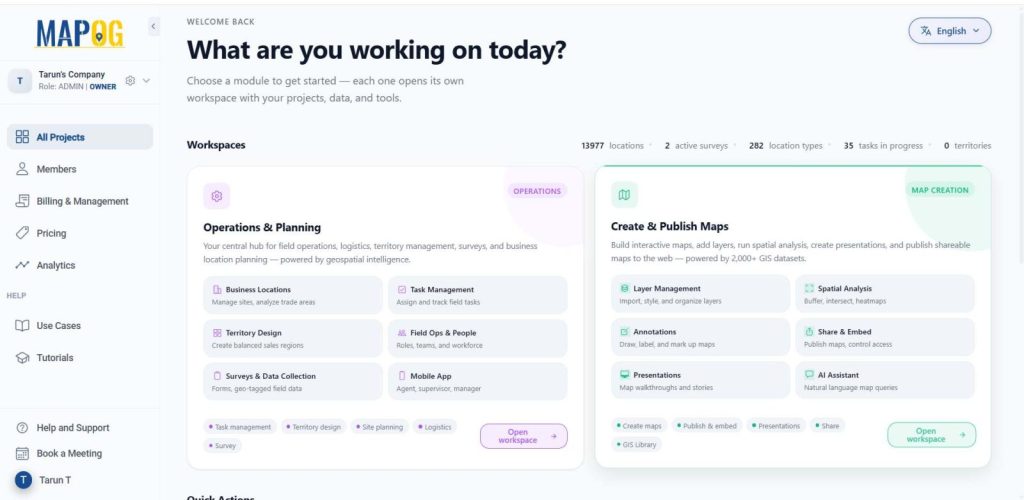
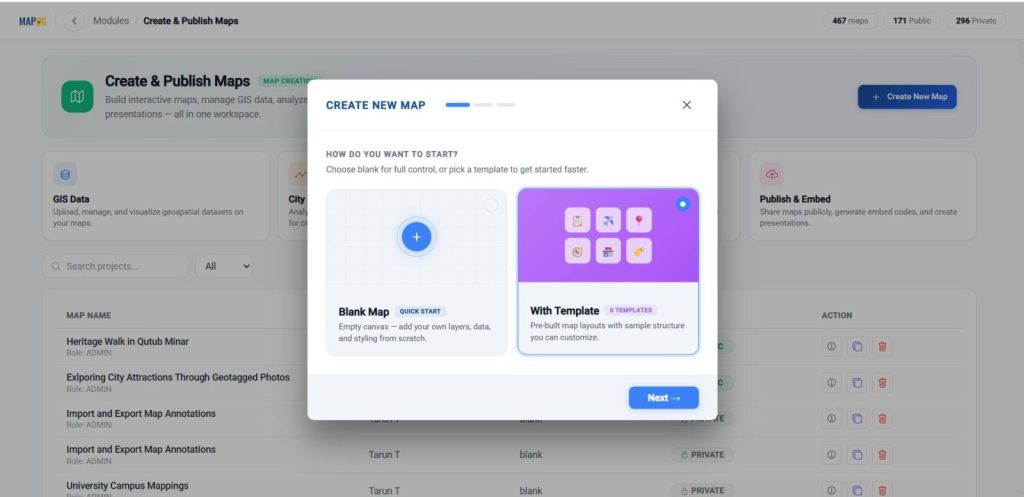
Click on Create New Map – choose Blank Map to start from scratch with your own data and styling, or With Template to use a pre-built layout you can quickly customize. Now click on the “with template” option.
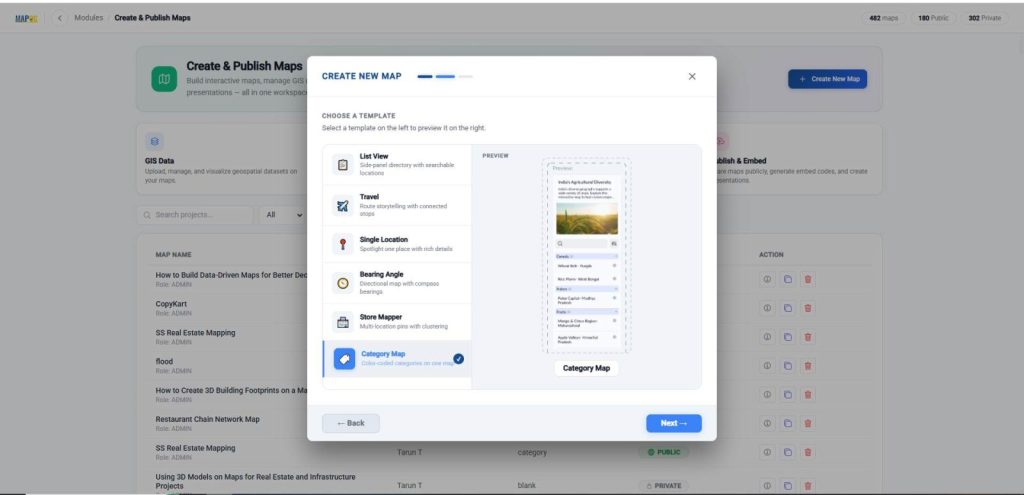
Then select with template options like category map view, and click next.
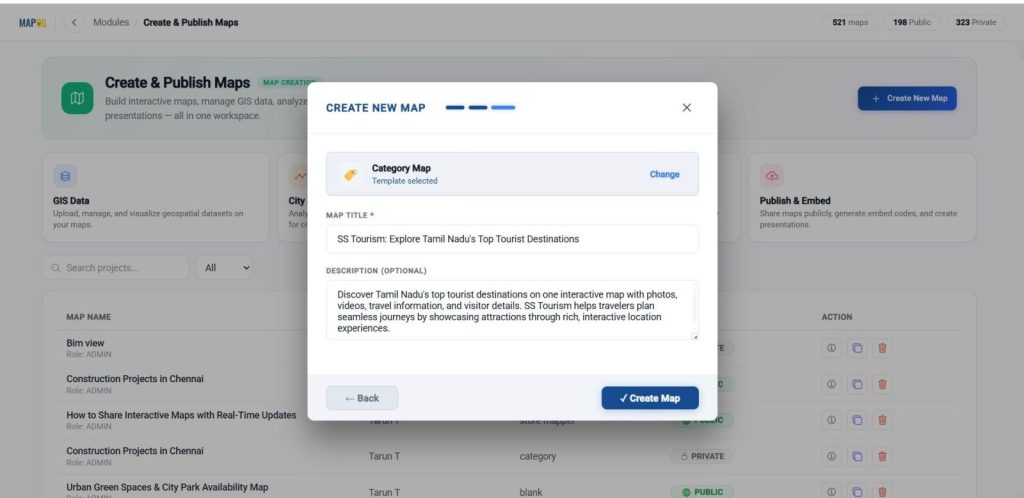
Then provide a title, description, then click create to initialize your project.
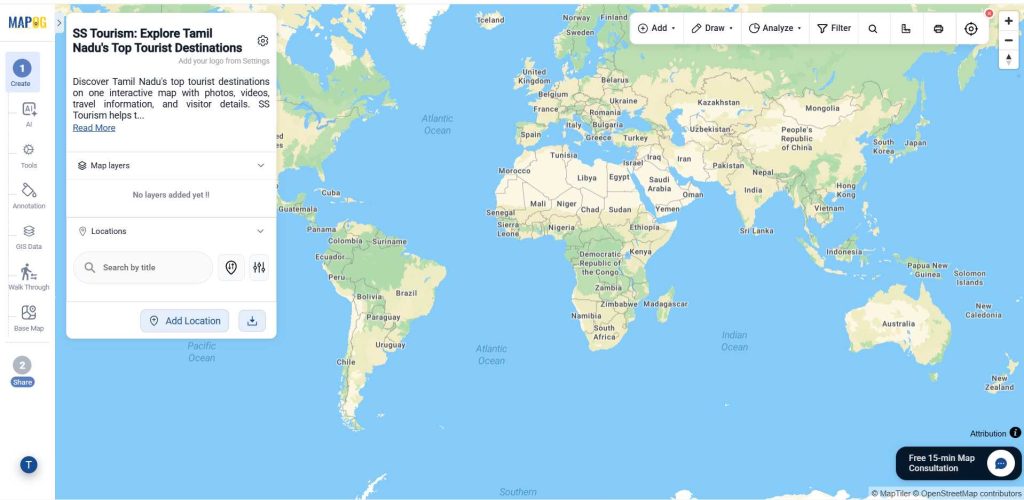
Finally, after coming to the interface, open the map settings.
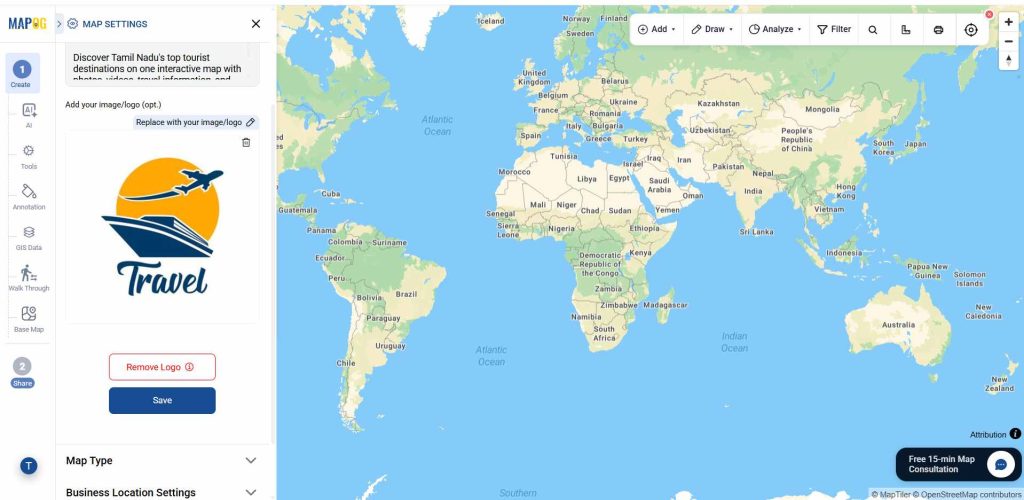
Browse & upload your logo, and save your changes.
Step 3 : Add Locations to Your Map
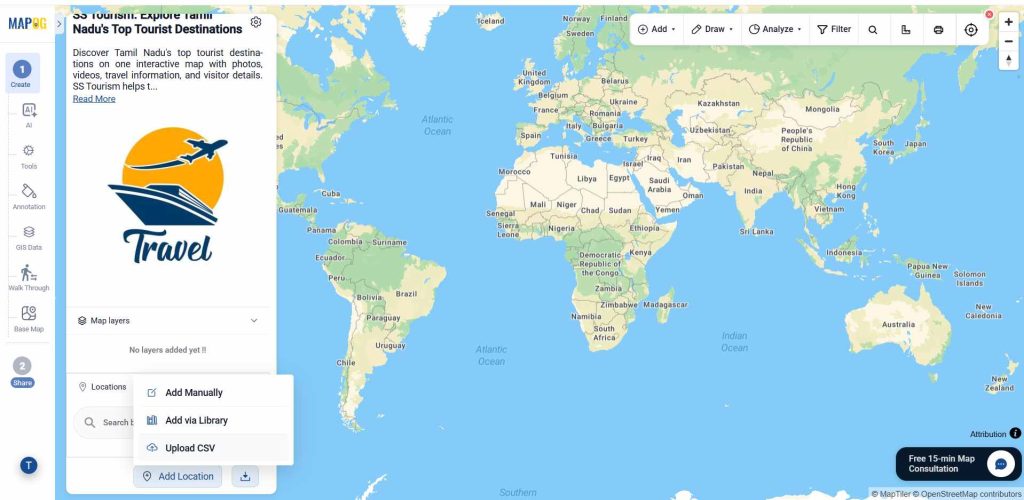
Click add location and choose Upload CSV to import your real estate data. This converts spreadsheet records into interactive map locations with property details.
Then, select the created template from the dropdown and upload your CSV/Excel file, then give upload.
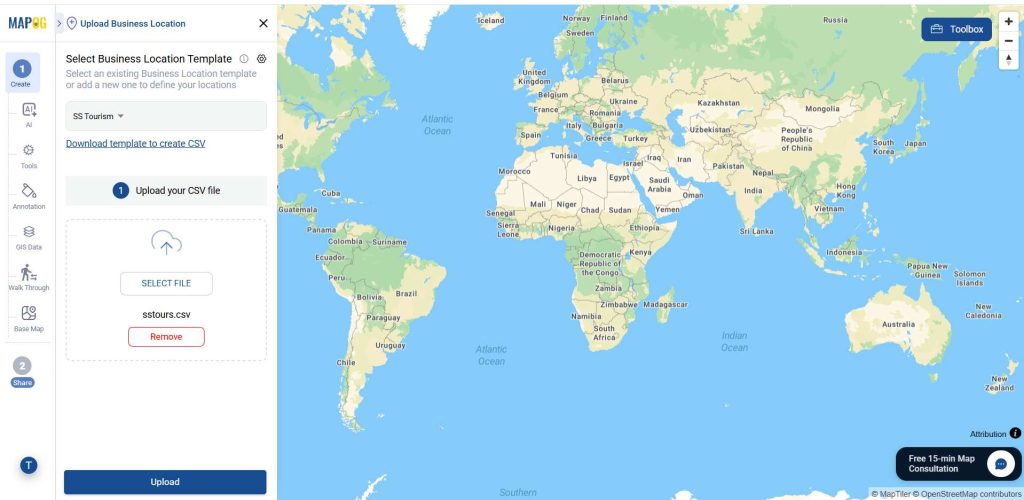
Assign a Unique ID to uniquely identify every location, helping prevent duplicates and enabling easy tracking and updates.
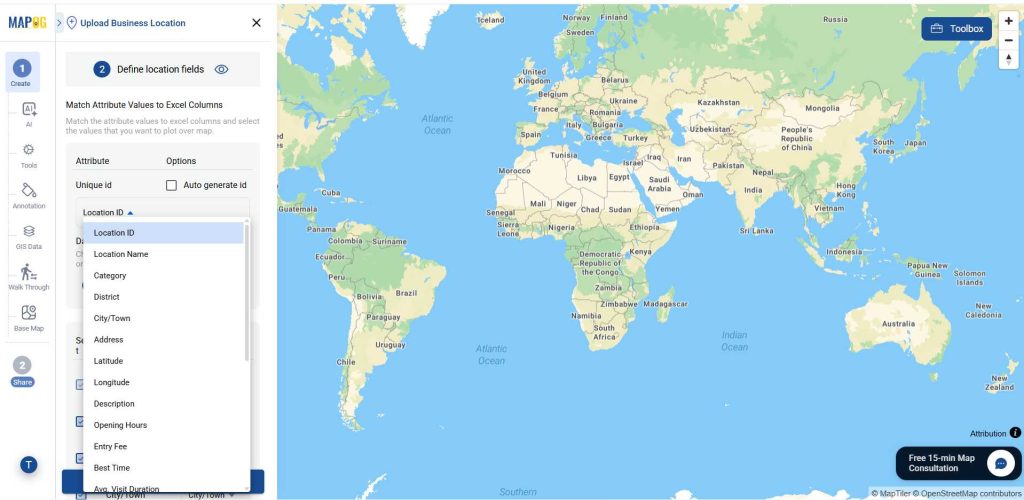
Later match the address, email, website and tower type column with excel attributes. In the select field type give latitude in first column, give longitude in second column, then give submit.
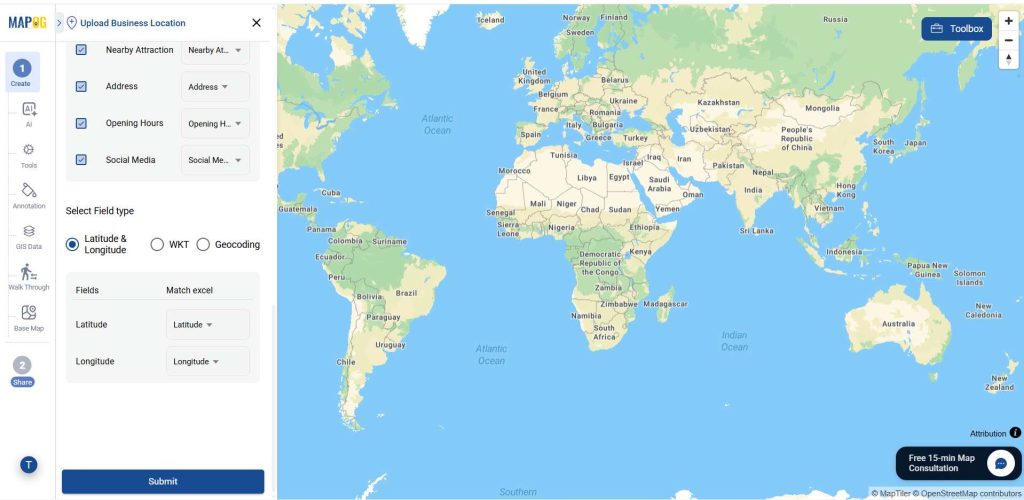
Step 4 : Style and Edit the points
Now click on the edit business location details option.
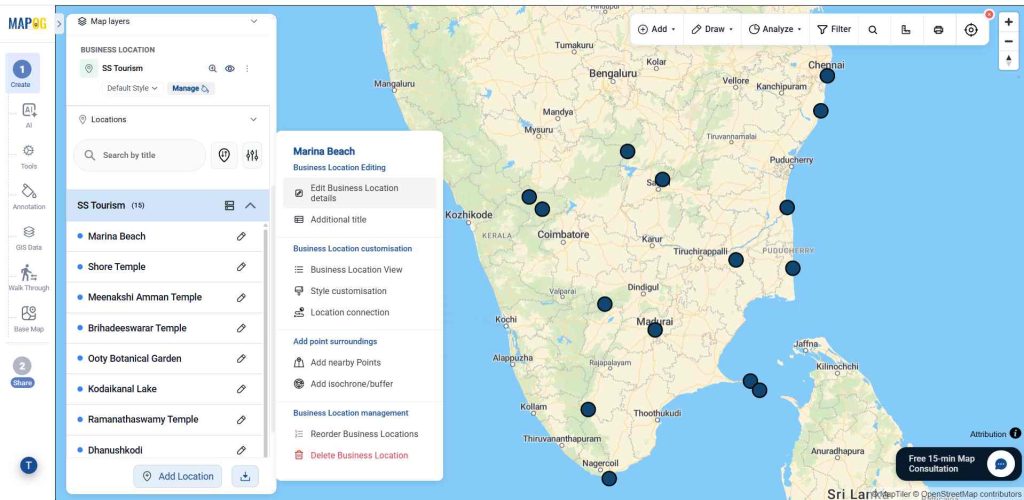
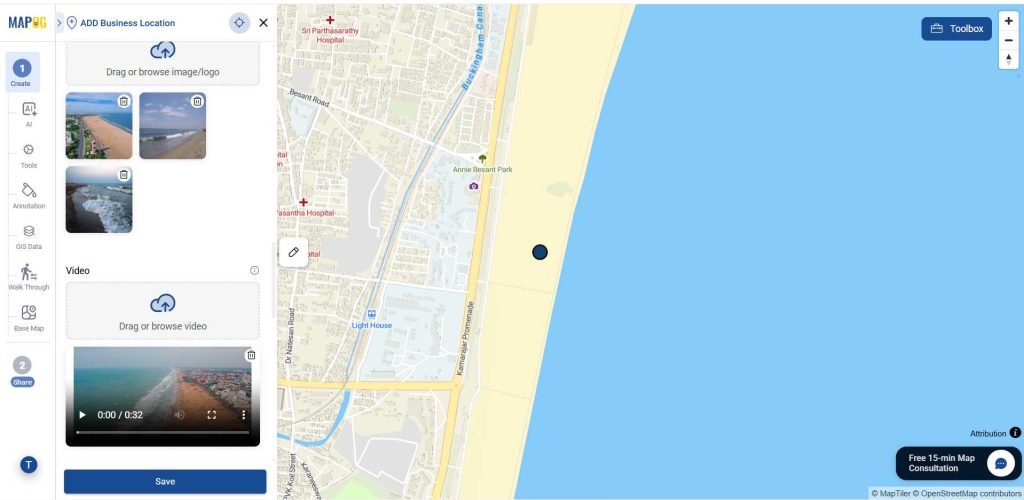
Add description and images and other required details to complete the attributes and follow the same procedure for other points.
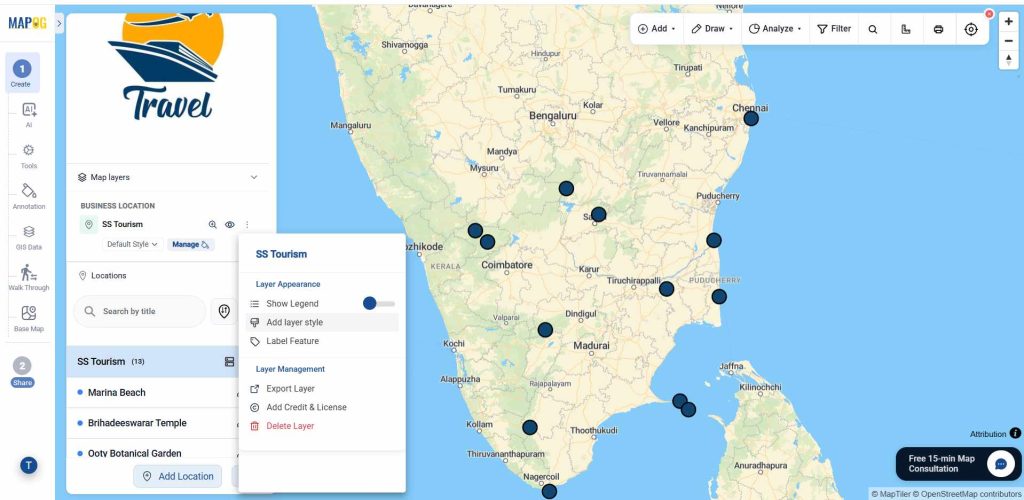
Finally, click Add Layer Style to customize how the point appears.
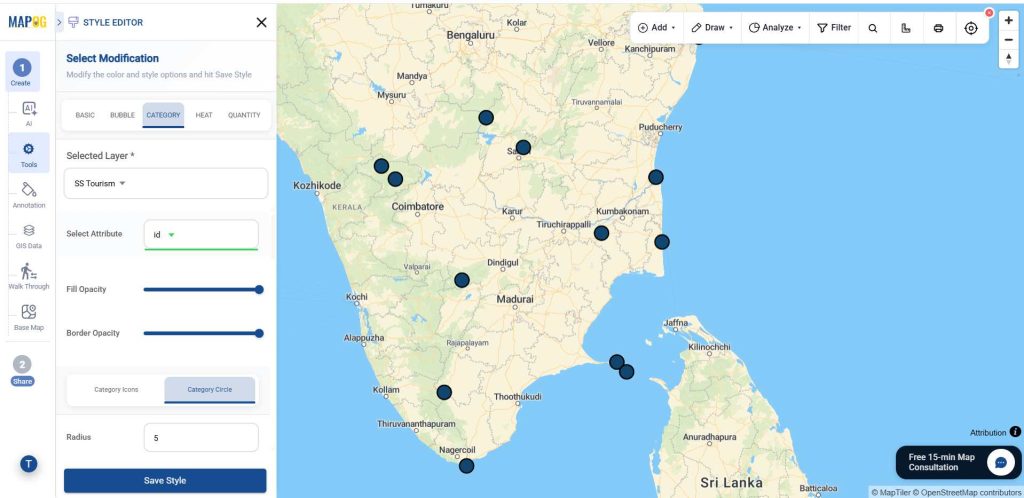
Move to the category section, and select the required attribute in the required layer option.
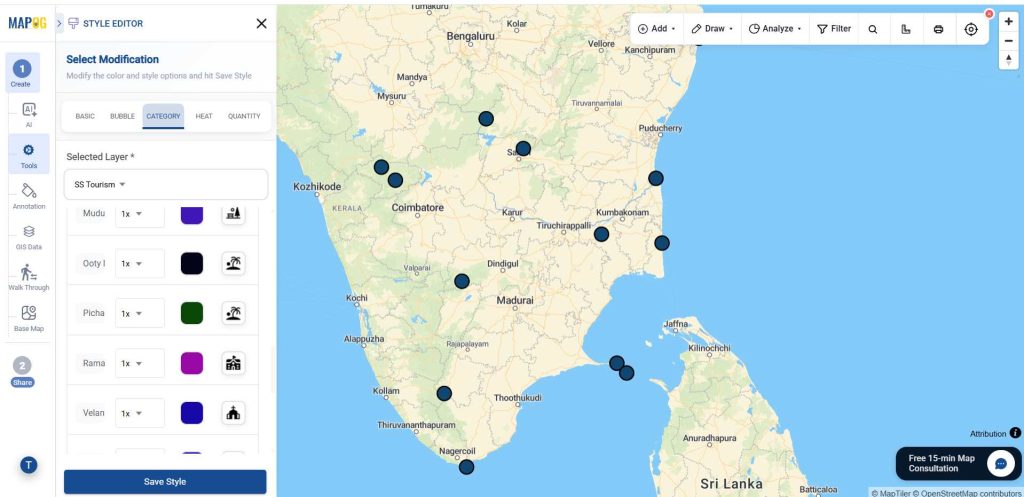
Select an icon and colour to each, and save the style.
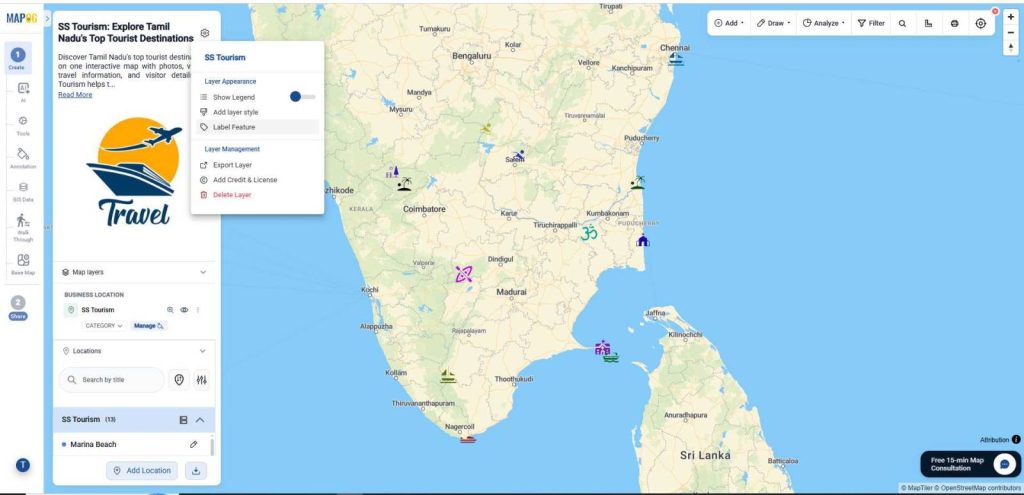
Now, select the label feature option.
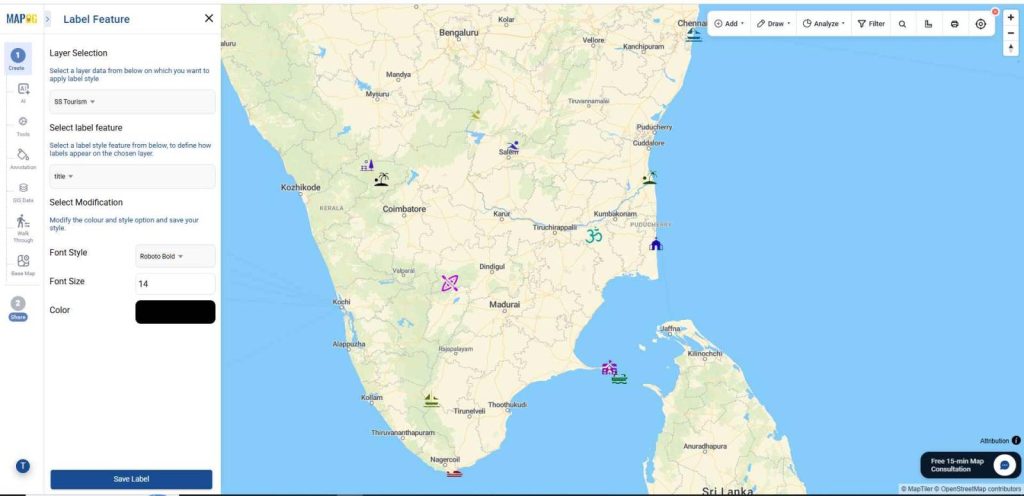
In the select label feature give the layer which you want to label, then select the suitable font, size and color, finally give the save label.
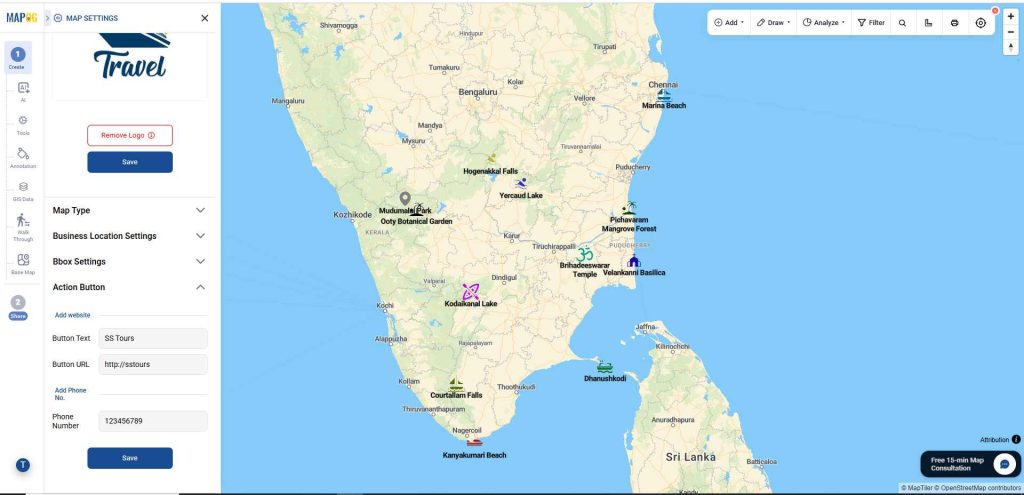
To boost engagement, go to Map Settings and add a Call-to-Action button with text, URL, and mobile number. Then save.
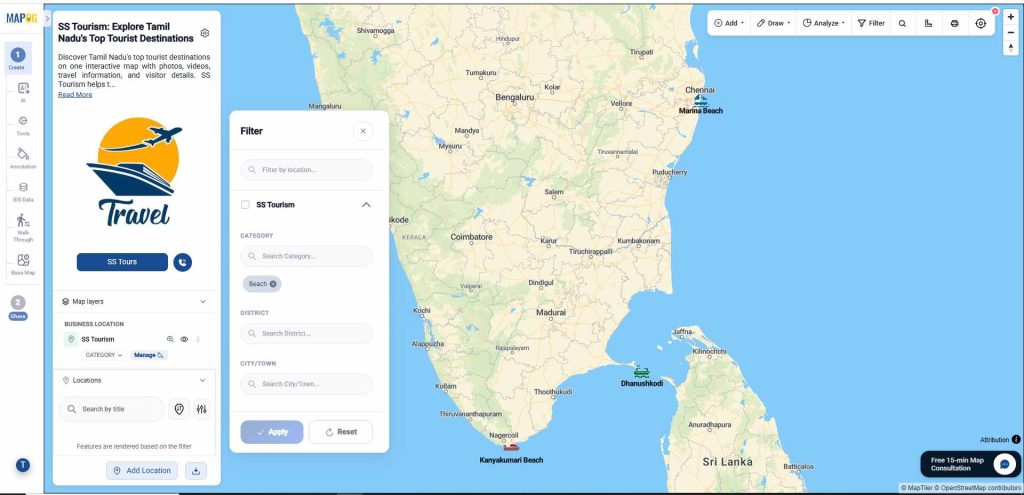
4. Filter by filter option:
Now go to the filter option, there you can find options such as category, district and entry fee.
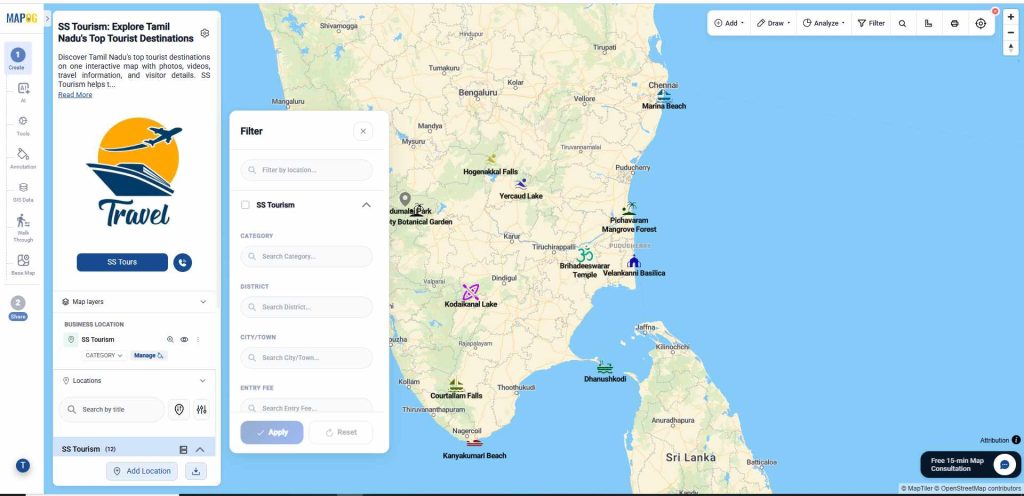
Then select the layer which you want to filter, then type the tower type and apply. Now all the locations come under the expected category.
5. Group By Attributes option:
Open group by attributes option. In the property to group attributes, select the option which you want to group.
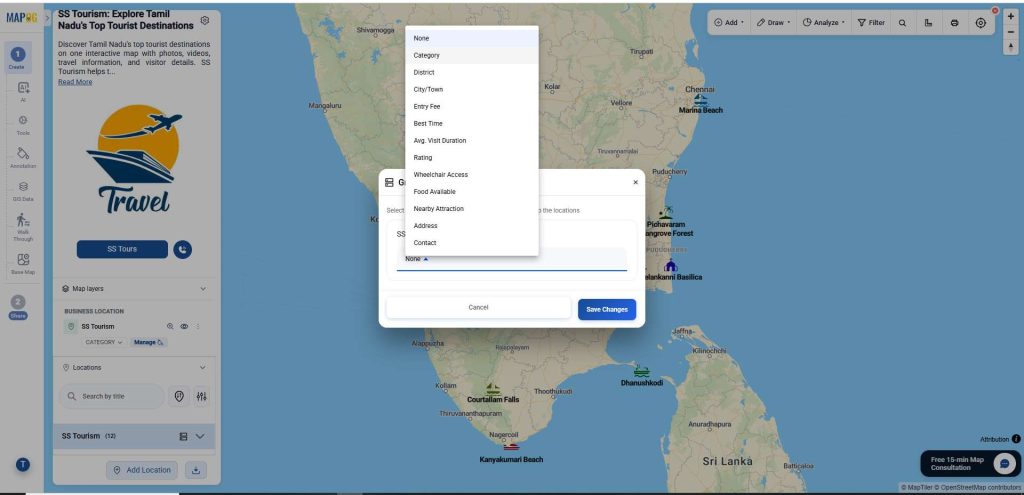
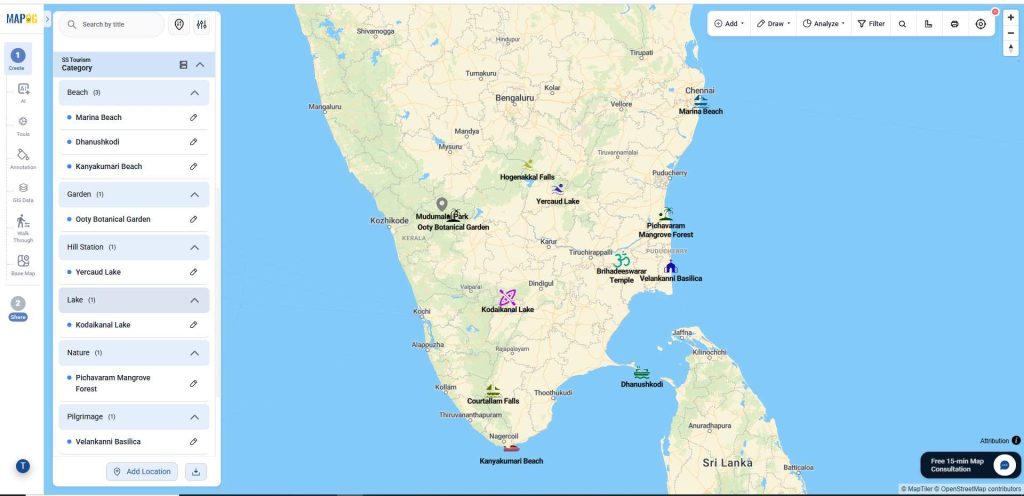
Then, give save changes, now you can see the locations grouped into beach, lake and park.
Step 6: Preview & share option
Once your map is ready, go to Preview & Share. Use Add User to invite collaborators and assign roles—Editors can manage content and points (no admin/delete rights), while Viewers have view-only access.
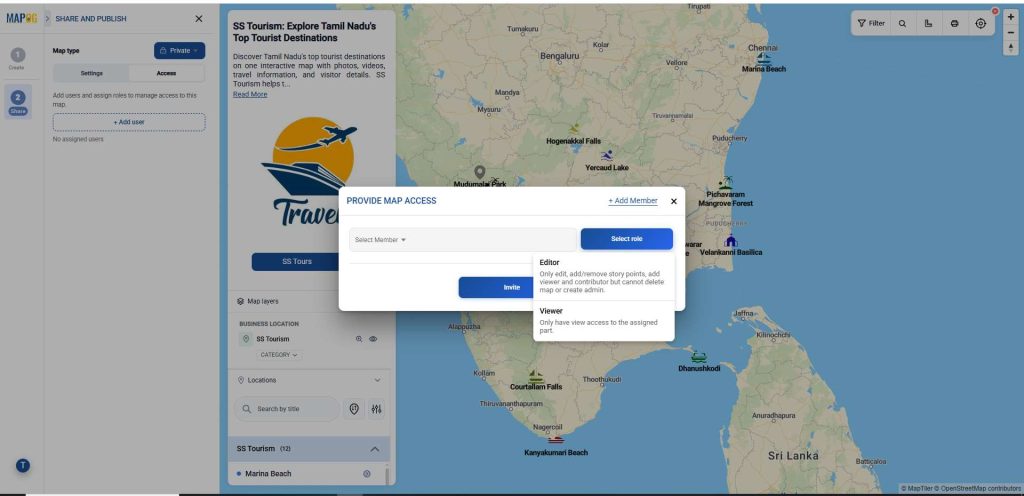
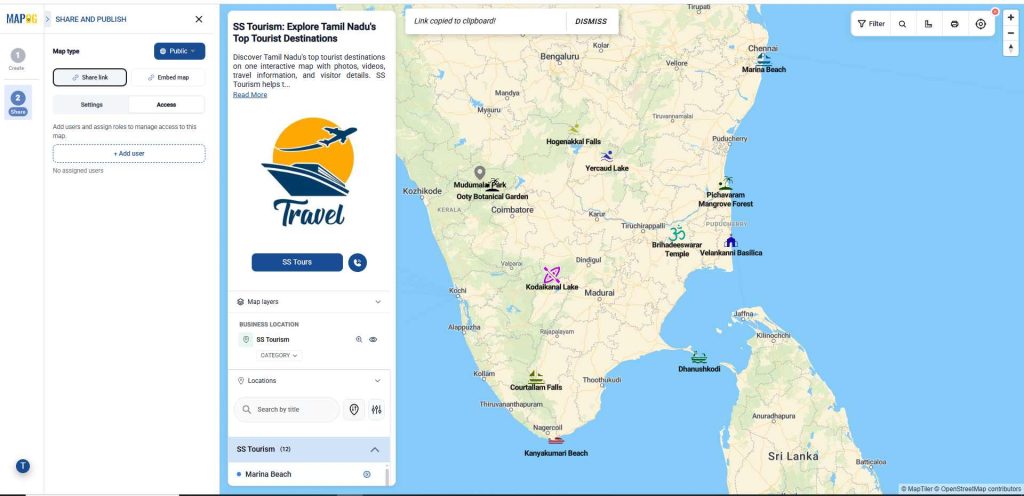
Switch the map from Private to Public to enable sharing. Use the Share Link for quick sharing via email, chat, or social media.
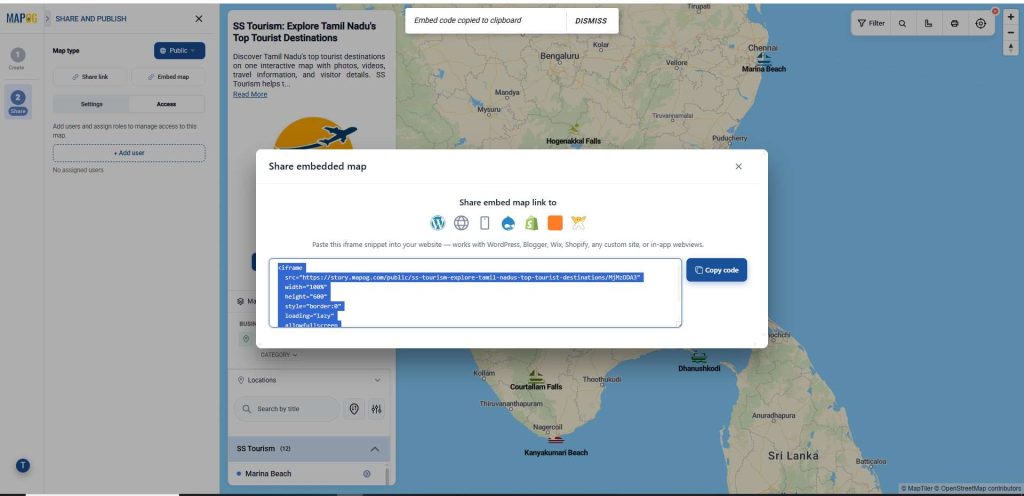
To display your map on a website, select Share Embed Link and use the Embed Map option.
Application to Visualize Multiple Locations with Rich Information and Media on Maps
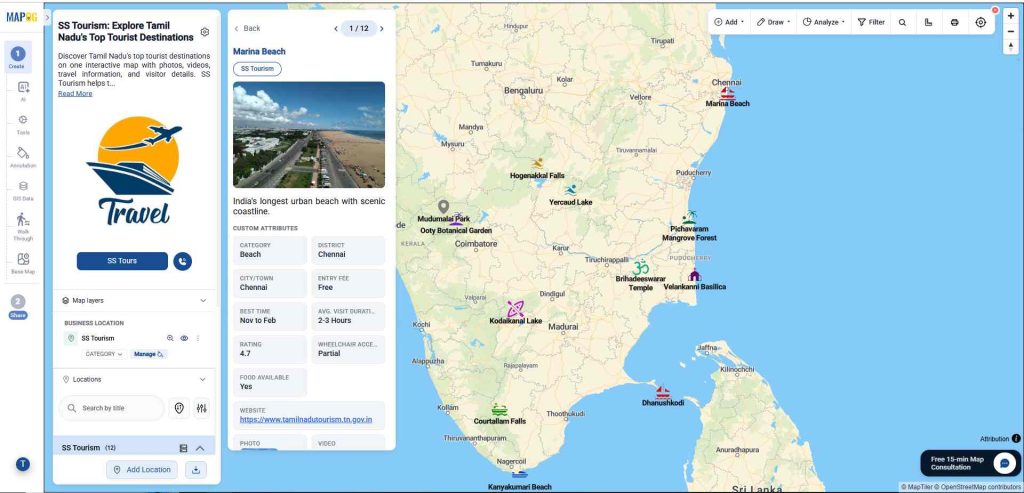
Tourism organizations can use interactive maps to create digital travel guides that showcase attractions, hotels, restaurants, shopping areas, and transportation services. Each location can include images, videos, travel tips, booking links, and visitor information, helping tourists plan their trips more efficiently while promoting local destinations.
Conclusion
With MAPOG, tourism organizations can transform traditional travel guides into interactive mapping experiences. By combining multiple locations with rich information and multimedia, MAPOG improves visitor engagement, simplifies trip planning, and helps travelers explore destinations with greater ease and confidence.