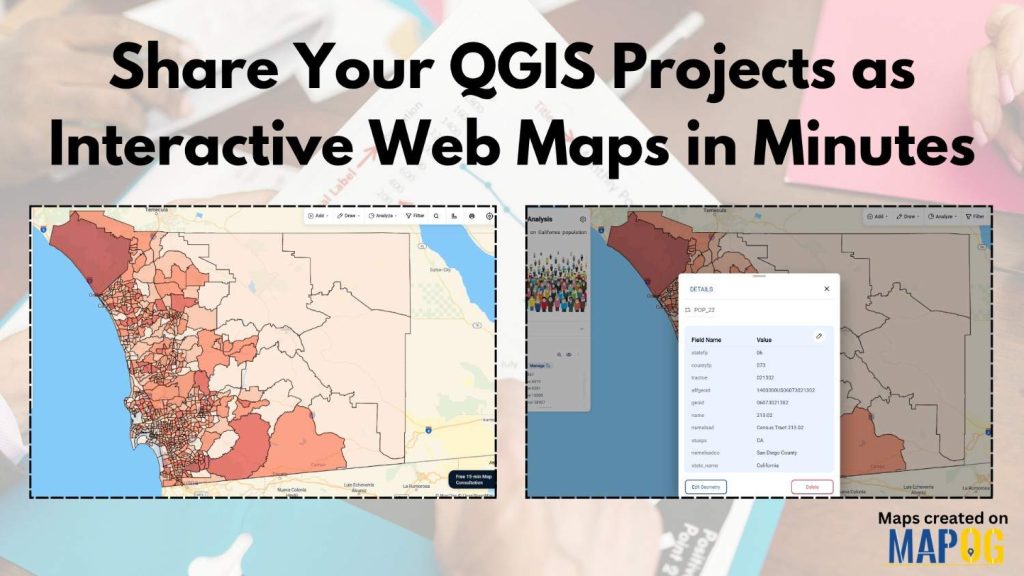
Many GIS professionals create detailed maps in QGIS, but sharing QGIS projects with clients or teammates often becomes difficult. Large project files, software compatibility, and limited collaboration can slow down decision-making. However, we can solve this challenge by publishing your work as an interactive web map. With the MAPOG QGIS Plugin, you can Share QGIS Projects directly from QGIS to the web in just a few minutes. As a result, your population maps become easier to view, analyze, and share without requiring everyone to install QGIS.
Key Concept: Why Share QGIS Projects Online?
When you Share QGIS Projects, your GIS work becomes accessible from any browser. Instead of sending large project files, you simply share a link. Moreover, web maps allow users to zoom, explore attributes, and visualize data interactively.
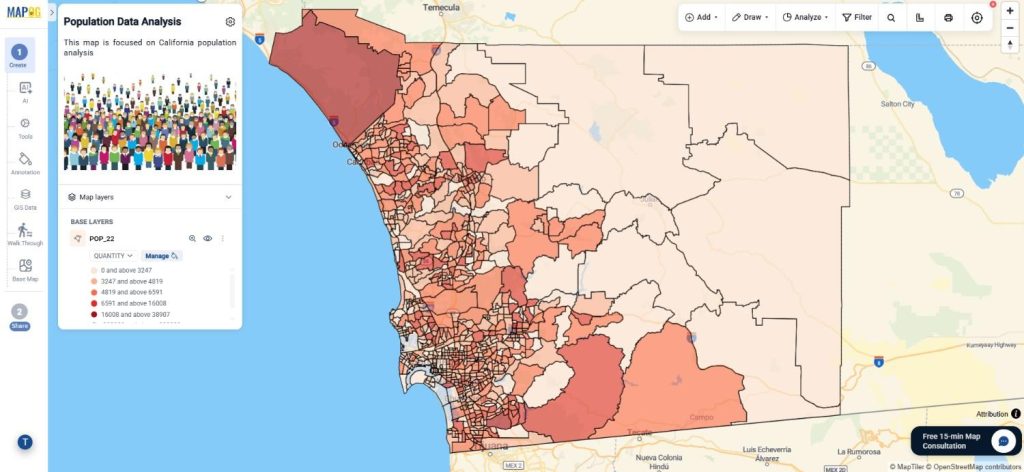
For example, imagine you’re analyzing population data for different districts. After publishing the project, planners, researchers, or local authorities can instantly identify high and low population regions without opening GIS software. Furthermore, we can style & update the same project later whenever required.
Step-by-step process to Share QGIS Projects
Step 1: Prepare Your Population Dataset
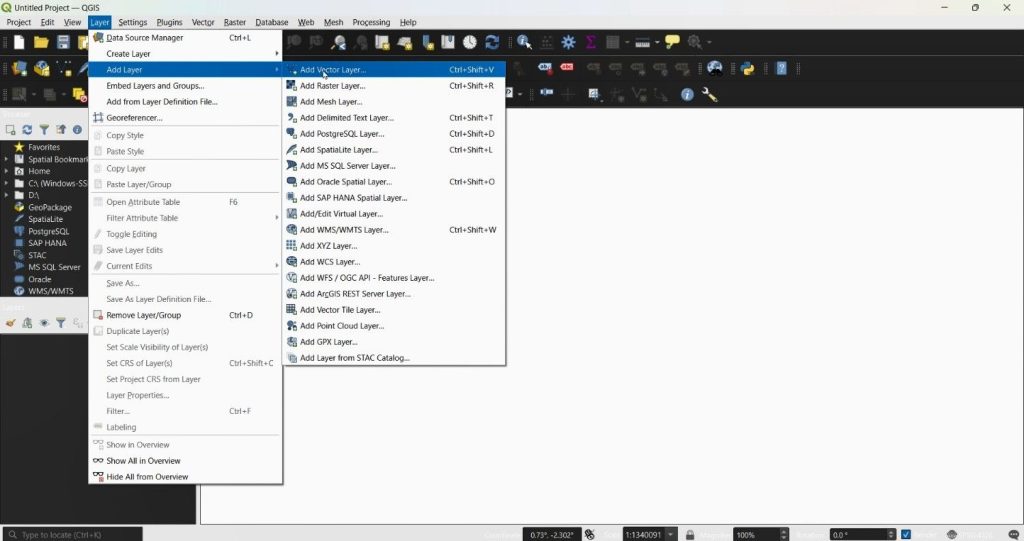
First, open QGIS and either load an existing project or create a new one. In this example, upload a population dataset by selecting Layer → Add Layer → Add Vector Layer.
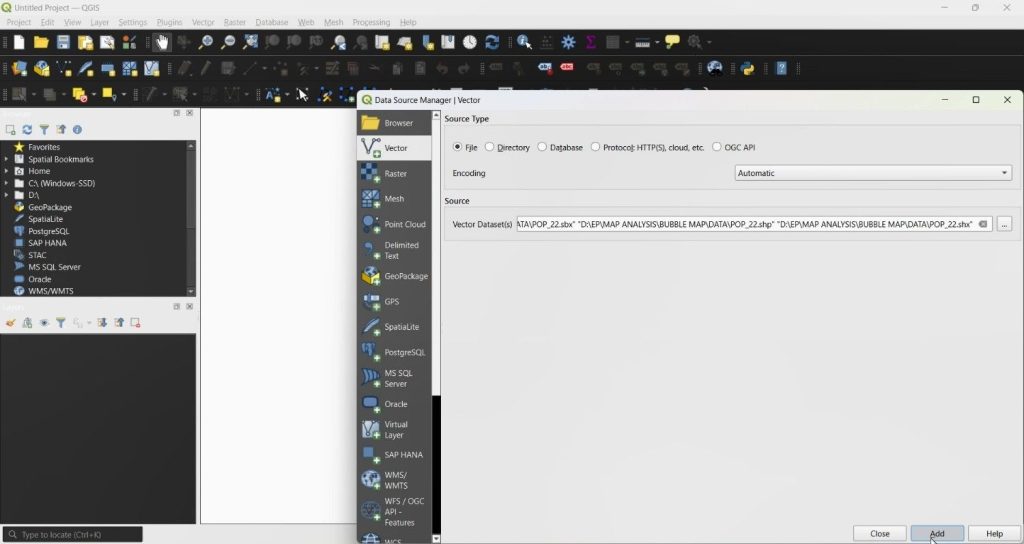
Browse your data, and add it to the map. After loading the layer, your project is ready for publishing. Meanwhile, check that the population attribute is available because we’ll use it later for visualization.
Step 2: Share QGIS Projects Using the MAPOG Plugin
Next, open Plugins → Manage and Install Plugins.
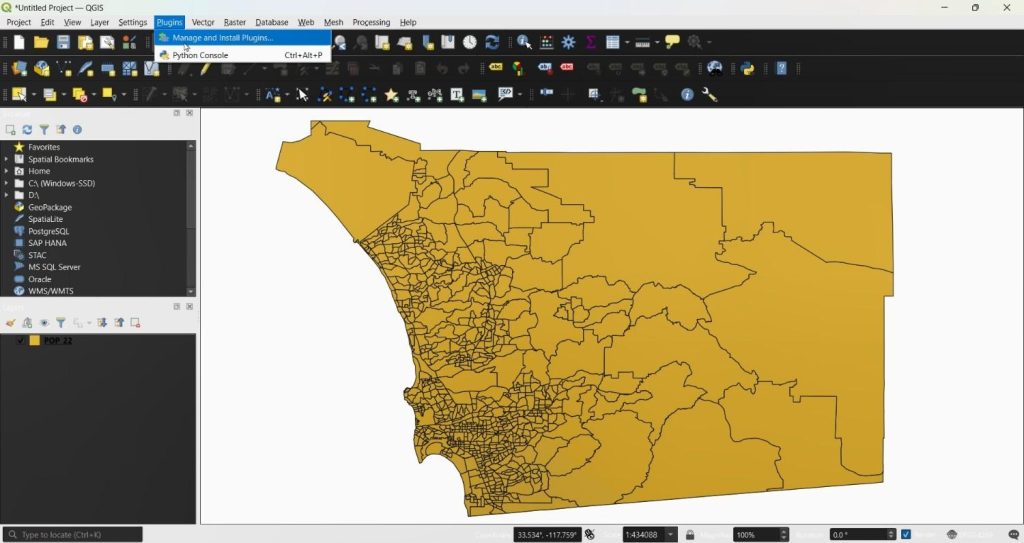
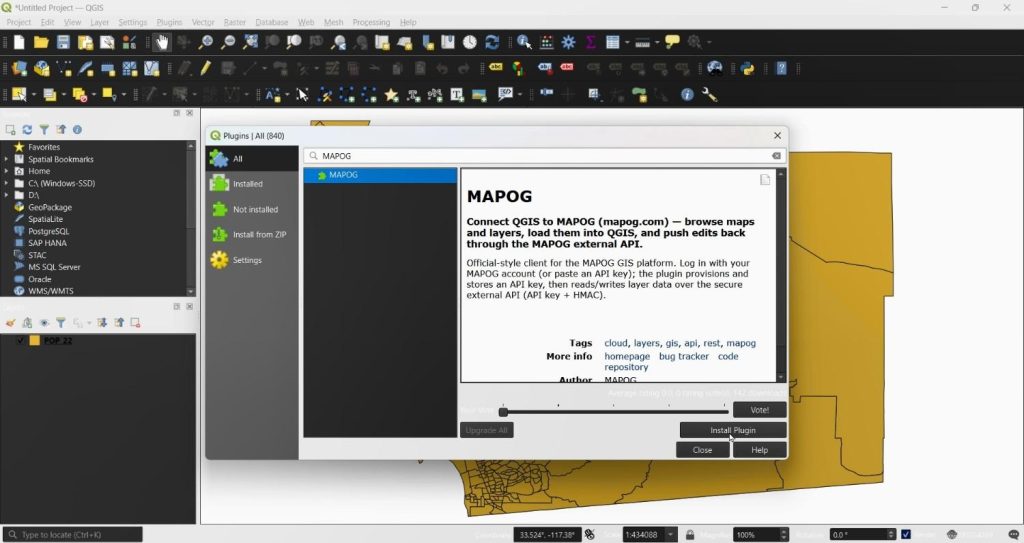
Search for the MAPOG Plugin & install it. This plugin will help to share QGIS project in web.
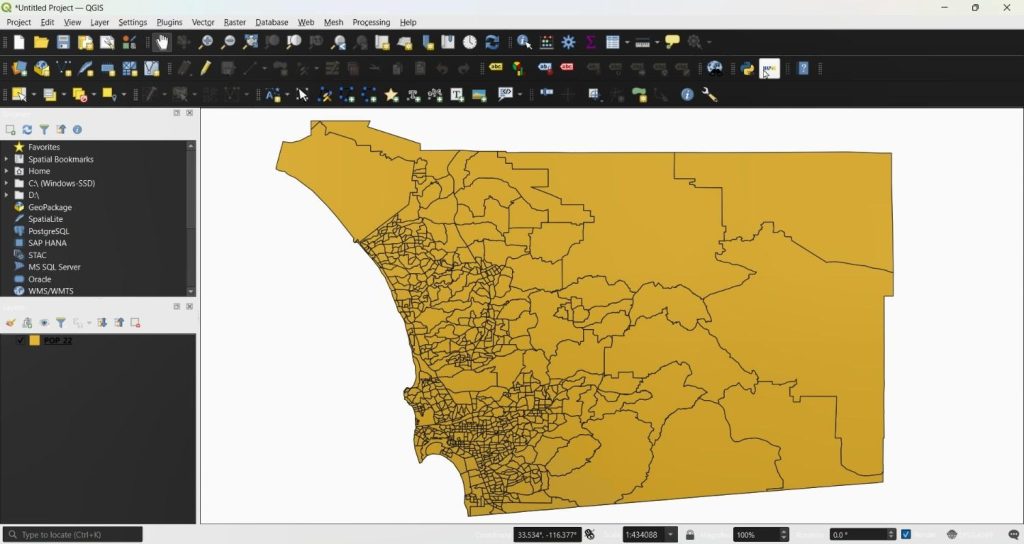
After installing it, ypu can find it in the toolbar section.
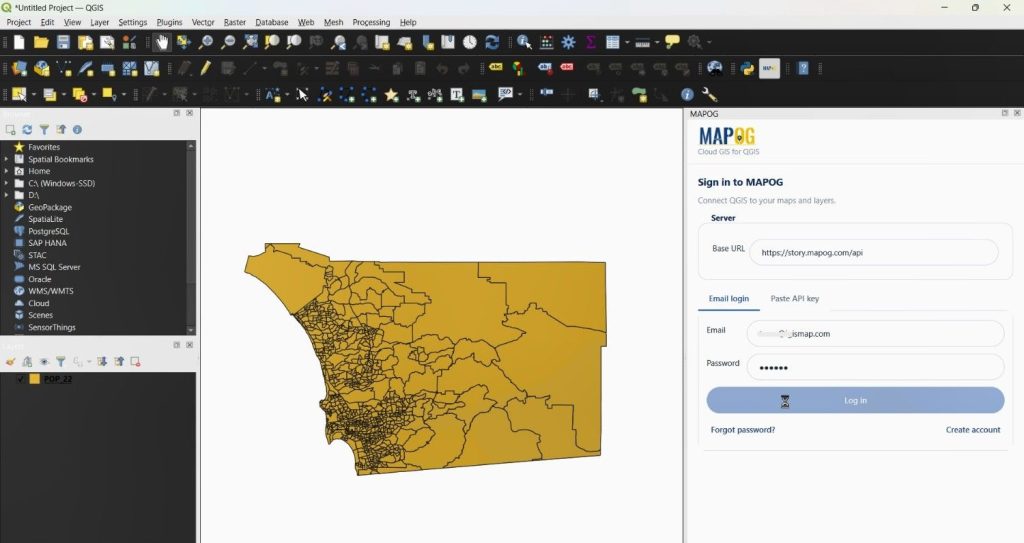
Launch the plugin and sign in using your MAPOG account credentials.
You will notice options such as MAPOG to QGIS and QGIS to MAPOG. Since the goal is to publish your work online, choose QGIS to MAPOG. Then, click Upload Layer to MAPOG.
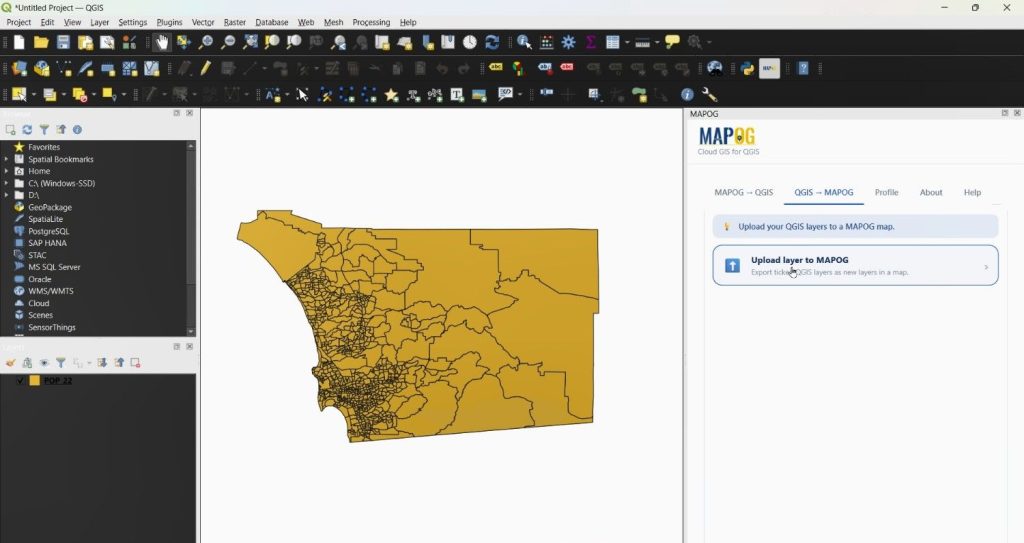
Here, you can either select an existing map to upload your QGIS project.
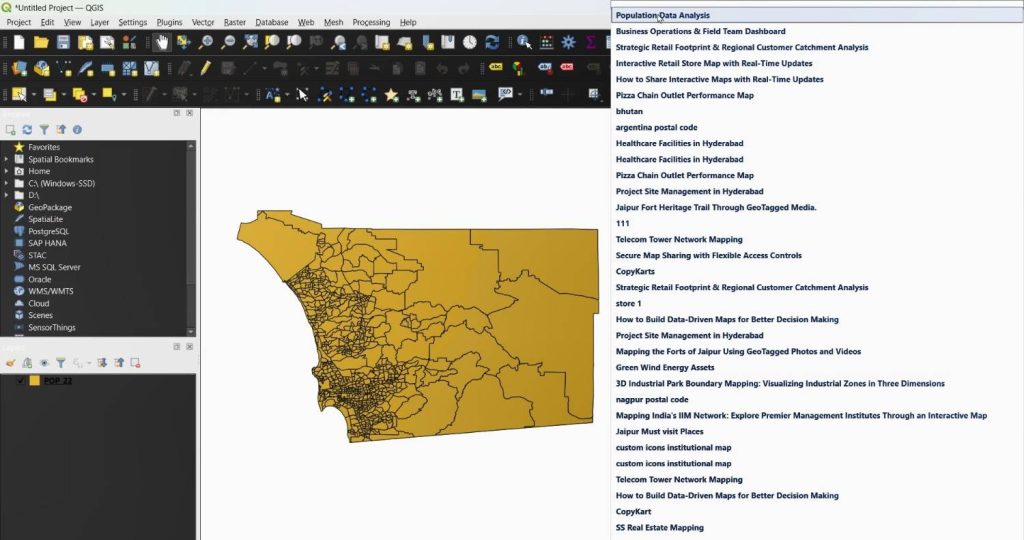
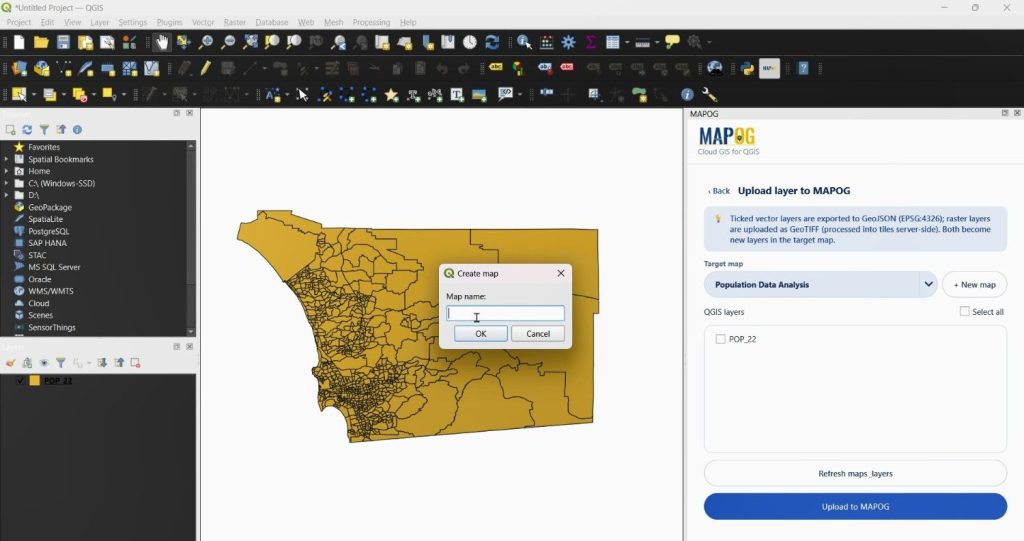
Otherwise you can also create a new project to upload this project.
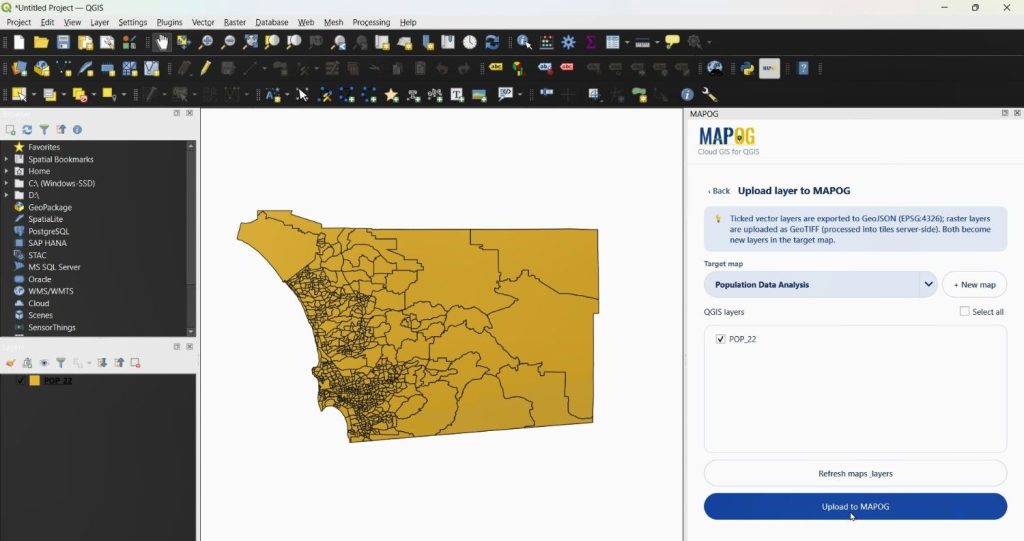
After selecting the population layer, click Upload to MAPOG. Within moments, your layer will be uploaded successfully.
Additionally, the plugin generates both public and private share links, making collaboration much easier.
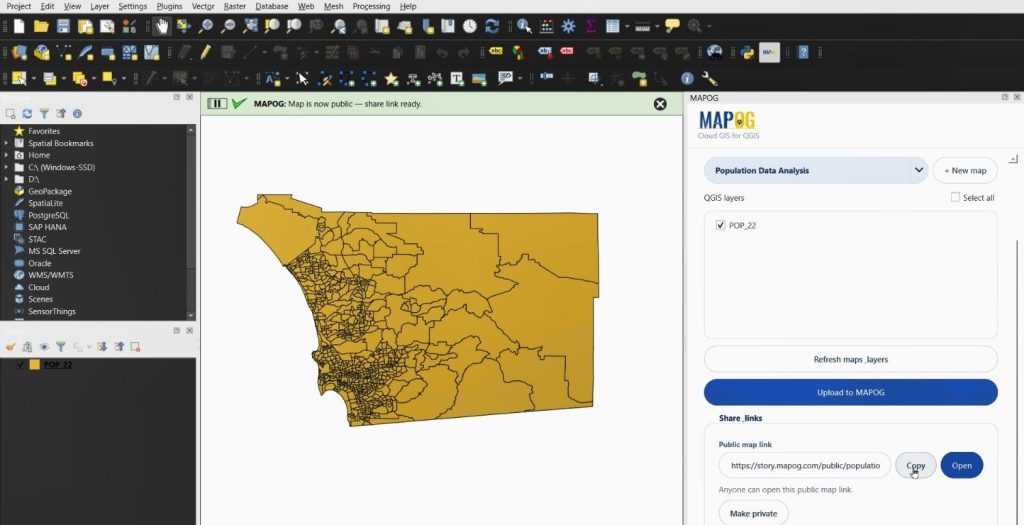
Consequently, we can share the project instantly through email, chat, or project documentation.
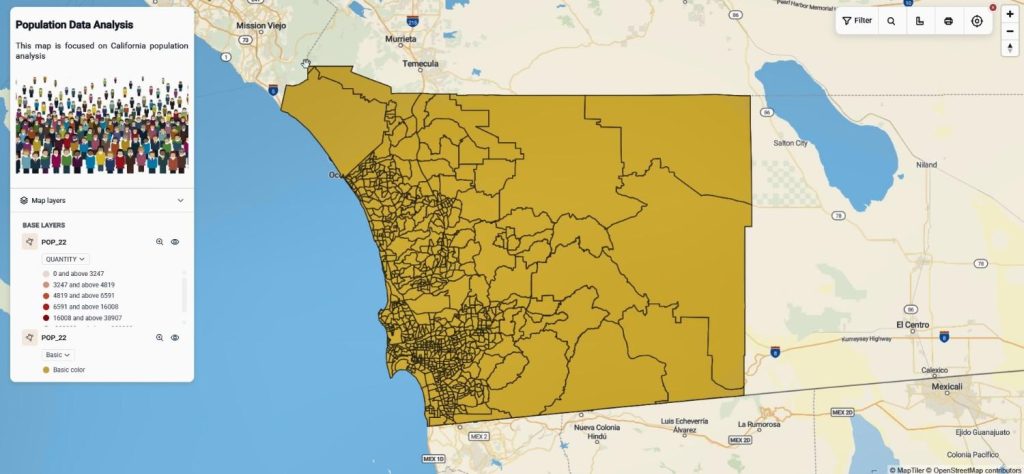
Step 3: Population Analysis in MAPOG
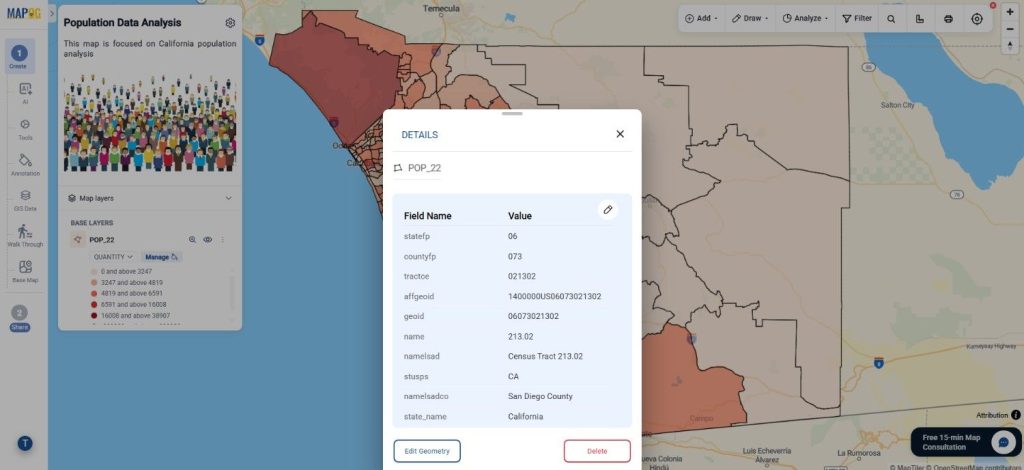
After the upload is completed, open the MAPOG platform and navigate to Create & Publish. Select the same map that we uploaded from QGIS. The population dataset will now be available online. From here, open the Attribute Table to verify the imported data.
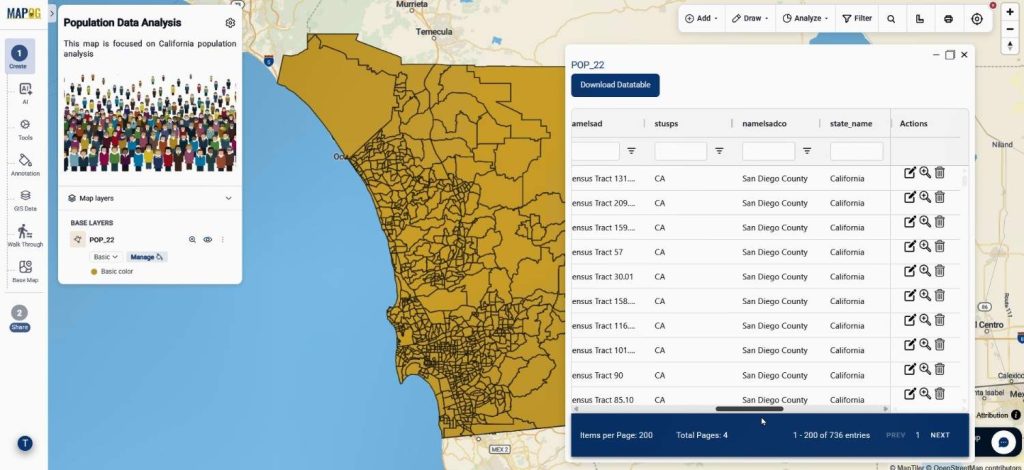
Afterwards, choose Add Layer Style, select Quantity Style, and use the Population field as the styling attribute.
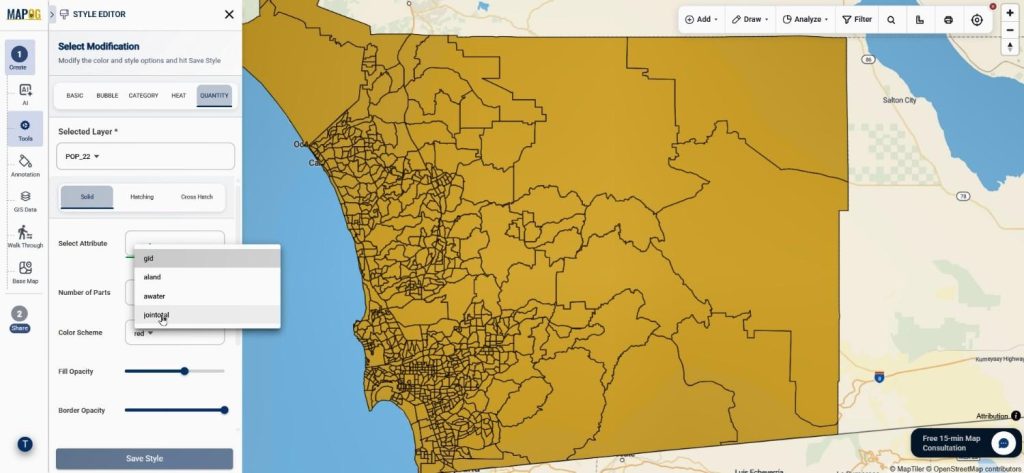
Then assign suitable colors, edit the value ranges if needed, and save the style. As a result, regions with different population levels become much easier to interpret visually.
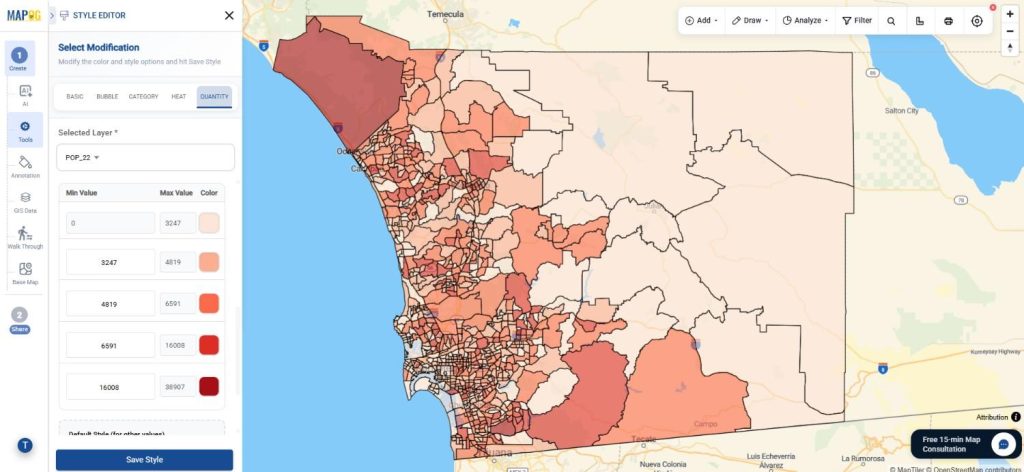
Besides styling, MAPOG also supports further map analysis, making it useful for planning, reporting, and collaborative GIS projects
Share QGIS Projects for Real-World Planning
Interactive population maps are widely used across different industries. For example, urban planners can compare population density with transportation networks to identify areas needing better infrastructure. Similarly, healthcare organizations can overlay hospitals with population data to improve service coverage. Educational institutions can also analyze school accessibility based on population distribution. Because the maps remain interactive, stakeholders can explore the information without specialized GIS software.
Conclusion
Today, GIS work is no longer limited to desktop software. When you Share QGIS Projects using the MAPOG QGIS Plugin and its QGIS to MAPOG feature, collaboration becomes faster, map sharing becomes simpler, and data visualization becomes more engaging. Whether you’re working with population datasets, environmental studies, or infrastructure planning, publishing interactive web maps helps your audience understand complex GIS information with ease.