In infrastructure planning and environmental analysis, one persistent challenge is understanding where bridges intersect rivers and how these crossings impact safety, maintenance, and flood risk. Quite often, this data remains scattered, and therefore, decision-makers face slower and less accurate outcomes. However, when you analyze bridge river crossings using modern GIS tools, you can identify patterns more clearly and minimize risks.
MAPOG, this process becomes much more streamlined. Not only can you visualize layered GIS data, but you can also calculate intersections automatically using the Cross Intersection feature. As a result, planners, engineers, and researchers are able to work faster and with better precision.
Key Concept: Understanding Analyze Bridge and River Crossings
Before jumping into the process, it’s important to understand what it means to Analyze Bridge River Crossings. Essentially, this involves overlaying two spatial datasets—bridge locations (polygon or point data) and river networks (line data)—to identify where they intersect.
This is where MAPOG GIS Data becomes especially useful. It allows users to pull ready-to-use datasets and, moreover, apply the Cross Intersection tool to generate a new layer showing only the crossing points. Consequently, this eliminates manual work and reduces human error.
Step-by-Step Process to Analyze and Bridge River Crossings
Step 1: Create Your Map
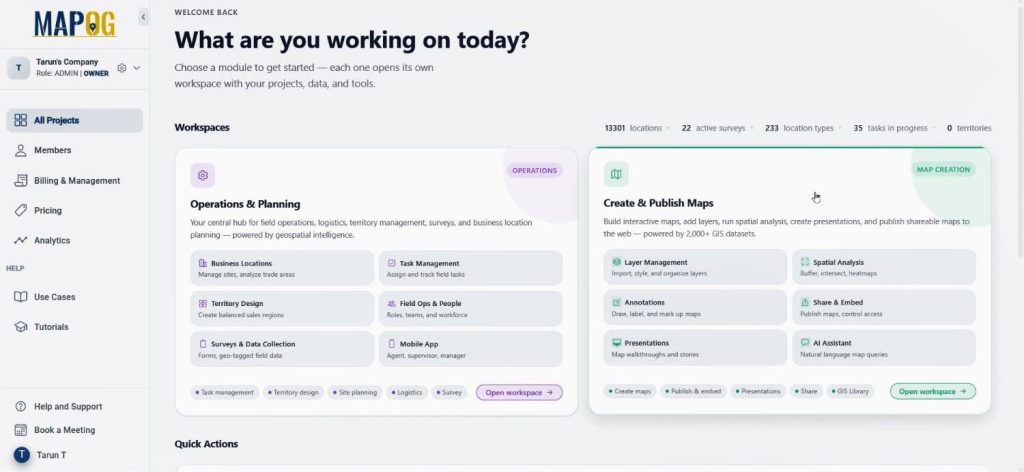
To begin with, open MAPOG and navigate to the Create & Publish Maps section.
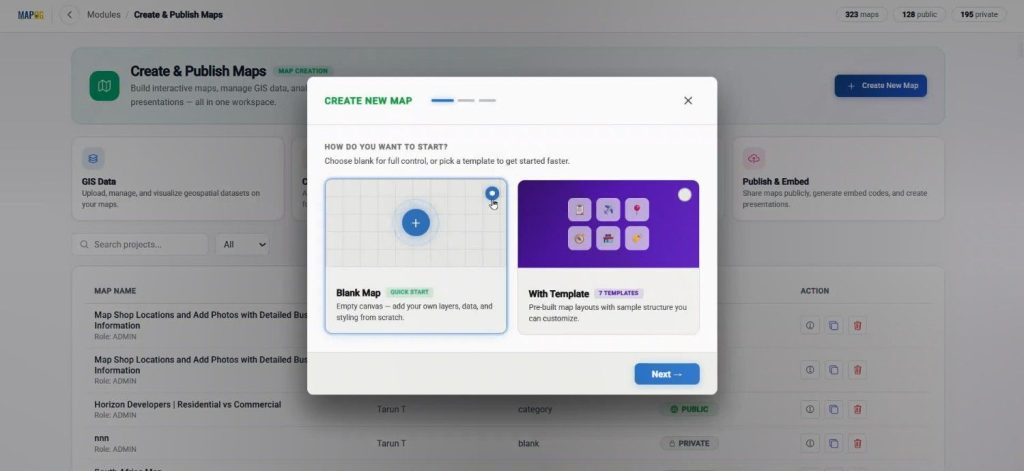
Then, select a blank map.
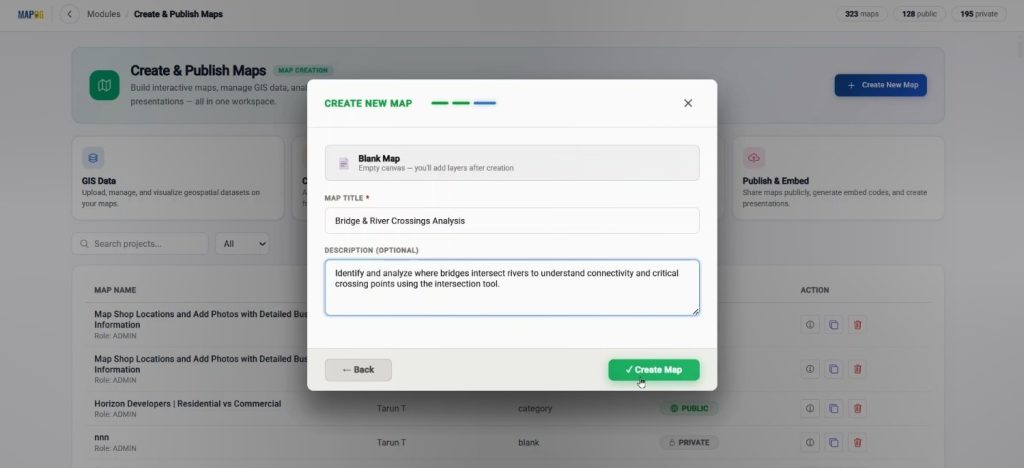
and proceed by adding a title and description. Once done, click create map & your workspace will be ready.
Step 2: Add GIS Data Layers for Analyze and Bridge River Crossings
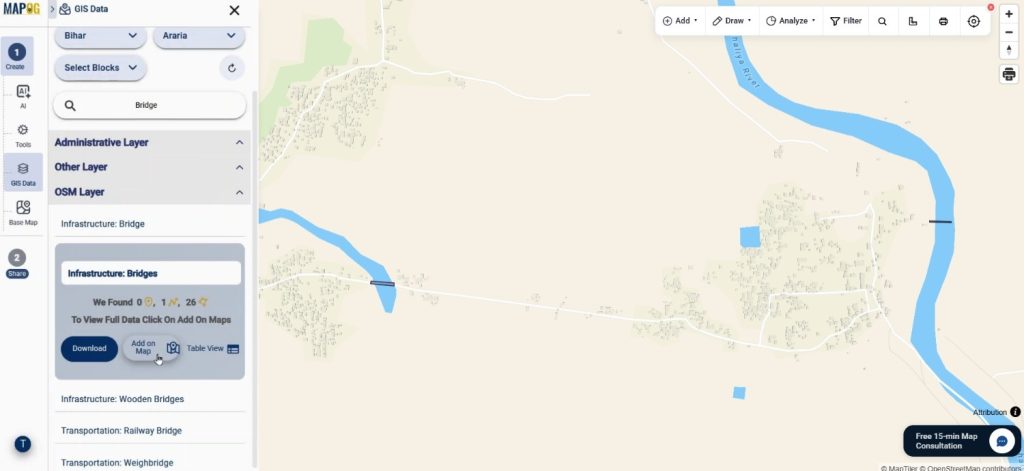
Next, go to the GIS Data tool.
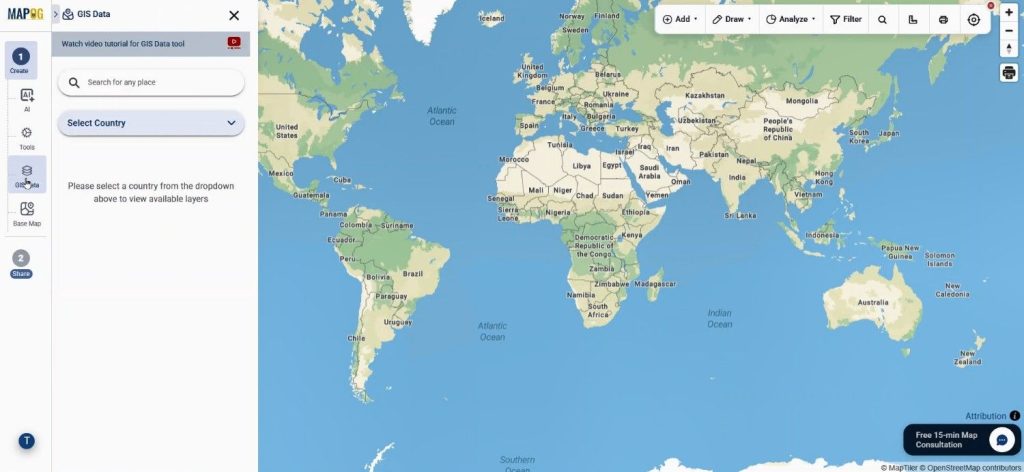
From here, select your country and filter down to your specific region. After that, search and add the bridge layer on map using Add on map option.
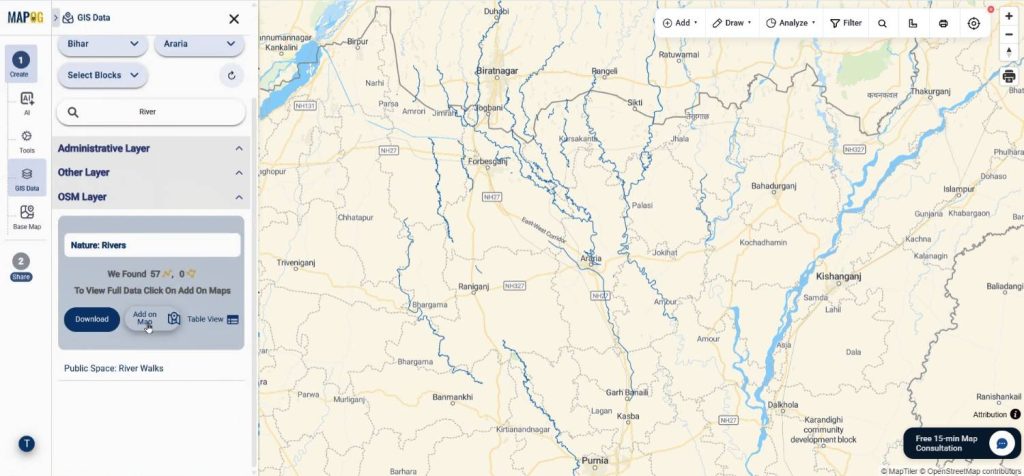
Similarly, you should also add the river layer. Because MAPOG GIS Data provides structured and easy-to-filter datasets, you can quickly access relevant data.
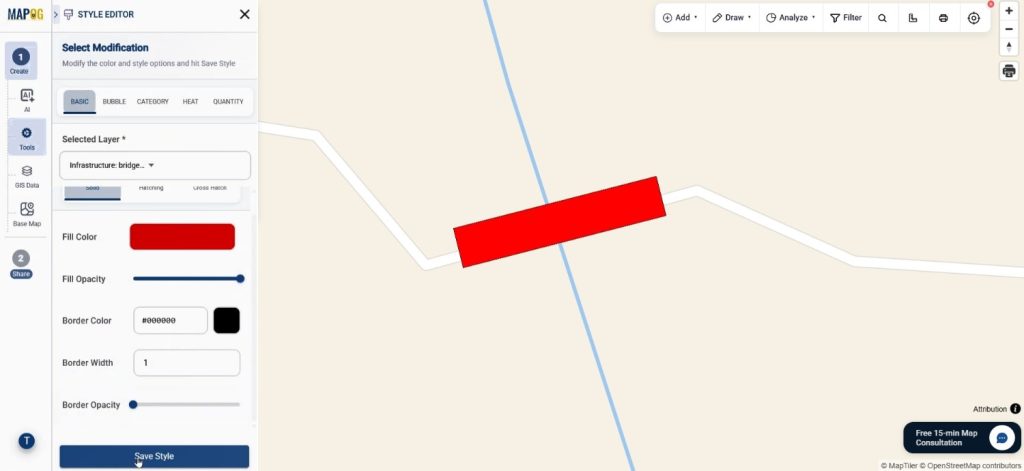
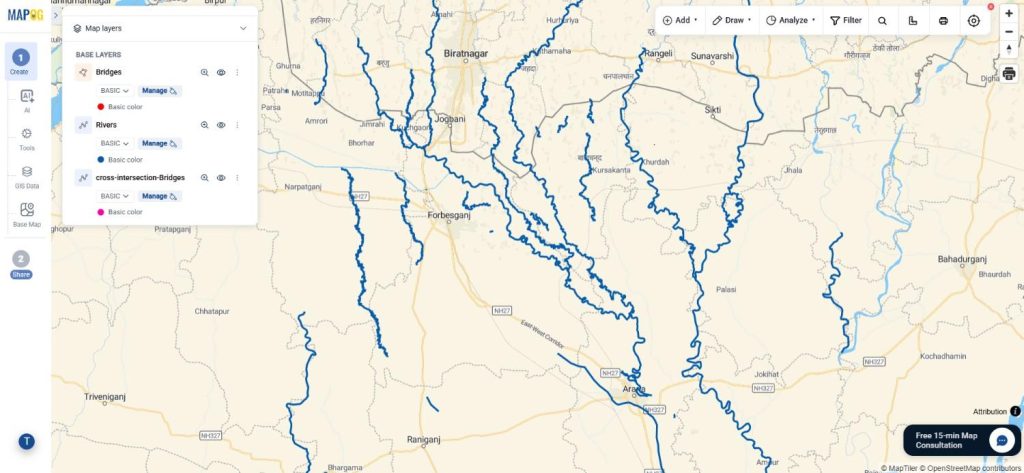
Step 3: Style Layers to Improve Analysis
After adding layers, head to the layer settings and apply add layer styles. For instance, you can highlight bridges in bold colors, while you can style rivers with blue tones. When done, save the style.
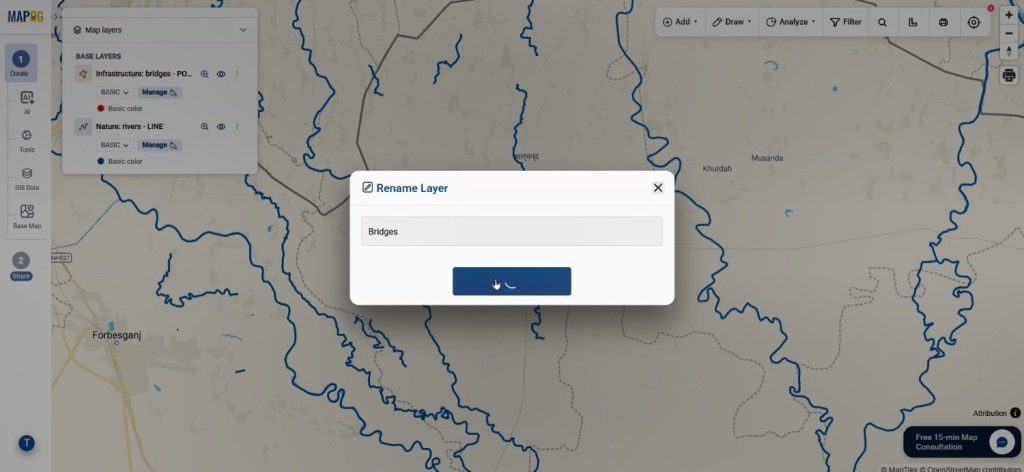
Additionally, renaming layers helps maintain clarity. This step ensures that when you Analyze Bridge & River Crossings, the visualization remains clean and easy to interpret.
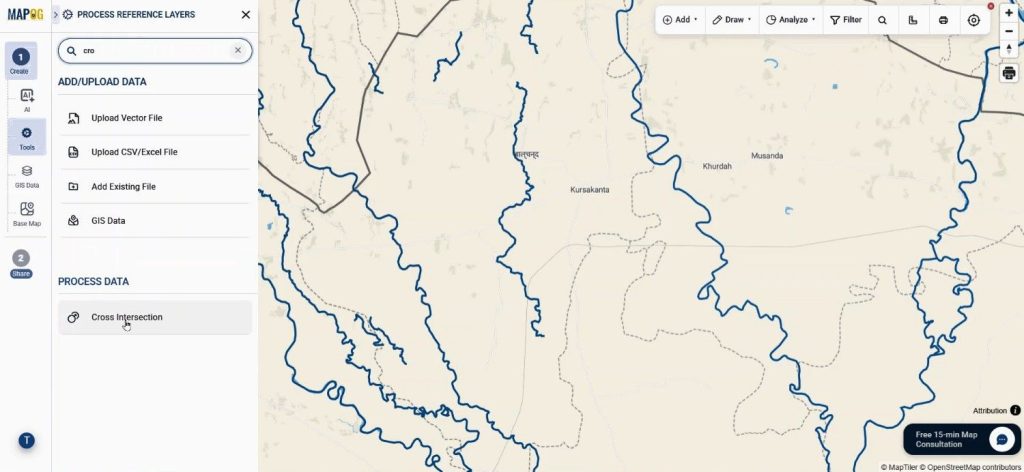
Step 4: Apply Cross Intersection Tool to Analyze and Bridge River Crossings
Now comes the most crucial part. Navigate to the tools section and select Cross Intersection.
Then, choose the bridge layer as your primary polygon dataset and select relevant attributes. Afterward, pick the river layer as the line dataset and assign its attributes as well.
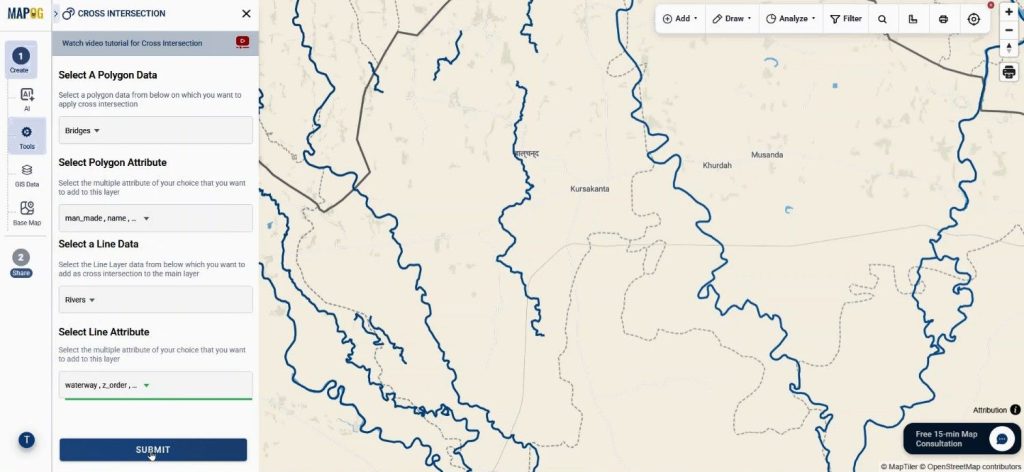
Once submitted, the system will automatically generate all crossing sections. As a result, every location where a river intersects a bridge will appear instantly. This is where MAPOG’s Cross Intersection feature stands out, as it performs complex spatial analysis in just a few clicks.
Step 5: Visualize and Explore
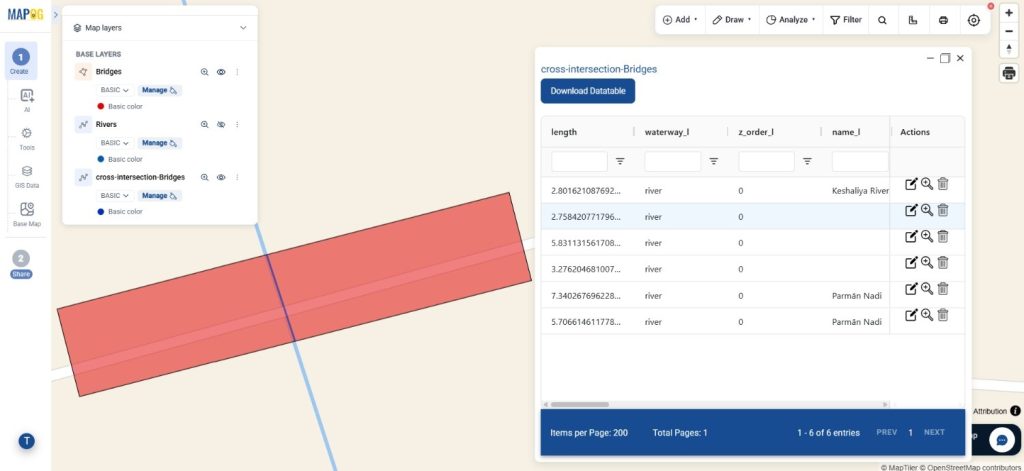
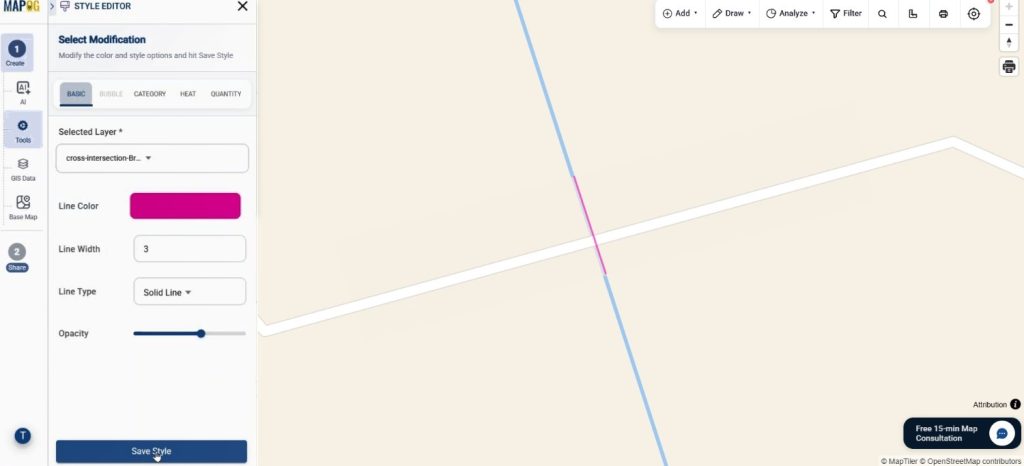
After you create intersections, you can further style this new layer using add layer style.
Moreover, by enabling the data table, you can view detailed information about each crossing.
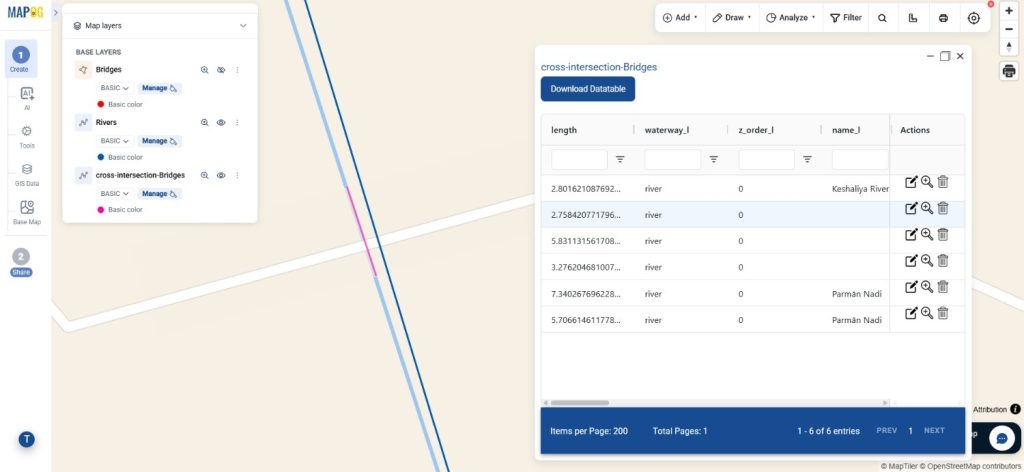
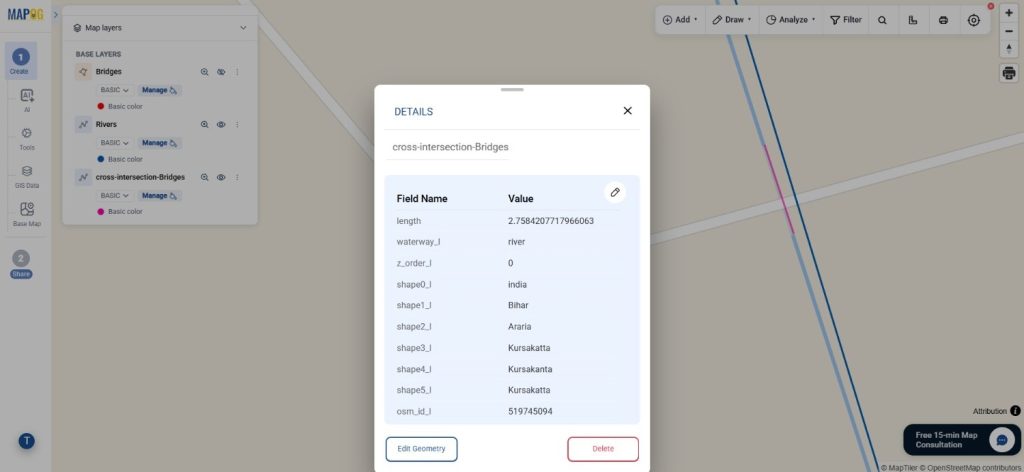
Clicking on any point reveals attributes such as location and associated data. Therefore, insights are not only visual but also data-driven when you Analyze Bridge River Crossings.
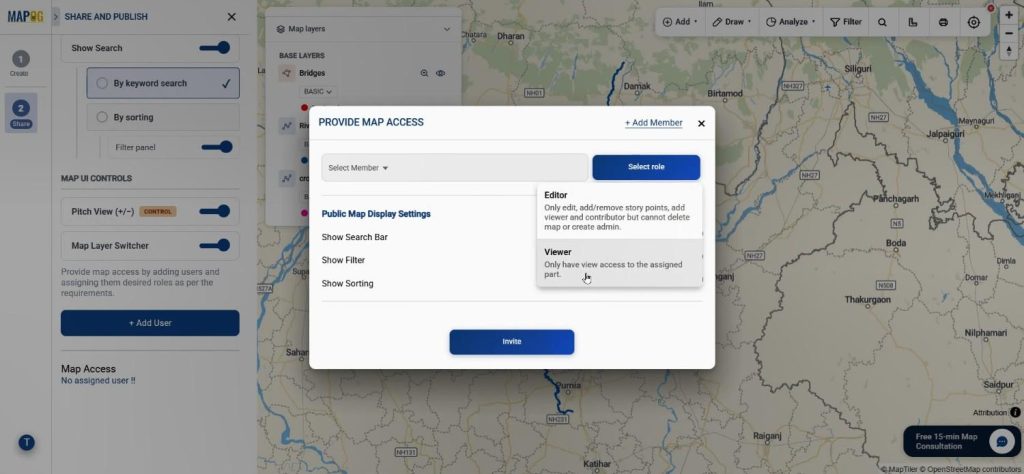
Step 6: Share and Collaborate on Analyze & Bridge River Crossings
Finally, move to the Preview and Share section. Here, you can make your map public or private.
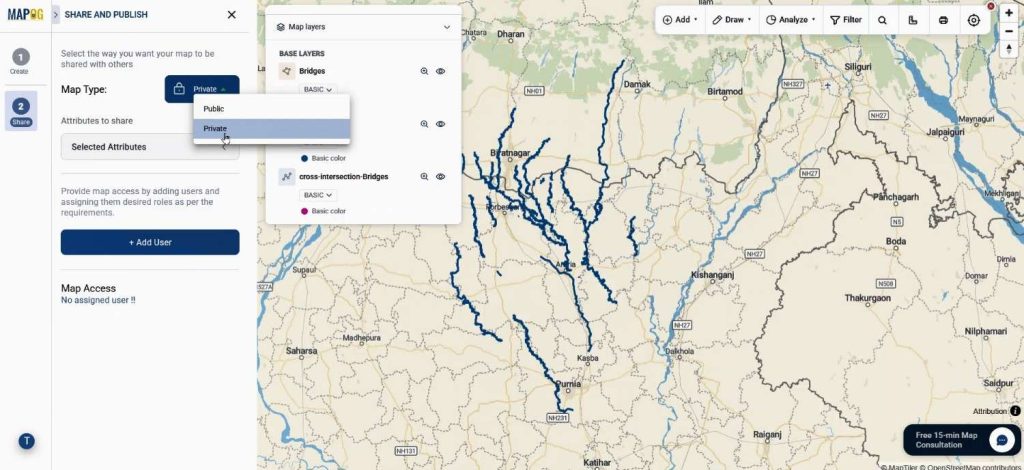
Additionally, it can be embedded into websites or shared via links with enabling the geometry filters & sorting options.
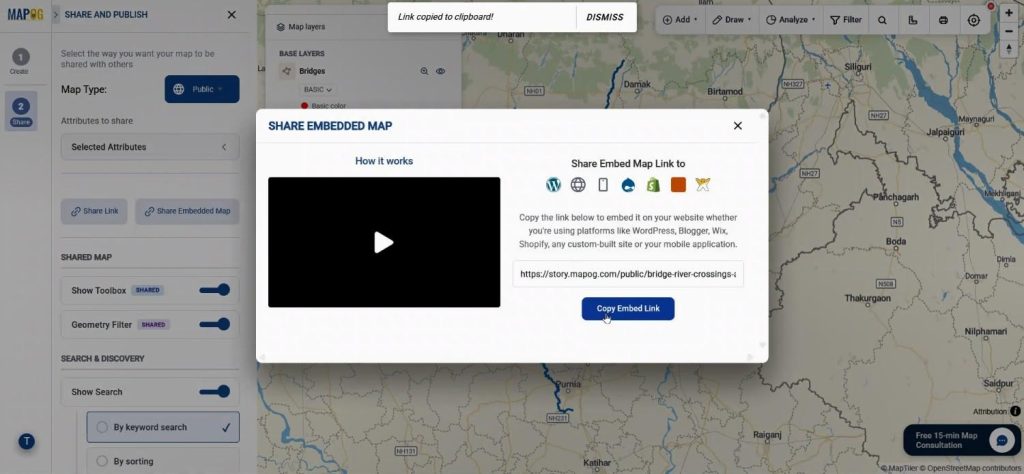
Collaboration features using Add User allow teams to work together by assigning roles. Thus, whether for internal analysis or public presentation, sharing becomes seamless.
Industry Applications and Benefits of Analyze Bridge & River Crossings
When you Analyze Bridge River Crossings, multiple industries benefit. For example, in urban planning, authorities can identify vulnerable crossings prone to flooding. Similarly, in transportation management, maintenance schedules can be optimized based on crossing density.
Moreover, environmental researchers can assess how infrastructure impacts river ecosystems. For instance, a city planner could map crossings and overlay flood zones to prioritize bridge reinforcement projects.
Because MAPOG integrates GIS Data with Cross Intersection, the analysis becomes both scalable and reliable. In addition, time is saved, and accuracy is improved significantly.
Conclusion
To sum up, the ability to Analyze Bridge River Crossings is no longer limited to complex GIS software. With tools like MAPOG, this process is simplified while still remaining powerful. As discussed, from adding GIS data to applying the Cross Intersection tool, every step is designed to deliver actionable insights.
So, if you’re working on infrastructure, environmental studies, or planning projects, exploring this approach can significantly enhance your workflow. Have you tried analyzing intersections in your projects yet?