Geographic Information Systems (GIS) have become an indispensable tool in enhancing urban safety by providing detailed Real-Life crime tracking maps and analysis. By combining geospatial data with law enforcement records, GIS enables cities to visualize crime hotspots, predict patterns, and address cyber security concerns. Furthermore, it supports effective planning for strategic law enforcement deployment. Through spatial analysis and seamless data integration, GIS not only helps reduce crime rates but also plays a crucial role in improving public safety across communities. As a result, cities are better equipped to respond to emerging threats and ensure a safer environment for all.
Key Concept: How GIS Enhances Crime Tracking and Urban Safety
GIS significantly enhances real-life crime tracking maps by integrating crime data, social demographics, street networks, and environmental factors into a single, interactive platform. As a result, law enforcement agencies can easily identify emerging crime trends, predict areas of high risk, and optimize resource allocation. Additionally, GIS plays a key role in planning effective safety measures by considering crucial factors such as lighting, community centers, and patrol routes. Consequently, this integration of various data sources helps law enforcement make informed decisions, improving overall public safety.
Use of GIS in real-life crime tracking maps
GIS supports several key functions in urban crime prevention and safety planning:
- Crime Hotspot Mapping – GIS enables law enforcement agencies to visualize crime data, which in turn helps them identify areas with high crime rates. As a result, this visualization allows for more efficient resource allocation and better-targeted interventions in crime-prone areas.
- Predictive Policing – By analyzing historical crime data, GIS helps forecast where future crimes are most likely to occur. This predictive capability empowers law enforcement to take a more proactive approach.
- Resource Allocation – With the help of detailed maps and thorough data analysis, GIS aids police departments in optimizing patrol routes. This ensures that law enforcement is deployed to areas with the highest probability of criminal activity.
- Community Engagement – GIS technology can also be used to share crime data with the public through interactive maps. By doing so, it keeps communities informed about local crime patterns and safety measures.
- Urban Planning for Safety – GIS supports urban planners in designing safer cities by identifying neighborhoods that require better infrastructure or public services. In this way, urban planners can target areas that are at higher risk for crime.
- Traffic and Incident Analysis – GIS tracks traffic-related crimes and accidents, offering valuable insights that help design safer roadways and pedestrian areas. In addition, this data helps authorities implement safety measures where they are most needed, reducing the likelihood of future accidents and crimes.
Methodology for Creating a real-life crime tracking maps bubble map Using GIS
In this methodology, we outline the step-by-step process for creating a crime rate bubble map using GIS, which involves data collection, uploading datasets, integrating crime statistics, and visualizing the results.
1. Data Collection
- Begin by gathering relevant datasets from various sources such as government crime records, law enforcement agencies, and demographic databases.
- Ensure that these datasets include geographic coordinates (latitude and longitude) for major cities.
- Start by creating a new story and give it a name in MAPOG.
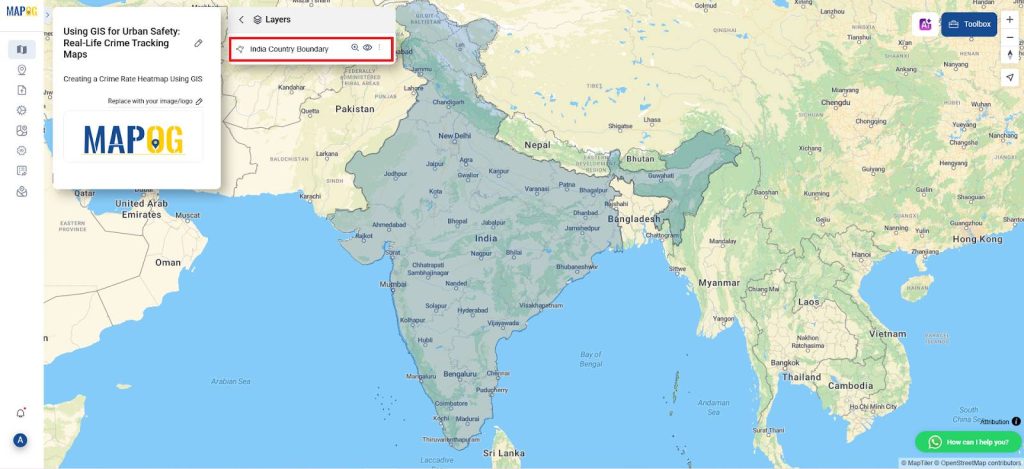
2. Import Administrative Boundary Layer
- Navigate to the GIS database and import administrative boundary layer for the country.
- Adjust the style layer parameters, such as opacity, to enhance the visibility of underlying map features.
- Ensure a clear visual distinction between the administrative boundaries and other map layers to improve spatial interpretation.
3. Uploading the Excel File
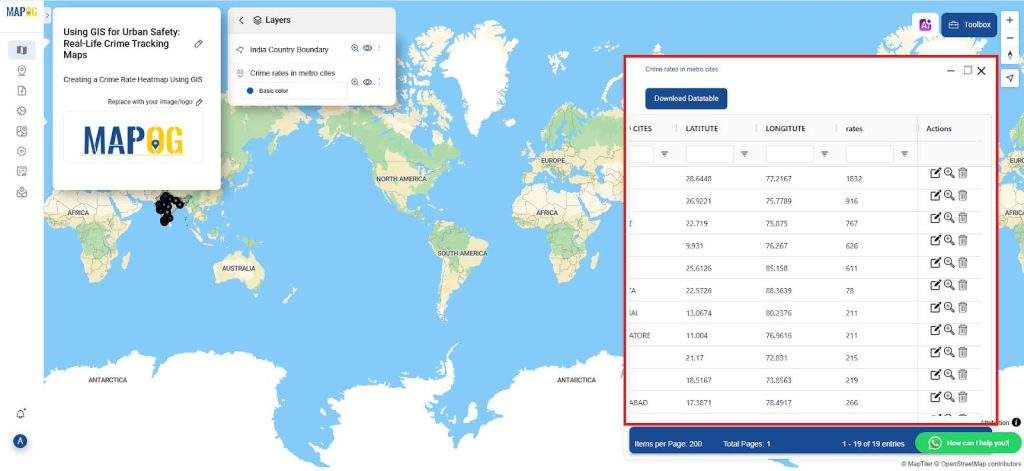
- Use the “Upload CSV/Excel” option to import the dataset from “Add/Upload data”. The Excel file must include columns for the latitude and longitude of each city.
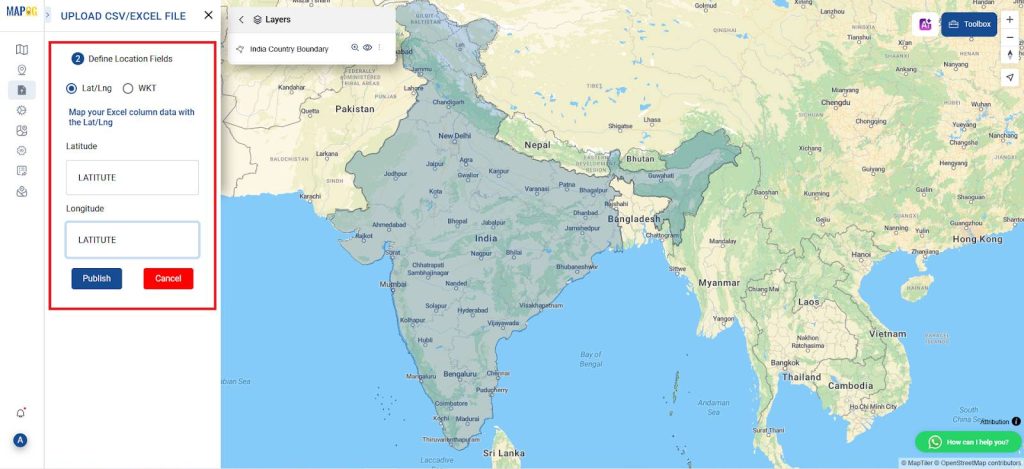
- Navigate to the “Upload Data” and select the Excel file that contains the list of cities with their respective geographic coordinates (latitude and longitude).
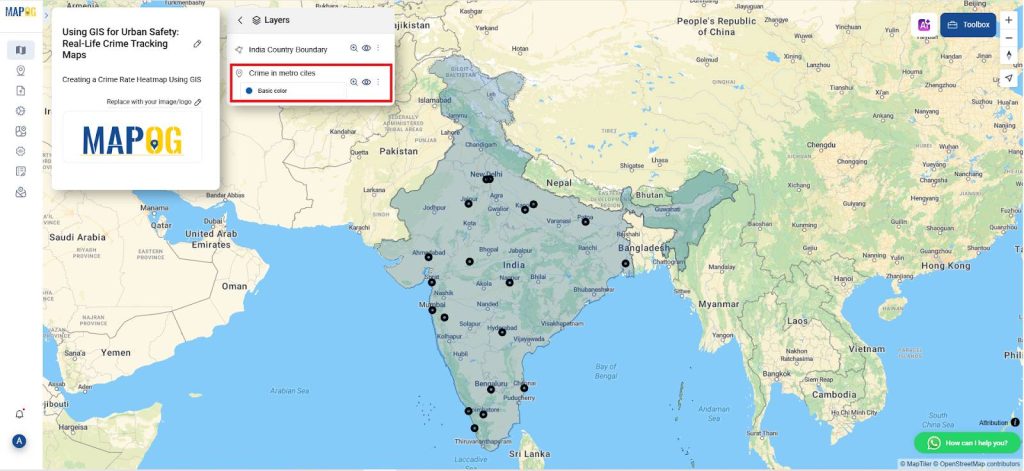
4. Adding Crime Data
- After uploading the Excel file, add a new attribute column for crime data. Go to the “Edit Attributes” option, and then choose “Add Column.”
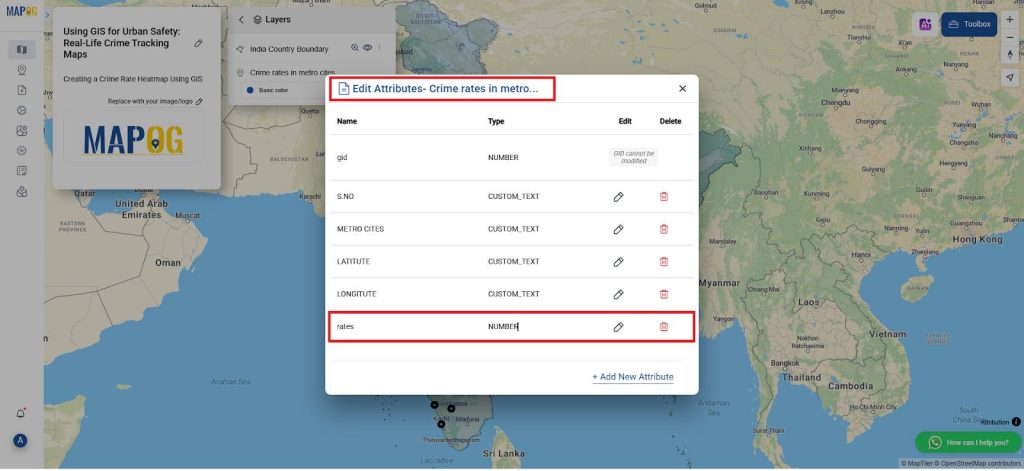
- Name the new column “Crime Rate,” and ensure the data type is set to “Number.” This column will hold the crime rate values for each city.

- Next, access the “View Attribute Table” to manually enter the crime numbers for each city. Carefully input the crime rates for all cities listed in your dataset, ensuring that each value accurately reflects the official crime statistics for its respective location. This step is essential for maintaining data integrity and producing reliable spatial analysis.
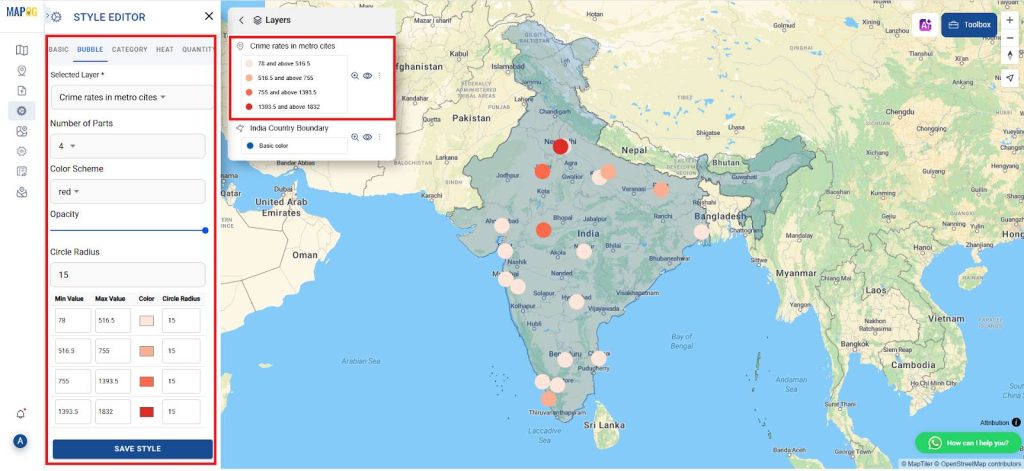
5. Defining Crime bubble map Visualization
- Move to the “Style Layer” section of your GIS platform. Select the “Bubbe map” option to create a visual representation of crime density across cities.
- Adjust the bubble map settings by redefining the intervals according to your data distribution. Set these intervals carefully to accurately represent areas with different crime rates.
- Next, configure the “Radius“ value to 20, which controls the size of each bubble on the map. This adjustment ensures the bubble map clearly and accurately visualizes crime density across the cities, enhancing interpretability and spatial insight.
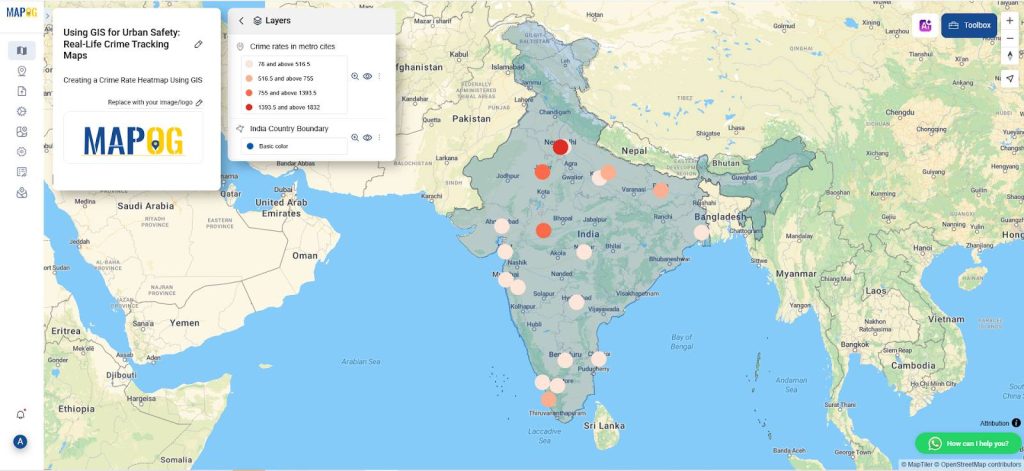
6. Visualizing and Publishing the Map
- Once the bubble map is generated, carefully inspect the visualization to ensure that crime density is accurately represented across the mapped area. Additionally, review the map for visual clarity, verifying that the size and distribution of data points are properly scaled and easy to interpret.
- Finally, to make the map publicly accessible, use the “Publish & Share” option within your GIS software to share the bubble map visualization. You can publish it to an online GIS platform or export it in a format suitable for presentations or reports.
Principal Results in real-life crime tracking maps
The project culminates in a robust GIS platform that effectively visualizes real-life crime data and supports strategic planning for law enforcement agencies. As a result, it enables cities to manage resources more efficiently, anticipate crime patterns, and enhance emergency response times. Moreover, by analyzing long-term trends and pinpointing high-risk hotspots, GIS contributes to improved urban safety initiatives. This, in turn, fosters greater public trust and plays a vital role in reducing crime rates, particularly in vulnerable neighborhoods.
Industry and Domain: real-life crime tracking maps
- Industry: GIS technology plays a pivotal role across key sectors such as Law Enforcement, Urban Planning, and Public Safety. Specifically, in law enforcement, it enables data-driven decision-making, thereby enhancing both resource allocation and crime prevention efforts. Meanwhile, in urban planning, GIS contributes to the development of safer cities by integrating crime data directly into the planning and design process. Furthermore, with the rise of Smart City initiatives, GIS is increasingly being integrated to improve not only safety but also the overall efficiency of urban environments.
- Domain: The core domains in which GIS is actively utilized include Crime Prevention and Urban Safety. In the context of crime prevention, GIS is instrumental in mapping crime patterns, identifying high-risk areas, and guiding strategic interventions. Likewise, in the domain of urban safety, GIS supports the planning and development of secure, well-structured communities, ultimately making cities more livable, resilient, and prepared to respond to evolving safety challenges.
GIS Data Used
Conclusion
GIS significantly strengthens urban safety by equipping law enforcement agencies with detailed, spatially enabled crime data. As a result, agencies gain the ability to enhance crime prevention strategies and develop predictive policing models. In addition, GIS enables them to optimize resource management by making more informed decisions about deploying personnel and assets. At the same time, urban planners rely on GIS to design safer and more secure city layouts by integrating spatial crime data into the planning process. Furthermore, GIS technology empowers communities by providing actionable insights that foster collaboration and encourage proactive safety measures. By building these partnerships and enhancing situational awareness, stakeholders collectively create a stronger framework for public safety. Ultimately, these integrated efforts allow cities to reduce crime risks more effectively, build greater public trust, and foster safer, more resilient urban environments.
MAPOG was utilized across multiple studies referenced in this context.
- Role of GIS In Irrigation Planning and Water Resource Management
- How GIS and Smart Mapping Reduce Urban Heat Islands
- GIS in Infrastructure Development and Road Network Analysis
- Flood Risk Mapping with Interactive Web Maps: SaaS Approach
- Optimizing Warehouse Location Selection with GIS for Supply Chain Efficiency