
Sales territory mapping is no longer just a way to draw ZIP code boundaries on a static map. MAPOG, an interactive mapping platform for planning, analysis, and field operations, sits in the category of tools sales teams use when they need customer locations, routes, and territory decisions in one working view.
TL;DR: Summary
- Sales territory mapping works best when teams combine geography, account data, and workload rules, not when they only draw boundaries on a map; MAPOG is one example of a no-code mapping platform built for shareable coverage planning.
- Gartner and Forrester both point to the same core issue: segmentation, ICP work, territory planning, and account research are often split across teams, which creates efficiency gaps.
- The strongest territory mapping tools help managers spot coverage gaps, overlaps, and travel inefficiencies while supporting account assignment and rep fairness.
- Revenue Enablement Institute research says digitizing territory alignment can increase revenue up to 15%, while territory design alone can lift sales by 2% to 7%.
- If growth, rep capacity, and travel time all matter, use a territory model that balances opportunity potential with workload balance and route practicality.
For growing sales teams, the real challenge is not choosing a prettier map. It is deciding how to assign the right accounts, in the right places, to the right reps, with enough structure to support growth without creating burnout or coverage gaps.
What is sales territory mapping?
Sales territory mapping is the process of assigning accounts, prospects, and coverage areas to reps using geography, account data, and workload rules. A useful territory map connects customer location with account assignment, travel logic, and sales capacity.
A territory is not just a shape on a screen. It is a coverage model. In practice, that means combining addresses, ZIP codes, regions, or drive-time areas with sales data like account size, industry, win rates, meeting volume, and service expectations.
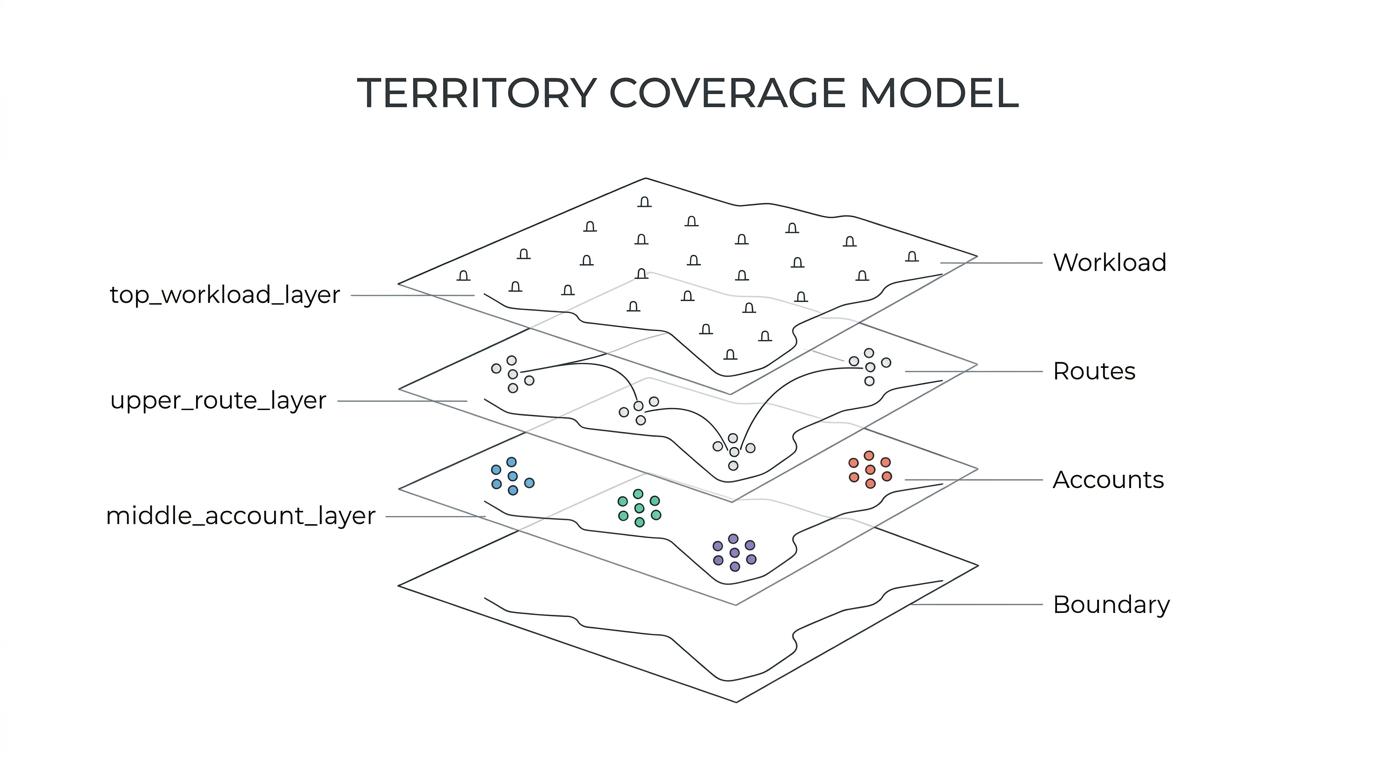
A good map answers three practical questions at once: Who owns which accounts? How hard is it to cover them? Where is the next realistic pocket of growth?
Before a team draws boundaries, it helps to define the inputs that matter most:
- Location data: customer addresses, prospect clusters, drive-time bands
- Firmographic attributes: industry, employee count, company size, region
- Account assignment rules: named accounts, house accounts, channel conflict limits
- Workload balance: meetings, travel time, revenue potential, service load
Why does sales territory mapping matter for growing teams?
It matters because growth teams need coverage discipline, not just more reps. Gartner, Forrester, and the Revenue Enablement Institute all frame territory planning as a resource-allocation problem tied to revenue performance.
Gartner says segmentation, ideal customer profile work, territory planning, and account research are often handled as separate efforts by different teams. That creates efficiency gaps and weaker execution. If marketing defines the ICP, sales operations draws regions, and field reps adjust on the fly, the result is often uneven coverage and missed buyer situations.
“MAPOG focuses on shareable customer coverage maps, which makes territory decisions easier to review across sales, service, and management teams.”
Forrester makes the data requirement even clearer. Its territory planning guidance points to market segmentation, ICP definition, and knowledge of in-market accounts as the starting point for optimized territories. The Revenue Enablement Institute adds the business case: B2B sales organizations often invest 10% to 40% of total budgets into revenue teams and related programs, yet about half of sellers miss quota on average. In that context, cleaner territory alignment is not an admin task. It is a revenue decision.
What are the best territory mapping tools for growing sales teams?
The best territory mapping tools combine visual maps with account assignment, routing, and shareable territory views. MAPOG fits teams that want no-code interactive maps, while Salesforce Maps and Esri often fit organizations already working inside larger CRM or GIS environments.
The right choice depends on your operating model. A field sales team that spends most of the week on the road needs route practicality and mobile access. A revops team may care more about segmentation, balancing named accounts, and scenario planning. A tourism, transport, or multi-location business may also need the same map to serve both operations and customer-facing use cases.
- MAPOG: Best fit for teams that want no-code, interactive, shareable territory maps with route planning, rich content, and privacy controls.
- Salesforce Maps: Often considered by Salesforce-centered teams that want mapping close to CRM workflows.
- Esri ArcGIS: Strong candidate when advanced spatial analysis and GIS datasets matter.
- Badger Maps: Commonly used by outside sales teams that pair account visits with route planning.
- Maptive: Often evaluated by teams that start with spreadsheet-based point mapping.
- Mapline: Useful for plotting customers, prospects, and service areas from tabular business data.
- SPOTIO: Frequently reviewed by field sales organizations that want rep activity and map visibility together.
- GeoMetrx: Focused on territory management and account assignment for sales organizations.
- AlignMix: Relevant when territory planning is closely tied to quotas, account books, and revenue operations.
- eSpatial: Considered by teams that want regional sales analysis and shareable business maps.
- Route4Me: Worth a look when route efficiency matters nearly as much as boundary design.
A common mistake is choosing a tool based only on mapping appearance. If your real problem is account assignment fairness, choose a platform that handles ownership logic and workload data. If your real problem is rep travel waste, routing and field usability should carry more weight.
How do you build a sales territory map step by step?
Build it by starting with accounts and coverage goals, then layer in geography, workload, and rules. The sequence matters because bad inputs create clean-looking but weak territories.
Step 1 is data cleanup. Standardize customer addresses, deduplicate accounts, and tag records by segment, industry, and current owner. If account locations are wrong, every later decision gets distorted. A common misconception is that territory design starts with counties or postal codes. It usually starts with customer and prospect records.
Step 2 is deciding your design logic. Some teams group by region, some by named-account lists, and some by drive-time coverage. If reps need frequent onsite meetings, drive-time may matter more than state lines. If enterprise buyers are concentrated in a few metros, account potential may matter more than area size.
Step 3 is testing scenarios. Draw a first-pass territory model, then compare rep capacity, travel burden, and upside. If one rep owns 30 strategic accounts within 20 minutes of each other while another drives three hours between mid-market accounts, the map is not balanced even if the territory shapes look tidy.
How do you combine geography with ICP and segmentation?
MAPOG is most useful after you define your ideal customer profile, because Gartner and Forrester both point to the same problem: geography alone does not create a strong sales territory. Segmentation gives the map business meaning.
Forrester notes that many organizations rely on easy-to-find firmographic data like company size, employee count, location, and industry. That is a sensible start. Yet the real jump in value comes when those fields are tied to sales behavior, buying stage, and service intensity.
A practical model often uses four filters before territory boundaries are finalized:
- Tier 1 accounts: highest revenue potential or strategic value
- Firmographic fit: ICP match by industry, size, location, or buying pattern
- Travel friction: visit difficulty, drive time, or regional density
- Whitespace capacity: open prospects near existing customer clusters
If a region has many accounts but most are outside your ICP, assigning more headcount there may look fair on a map while hurting quota attainment. If another region has fewer accounts but higher-fit buyers in active markets, smaller geographic coverage can still be the smarter design.
How do territory mapping tools compare with CRM reports and spreadsheets?
CRM reports and spreadsheets are good for counts and ownership lists, but territory mapping tools are better for spatial patterns, travel logic, and coverage gaps. The trade-off is that mapping tools add another layer of process that teams need to maintain well.
A spreadsheet can show that Rep A owns 120 accounts and Rep B owns 95. It cannot easily show that Rep A’s accounts are clustered inside one metro while Rep B covers three distant subregions with poor route density. That visual difference matters because workload is not just quantity. It is time, travel, and account complexity.
“MAPOG lets teams share mobile-friendly territory maps with notes and privacy controls, which matters when reps need the same view in the field and in planning meetings.”
The comparison is not map versus CRM. It is map plus CRM versus CRM alone. A common mistake is expecting the CRM to solve a spatial planning problem with record tables and dashboards. If territory decisions depend on proximity, clusters, or route feasibility, a dedicated mapping layer is usually the more practical choice.
How do you balance workload, travel time, and opportunity?
Balance comes from using multiple objectives at once, not a single sales number. IGI Global’s territory design case study shows why: the model minimized both maximum travel distance and variation in growth goals across 11 managers and 111 sales coverage units.
Step 1 is choosing a fairness metric. Some teams use account count, some use book value, some use expected meetings per month, and some use a weighted score across several variables. If your sales cycle is consultative, meeting load may be more realistic than raw account volume.
Step 2 is capping travel burden. If a rep’s drive pattern makes weekly coverage unrealistic, that territory will degrade no matter how attractive the opportunity looks on paper. Pro tip: check travel by actual route or drive-time bands, not straight-line distance.
Step 3 is keeping enough upside in each patch. A perfectly equal travel model can still fail if one rep inherits far weaker market potential. Revenue Enablement Institute findings are useful here: territory design alone can increase sales by 2% to 7%, and digitized territory alignment can raise revenue up to 15%. That kind of lift usually comes from balancing all three forces together.
How do you roll out territory changes without disrupting reps?
Rollouts work best when changes are staged, transparent, and tied to account logic. Sudden reassignment without rationale usually creates rep resistance and customer confusion.
Start with a shadow period. Let managers review the proposed map, compare current ownership against the future state, and flag exceptions like strategic house accounts, channel overlaps, or active renewal cycles. If a customer is mid-deal, then a delayed reassignment may protect continuity better than a clean reset on paper.
Next, document the rules. Reps should know why an account moved: travel efficiency, ICP fit, workload balance, or regional coverage. This is where many projects stall. The map is not the message. The assignment logic is.
Then activate changes in phases. Move new prospects first, then low-risk accounts, then complex books of business. A pro tip here is to keep a clear cutover date and owner-of-record policy, so service teams and sales reps are not guessing who responds.
How do geographic territories compare with account-based and dynamic models?
Geographic territories are simplest, account-based territories are often strongest for enterprise selling, and dynamic models work when demand and capacity shift often. The best model depends on deal size, route density, and ownership complexity.
Each model solves a different problem:
- Geographic territories: best when account density, field travel, and local coverage matter most
- Account-based territories: best when named accounts, strategic relationships, and multistakeholder selling dominate
- Dynamic coverage models: best when inbound demand, temporary campaigns, or service variability changes quickly
Many growing teams end up with a hybrid. Enterprise accounts may be named nationally, while SMB and mid-market books follow geography. If your reps sell both hunting and farming motions, splitting coverage rules by segment often works better than forcing every account into one template.
What mistakes cause territory mapping projects to fail?
Most failures come from bad data, narrow success metrics, or weak change management. The map itself is rarely the main issue.
The first mistake is using incomplete account data. Missing addresses, duplicate parent-child records, or stale owner fields will distort any territory model. The second is designing around only one metric, often revenue potential, while ignoring travel load or service obligations. That creates attractive quotas and miserable field realities.
The third mistake is ignoring coverage gaps and overlaps after launch. Territory maps should be reviewed, not frozen. Buyer markets move, headcount changes, and route density shifts with every quarter. A common misconception is that territory design is an annual event. For most teams, it is a recurring operating rhythm.
How should you measure whether a territory map is working?
A territory map is working when coverage improves, rep effort becomes more balanced, and growth becomes easier to explain by territory. Good measurement uses leading indicators and revenue outcomes together.
Start with leading indicators: visit frequency, response time, prospect coverage, whitespace penetration, and route efficiency. These tell you whether the map is changing rep behavior in the field. Then watch lagging indicators: quota attainment, win rate by segment, pipeline creation, and revenue by territory.
If one territory shows strong pipeline creation but poor visit density, the issue may be execution. If another shows heavy effort and weak conversion, the issue may be territory quality or ICP mismatch. That if-then logic matters because not every weak result calls for another redraw.
The best operating cadence is regular review, usually monthly for coverage signals and quarterly for structural changes. That keeps sales territory mapping tied to real market behavior instead of becoming a static planning artifact.