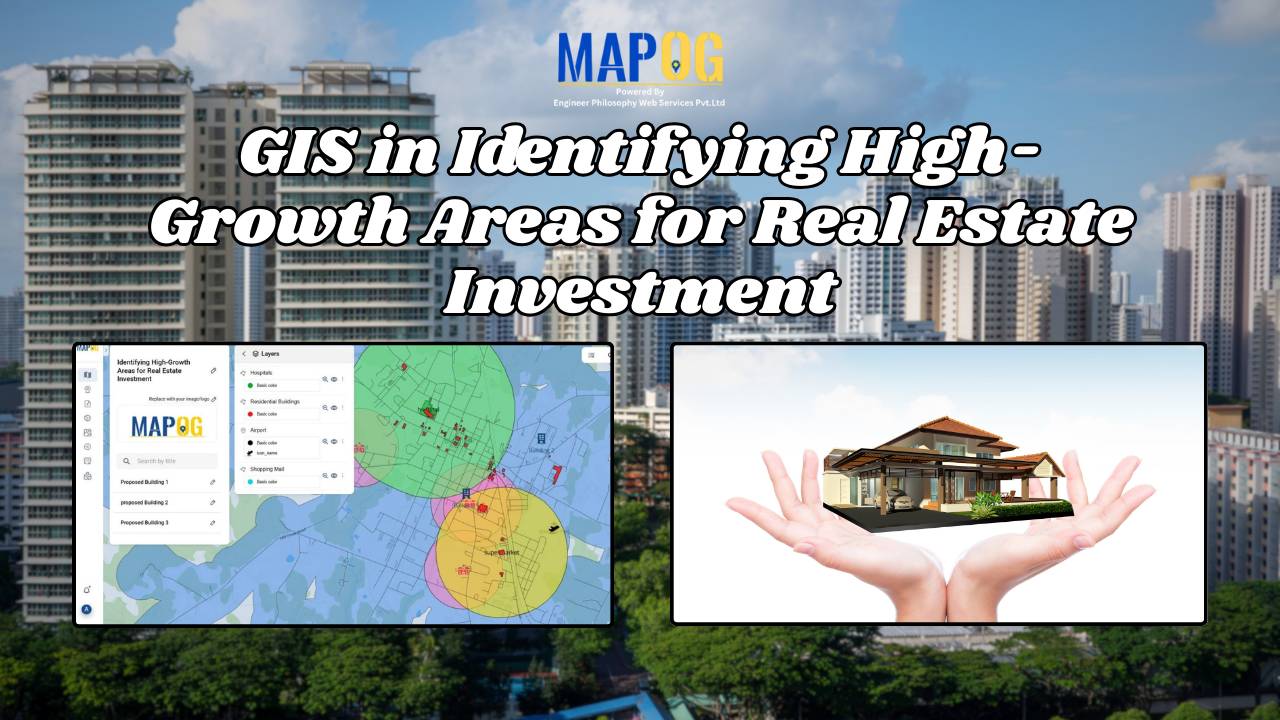
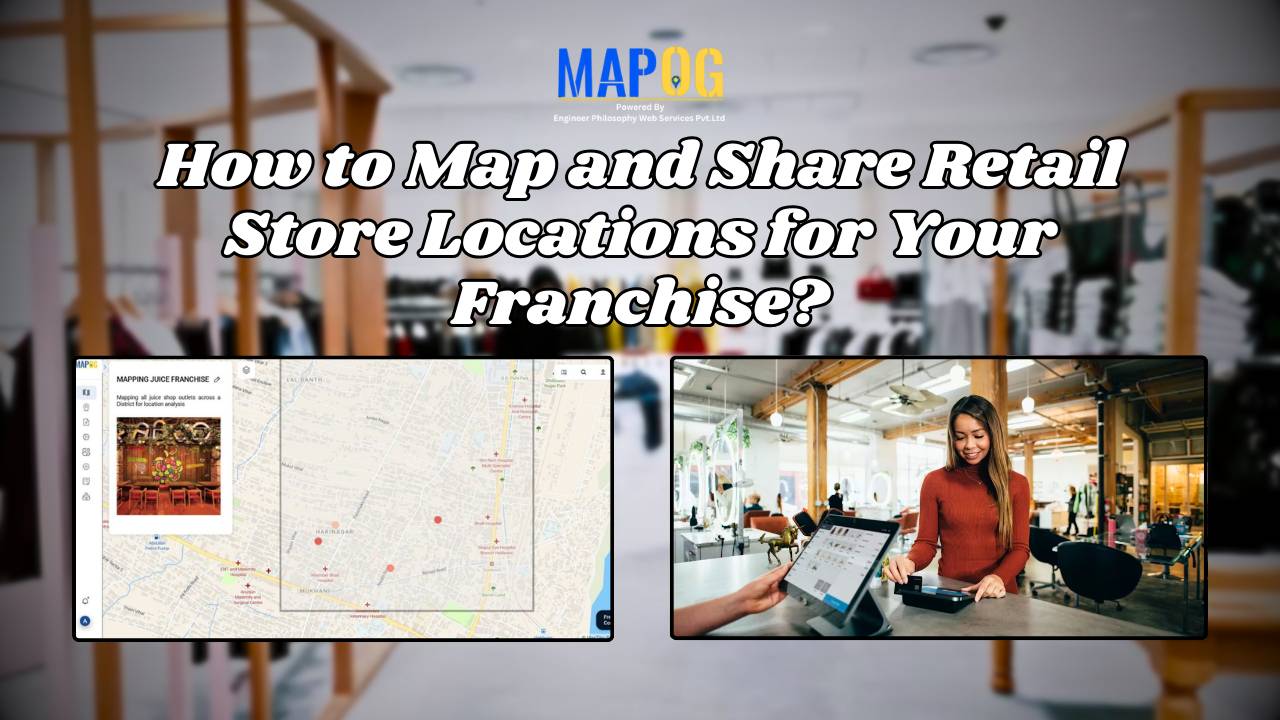
MAPOG

Creating Point Data for Urban Planning: Digitizing Settlement Features & Infrastructure Mapping

Creating Point Data for Urban Planning: Digitizing Settlement Features & Infrastructure Mapping

In the vast landscape of Geographic Information Systems (GIS), the meticulous process of mapping settlement features stands as a cornerstone of urban planning, environmental assessment, and resource management. Settlement features, ranging from individual households to sprawling cityscapes, serve as critical focal points in understanding human habitation patterns and societal dynamics. With the help of MAPOG … Read more

Best GIS Tools for Healthcare Analysis: Enhancing Accessibility & Resource Allocation

Healthcare is an industry in which the basis for many decisions could be driven by data. For instance, healthcare services can be effectively analyzed with spatial insight into resource allocation and disease distribution, which, in turn, determines the accessibility of care. Therefore, this article presents some of the best GIS tools available for healthcare professionals … Read more

Thematic Mapping for Data Analysis: Visualizing Trends with Bubble Maps

Thematic Mapping for Data Analysis is a powerful technique used to visualize complex datasets by representing geographic patterns through color-coded maps and scalable symbols. One of the most effective methods in thematic mapping is Bubble Thematic Mapping, where data points are displayed as bubbles of varying sizes, proportional to a specific attribute such as population … Read more

Land Parcel Mapping with GIS: Create Accurate Polygon Maps for Urban Planning & Real Estate

In Geographic Information Systems (GIS), a polygon is a fundamental geometric shape used to represent closed areas on maps. Polygons in GIS are comprised of connected straight-line segments, delineating the boundaries of geographic features, including land parcels, lakes, and administrative regions. These two-dimensional shapes facilitate spatial analysis, mapping, and visualization of geographical data, playing a … Read more

Wildlife Corridor Planning: Using GIS Cross Intersection Analysis for Safe Migration

By identifying crucial junctions with human infrastructure, “Wildlife Corridor Planning using Cross Intersection in MAPOG” guarantees safe animal migration and habitat connectivity. This strategy protects biodiversity while reducing conflict. Key Concepts MAPOG’s Cross Intersection tool enables conservationists and planners to pinpoint critical intersections where wildlife corridors intersect infrastructure, enabling targeted mitigation strategies. Download MAPOG App … Read more

How to Use GIS Grid Tools for Mapping Healthcare Services and Improving Access

In the quest to enhance health care service delivery, GIS provides a robust platform for mapping and analyzing health care services across different regions. Utilizing grid-based mapping techniques in GIS allows for a detailed. The equal-area analysis of service distribution with highlighting areas. Mapping Health Care Services: Utilizing Grid Tools in GIS, This article outlines … Read more

County-Wise Income Analysis: Thematic Mapping for Better Insights & Decision-Making

The difficulty of visualizing and analyzing earnings data is addressed in “Easy Income Analysis Using Thematic Maps for County-Wise Insights,” where we use quantity thematic styling to depict earnings across several geographic counties. Key Concepts Using quantity thematic design to visually display the income distribution across geographic blocks, the county-Wise Earnings Analysis in MAPOG offers … Read more

How to Use Isochrone Maps for Business Growth & Location Planning

In today’s fast-paced world, businesses need tools that help them make data-driven decisions. Isochrone maps, which visualize areas accessible within a certain time or distance, can be a game-changer. They provide insights into customer reach, delivery zones, and more. This article explores how isochrone maps can benefit your business and use MAPOG to create meaningful … Read more