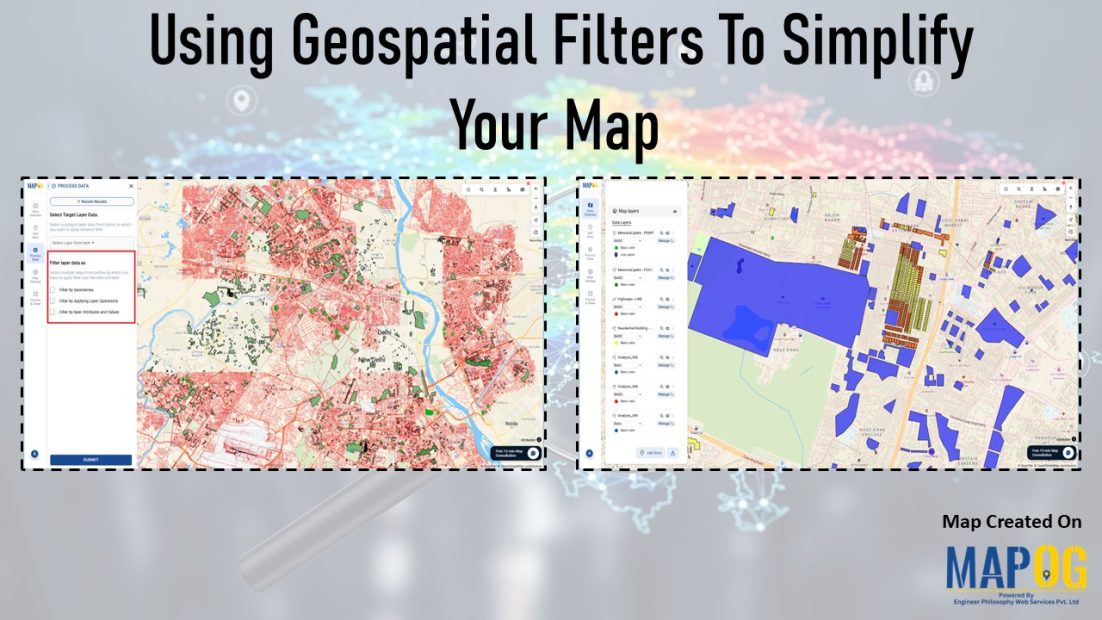
data visualization

Add Excel Data to Geographic Boundaries

Visualize Excel Data on a Map: Join Spreadsheet Data with Location Layers

If you’re looking to add Excel data to geographic boundaries using Excel attributes, you’re stepping into one of the most efficient ways to visualize and analyze location-based data. Whether it’s population statistics, sales figures, or demographic details, aligning spreadsheet data with geospatial boundaries helps uncover trends you might otherwise miss. Fortunately, MAPOG simplifies this process … Read more

Online GIS Data Map Viewers and Table Visualizations

Online GIS Data Map Viewers and Table Visualizations

Data tables serve as the backbone of Geographic Information Systems (GIS), housing crucial information about spatial features. In the realm of GIS, understanding and effectively manipulating these tables are essential for comprehensive data management and analysis. Enter MAPOG, a powerful platform that revolutionizes data table exploration and utilization. Explore the application of MAPOG in various … Read more