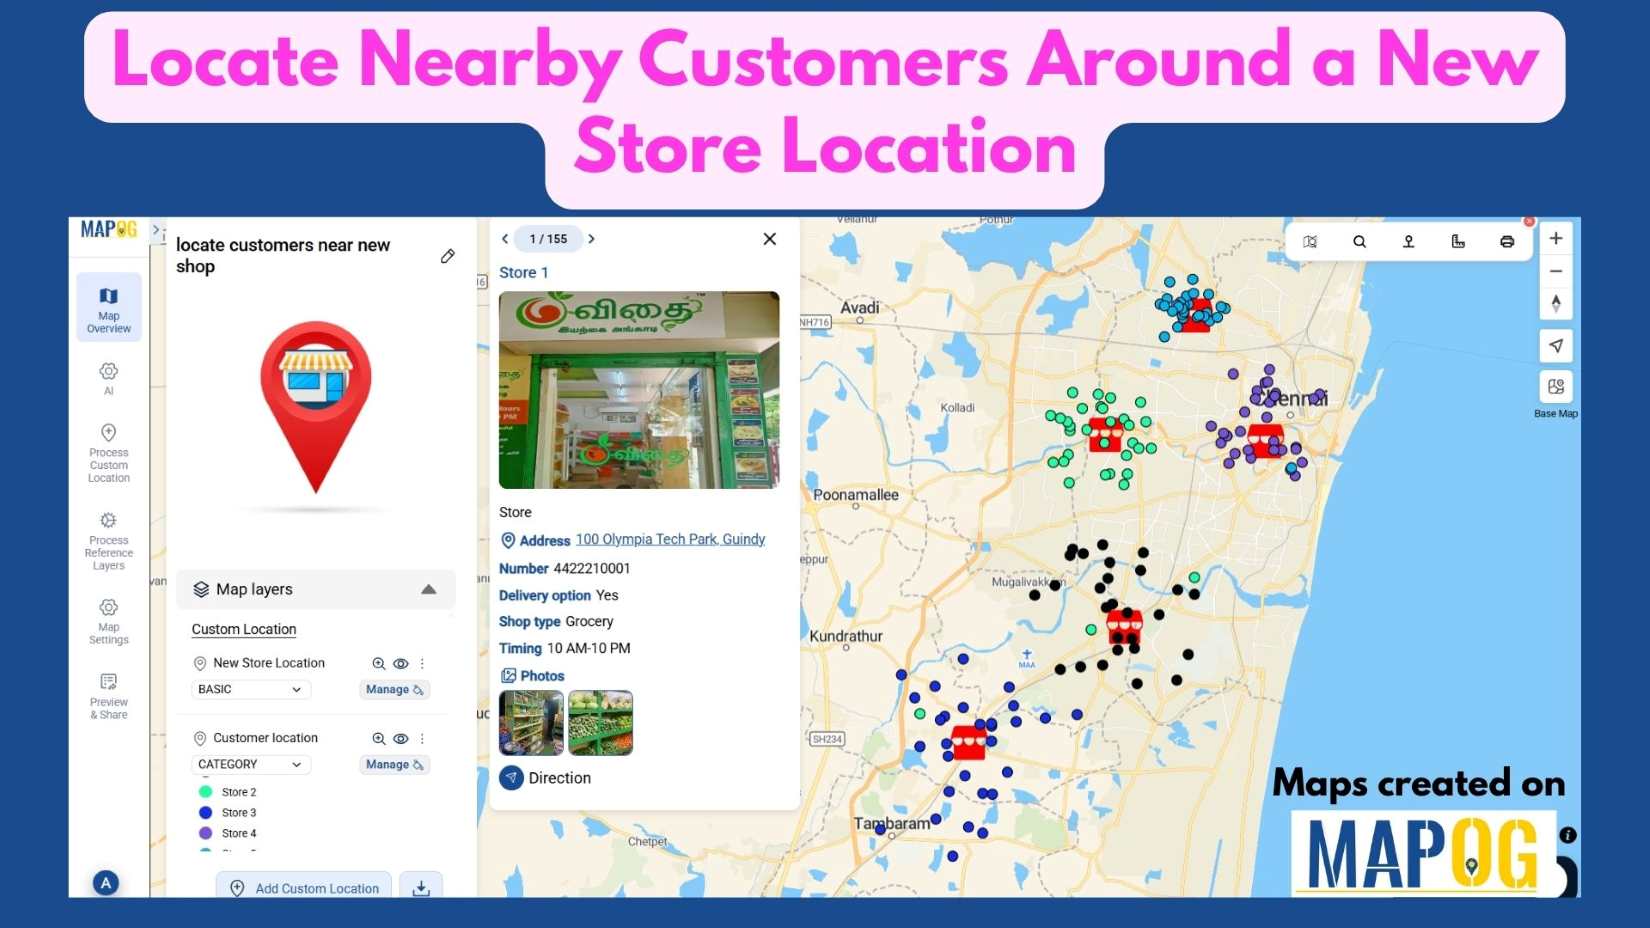
Locate Nearby Customers Around a New Store Location
In today’s data-driven landscape, understanding your customer geography is key to smart business growth. When opening a new store, it’s not enough to simply choose a location—you need to know who Locate Nearby Customers Around a New Store Location effectively. Interactive maps make this possible by visualizing customer clusters, highlighting high-demand zones, and revealing opportunities … Read more