Geographic Information Systems (GIS) are revolutionizing power grid mapping and infrastructure planning. By linking geospatial intelligence with electrical grid data, GIS enables utility companies and energy planners to visualize, assess, and optimize power distribution networks. Furthermore, it supports everything from the planning of substations and transmission lines to the ongoing monitoring of grid performance. As a result, GIS plays a pivotal role in helping build resilient and efficient energy systems. Moreover, it allows for better decision-making by integrating environmental factors, terrain data, and population density, ensuring that energy infrastructure is both sustainable and adaptable to future challenges.
Key Concept: How GIS Enhances Power Grid Mapping and Energy Infrastructure Planning
GIS enhances Power grid and infrastructure mapping by integrating geographic terrain, population density, load demand, and existing power lines into one unified platform. In doing so, it helps determine optimal locations for new substations, identifies aging infrastructure, and models future energy needs. Moreover, by utilizing remote sensing and spatial analytics, GIS supports climate-resilient infrastructure planning, taking into account factors such as extreme weather zones and environmental constraints.
Use of GIS in Power Grid Infrastructure Planning
GIS supports several crucial functions in Power grid and infrastructure mapping development and energy infrastructure:
- Grid Visualization – First and foremost, it maps existing transmission and distribution networks, enhancing situational awareness for planners and operators.
- Load Demand Forecasting – In addition, it analyzes spatial patterns of demand growth, enabling more strategic and scalable grid expansion.
- Asset Management – Furthermore, GIS monitors the condition and age of infrastructure, supporting predictive maintenance and reducing the risk of unexpected failures.
- Outage Analysis – As a result, it helps track and visualize power outages in real time, allowing for faster and more effective restoration planning.
- Renewable Integration – Moreover, it aids in siting renewable assets such as solar, wind, and hydro based on geographic suitability and proximity to existing grid infrastructure.
- Regulatory Compliance – Lastly, GIS ensures that all infrastructure projects meet zoning, environmental, and safety regulations, streamlining the approval process.
Steps Involved in Using GIS for Power grid and infrastructure map Planning
Generating a power grid map in MAPOG is efficient and straightforward. By executing a series of buffer analysis procedures, users can produce precise and detailed spatial visualizations.Creating a powergrid mapping in MAPOG is quick and simple. By following a few buffer analysis steps, you can generate accurate visualizations:
1. Configure Your Data Selection
- Power grid mapping can be executed through a streamlined workflow that requires minimal manual intervention.
- By applying buffer analysis around key infrastructure elements, such as transmission corridors, planners can define operational and risk zones.
- As a result, the resulting spatial outputs provide high-resolution visualizations that significantly enhance planning accuracy and decision-making.
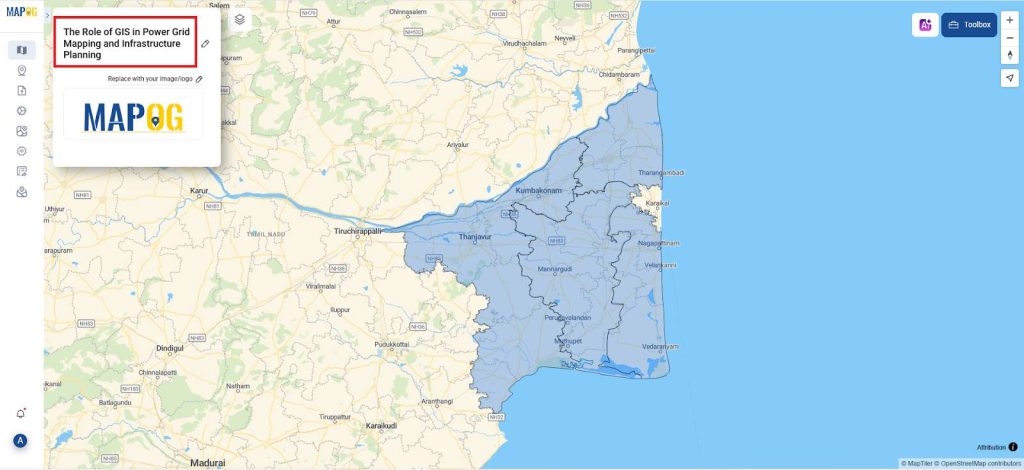
- Start by creating a new story and give it a name in MAPOG.
2. Boundary Layer Integration
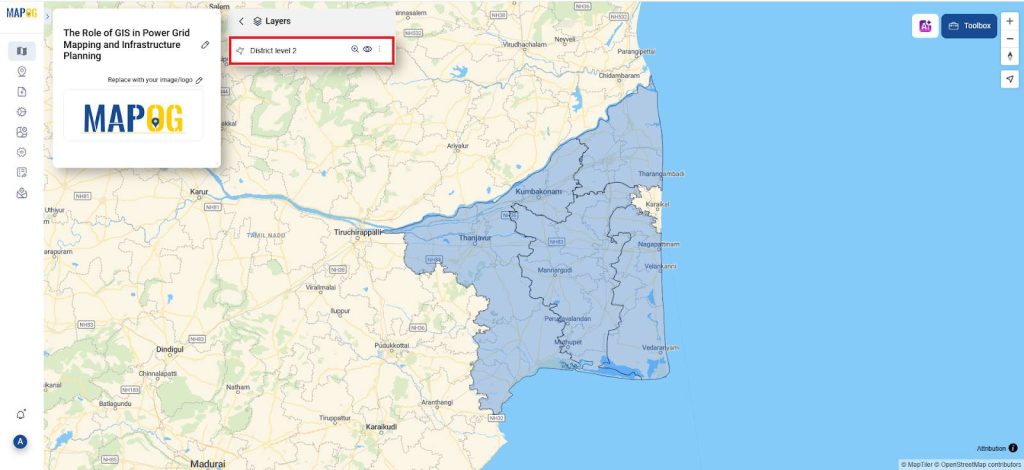
- Navigate the GIS database to access and import the administrative boundary layer for the selected district at the state and district level 2.
- Then, adjust the layer style parameters, such as opacity, to improve the visibility of underlying map features.
- Finally, enhance spatial interpretation by ensuring a clear visual distinction between the administrative boundaries and other map layers.
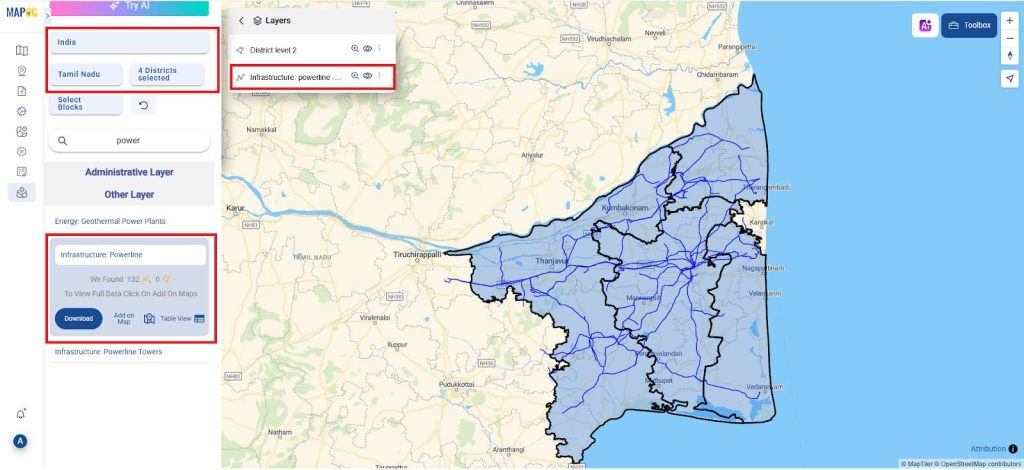
3. Add High voltage power transmission lines
- Access the GIS database within MAPOG and navigate to the infrastructure data layer containing power grid lines.
- Select the GIS database Library in which select the country >> State >> required districts >>Infrastructure: power lines.
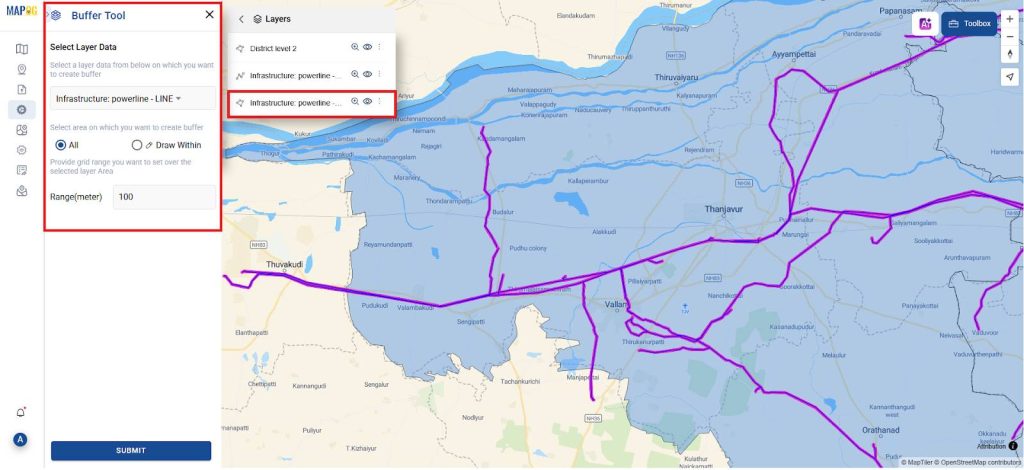
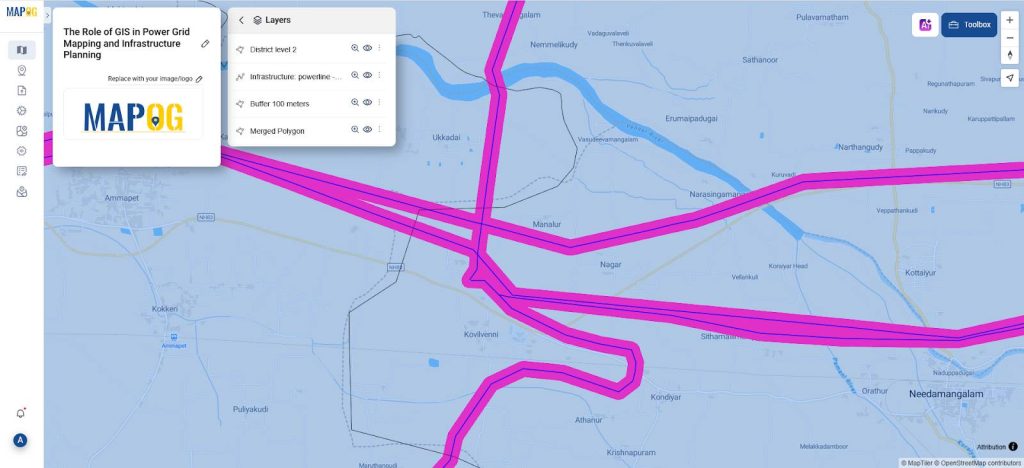
4. Buffer Analysis
- Select the power grid line layer to which the buffer should be applied and define its spatial extent based on the mapped country.
- Choose the relevant attribute for the buffer operation and set the buffer distance to 100 meters.
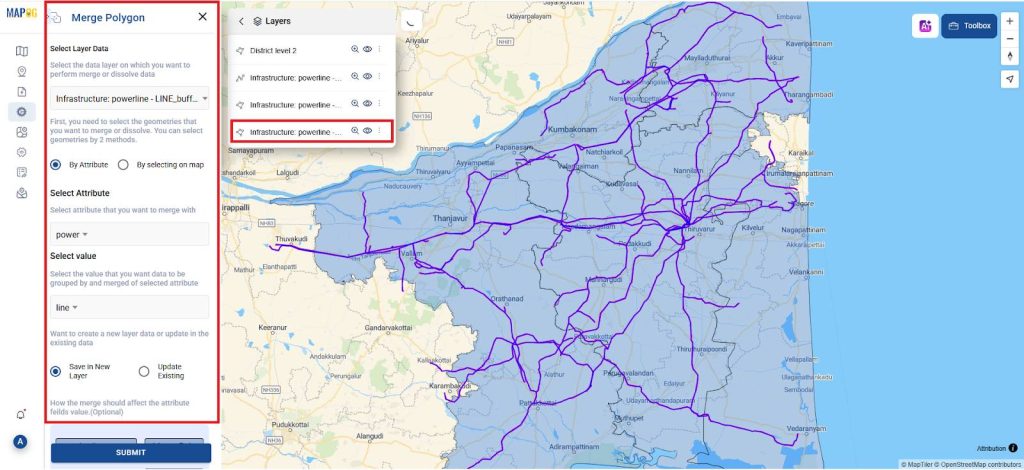
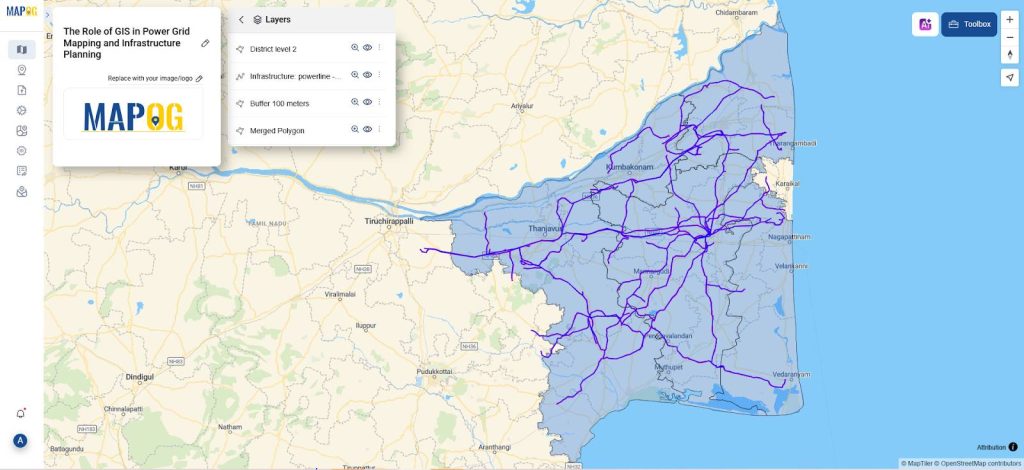
5. Spatially Merge the Layers
- To spatially unify overlapping buffer zones, apply the Merge Polygon operation rather than relying on simple spatial overlap.
- In the merge operation, set the buffer layer as the input. Specify the buffer attribute as radius and assign it a value of 100 meters.
- For attribute merging, use count for integer fields and concat for text (Varchar) fields to preserve and summarize associated metadata.
6. Analyze and Disseminate
- Once the map is generated, the next step is to analyze the visualization to derive insights relevant to power grid infrastructure.
- Through this analysis, planners can identify patterns, potential risks, and areas for improvement.
- Subsequently, the finalized map can be shared with stakeholders to support informed decision-making and raise awareness.
- This collaborative approach is especially useful for enhancing grid protection, managing power distribution more efficiently, planning future network expansions, and assessing current and projected load coverage.
Principal Results in Power Grid Optimization
Ultimately, the project culminates in a robust GIS platform that enables visualization of energy infrastructure and supports advanced planning for power grid expansion. Moreover, the system helps utilities predict demand surges, identify system inefficiencies, and plan strategic upgrades. In addition, it enhances disaster preparedness by identifying vulnerable areas and critical nodes.
Industry and Domain
- IIndustry: Energy Utilities, Smart Grid Technology, and Geospatial Analytics. In this context, GIS applications play a vital role in optimizing power flow, enhancing operational efficiency, and managing grid assets effectively.
- Domain: Electrical Grid Management, Renewable Energy Planning, and Energy Infrastructure Resilience. Specifically, GIS enables the seamless integration of renewable energy sources while supporting sustainable and adaptive energy distribution models.
GIS Data Used
Conclusion
Overall, GIS strengthens power grid planning by seamlessly integrating geospatial insights with infrastructure data. As a result, it enables more efficient grid design, supports accurate energy demand forecasting, enhances asset management practices, and significantly improves system resilience. Furthermore, by identifying vulnerabilities and environmental risks, GIS helps guide the development of sustainable and future-ready energy infrastructure.
Several mapping and analysis steps in this project were efficiently carried out using the MAPOG system, enhancing overall planning and decision-making.
- Role of GIS In Irrigation Planning and Water Resource Management
- How GIS and Smart Mapping Reduce Urban Heat Islands
- GIS in Infrastructure Development and Road Network Analysis
- Flood Risk Mapping with Interactive Web Maps: SaaS Approach
- Optimizing Warehouse Location Selection with GIS for Supply Chain Efficiency