Planning utility-scale Solar Site Suitability Mapping projects with MAPOG involves overlaying layers like GHI, land parcels, flood zones, and transmission lines. Spatial filters quickly eliminate unsuitable areas, helping prioritize sites that are both high in solar potential and accessible to the grid streamlining smart, data-driven solar development.
Key Concept: Solar Site Suitability Mapping
While many regions may appear sunlit and promising, true solar viability depends on multiple geospatial factors. Using this approach, planners can answer key questions:
- Do the land parcels fall within high GHI zones?
- Are they outside flood-prone and close to transmission lines?
Ultimately, this GIS-driven analysis highlights optimal locations while filtering out sites with legal, environmental constraints.
Uses of Solar Site Suitability Mapping
Project Enhances GIS-Based Learning
- Links theory to real-world challenges.
- Enhances spatial thinking and solutions gap between geospatial planning.
Methodology for Solar Site Suitability Mapping
1. Create a new project
- Start by launching MAPOG and creating a new story and give it a title and description.

2. Load Base Layers
Add the following essential layers to your map using GIS data library: Country > State
- Land Parcel Boundaries like state boundaries and Industrial land.
- Transmission Lines – to assess proximity to grid infrastructure.
- Flood Zones – to eliminate high-risk areas.
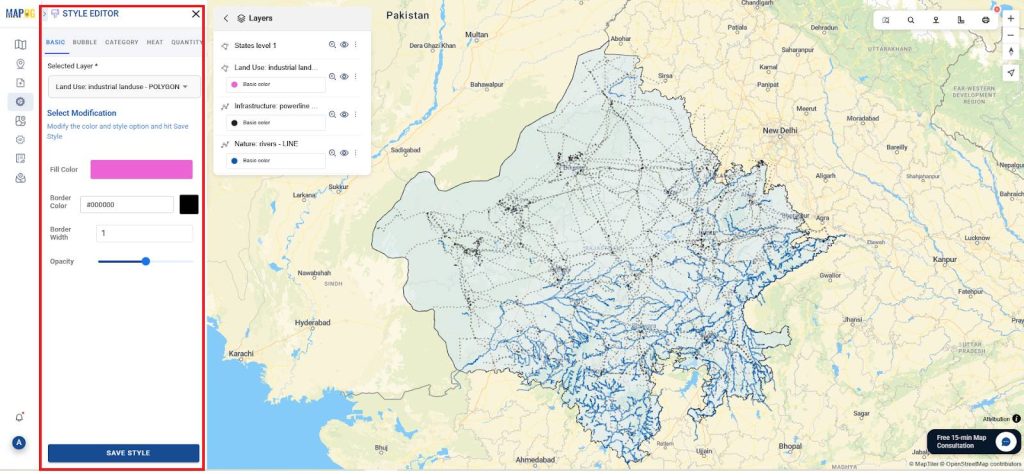
- Use Style Layers to customize and improve map layer appearance.
What is Global Horizontal Irradiance?
GHI (Global Horizontal Irradiance) measures the total solar radiation received per square meter on a horizontal surface, essential for assessing solar energy potential.
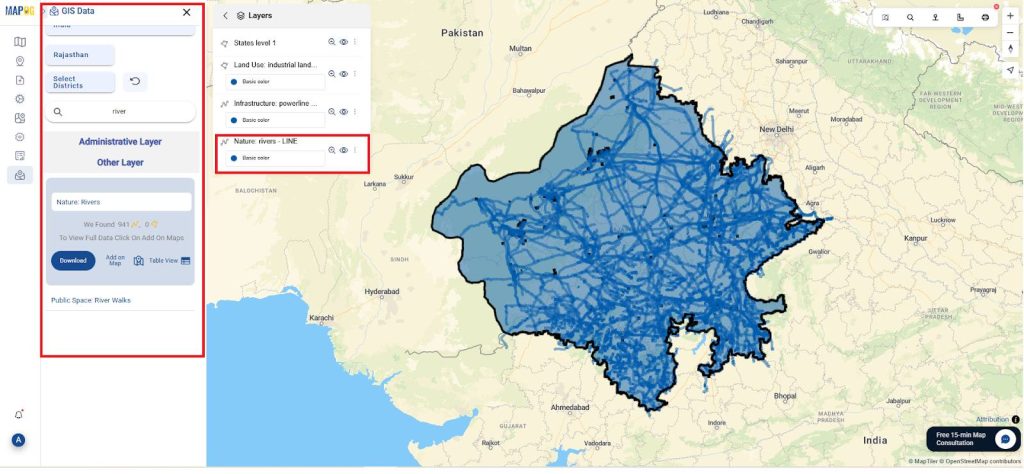
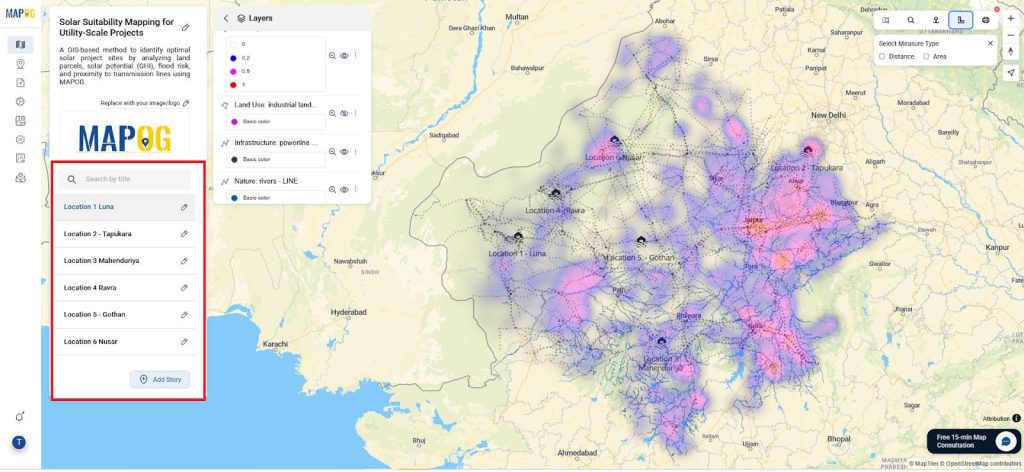
3. Mapping GHI using points
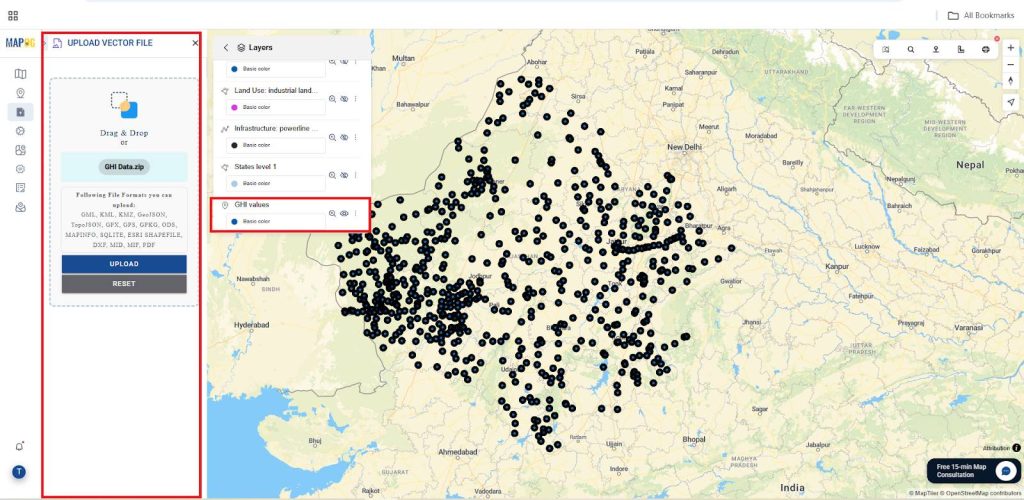
- Go to Add/Upload data, choose Upload Vector File, and upload the GHI dataset to evaluate solar potential.
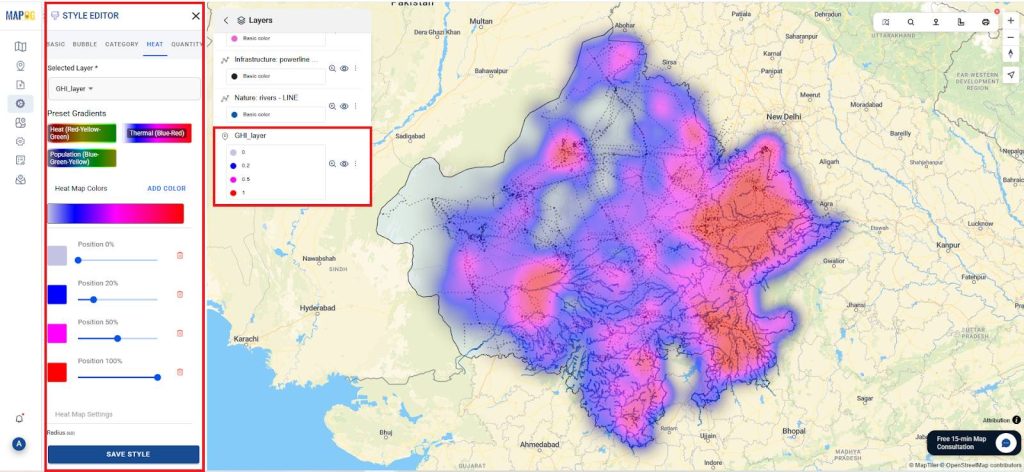
- Now, go to the Style Layer section and customize the GHI layer in the heat map as shown.
3. Create Buffer Zones and Merge polygon
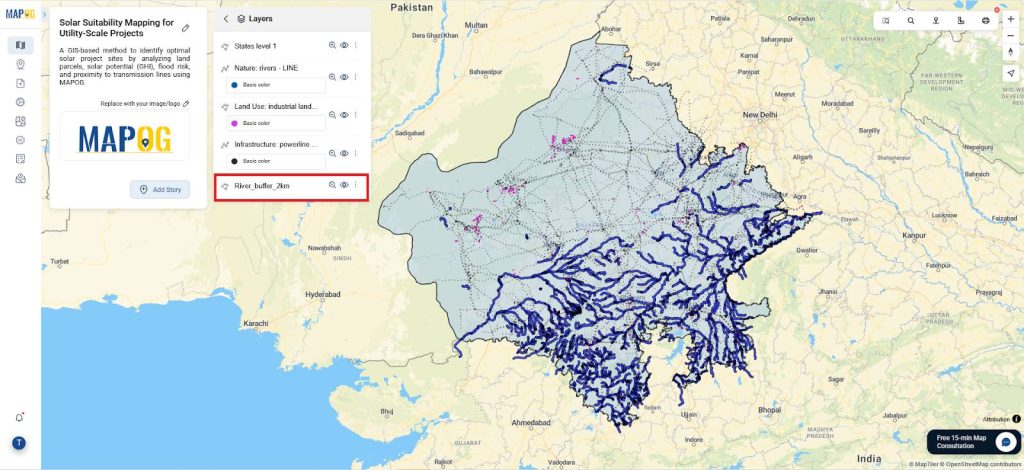
- Then, go to Process Data, use the Buffer Tool, and create a 2 km buffer around rivers.
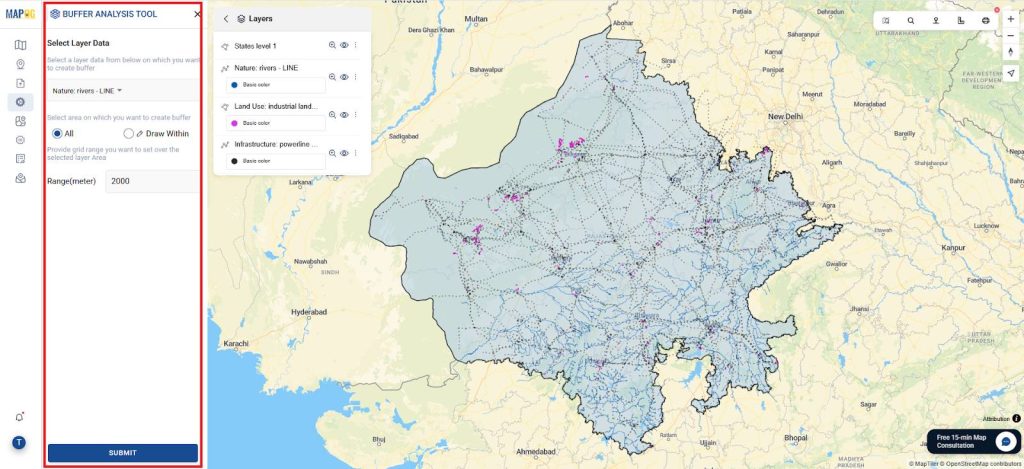
- Then, save the layer and rename it for clarity and easy reference.
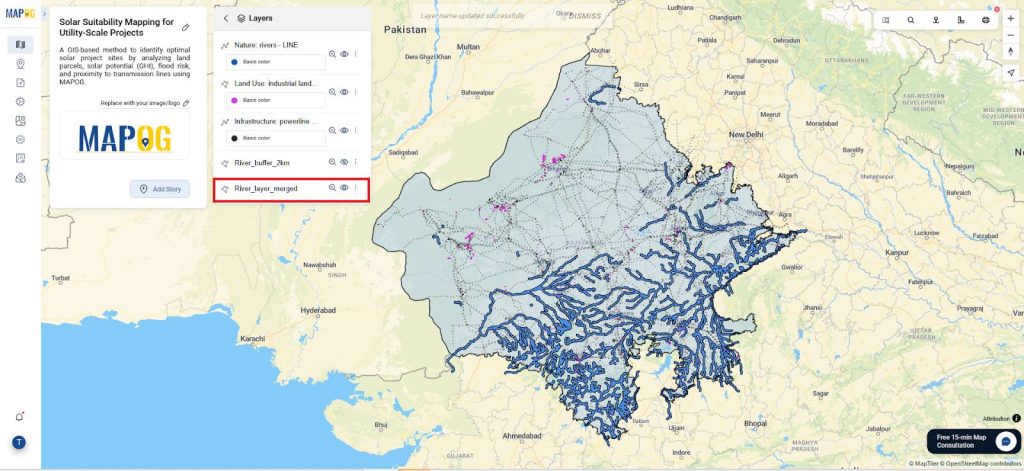
- Go to Process Data, select Merge Polygon, use 2 km River Buffer as input, and merge by attribute and value as shown.
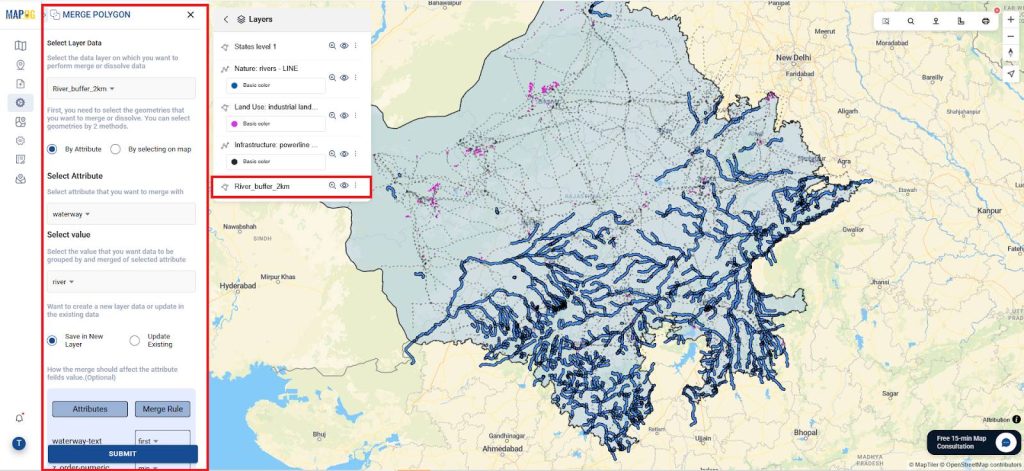
- Submit the layer and rename it clearly for better understanding and future reference.
- Create a 500m buffer for transmission lines using the Buffer Tool, then rename the layer.
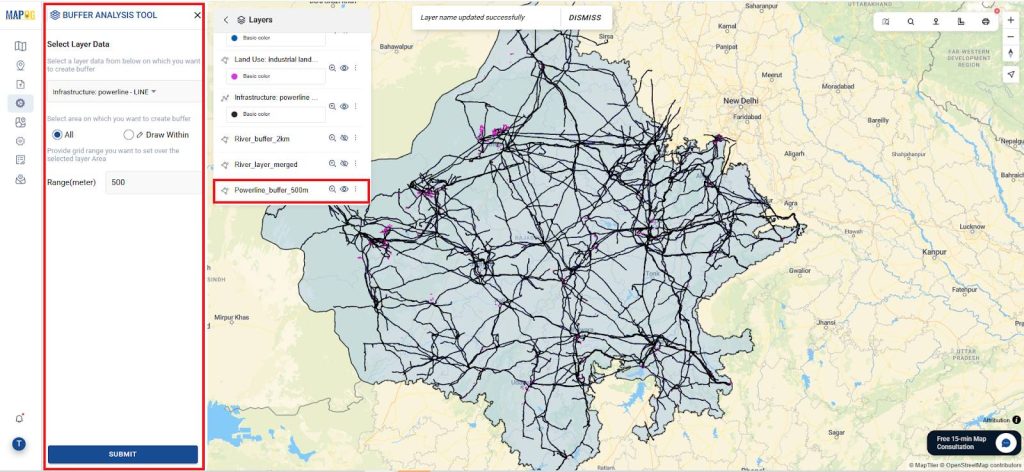
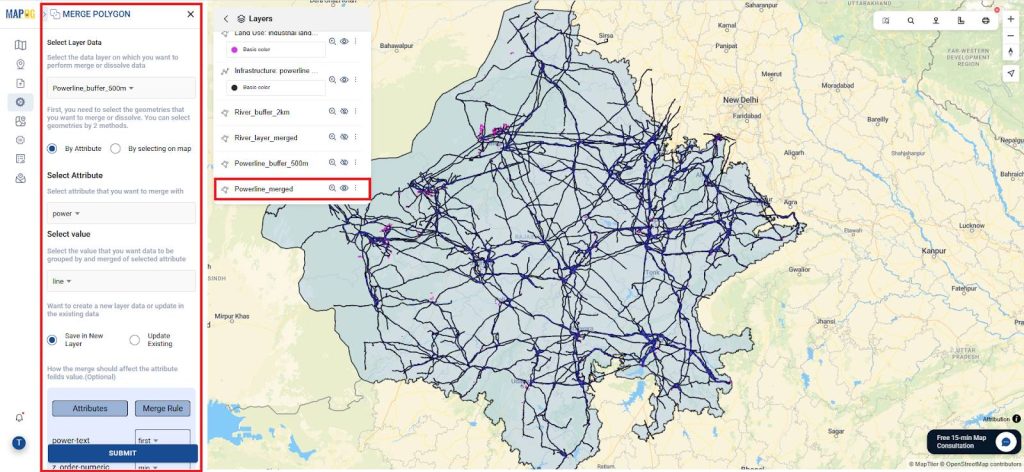
- Merge polygons using Process Data, then rename the merged output layer.
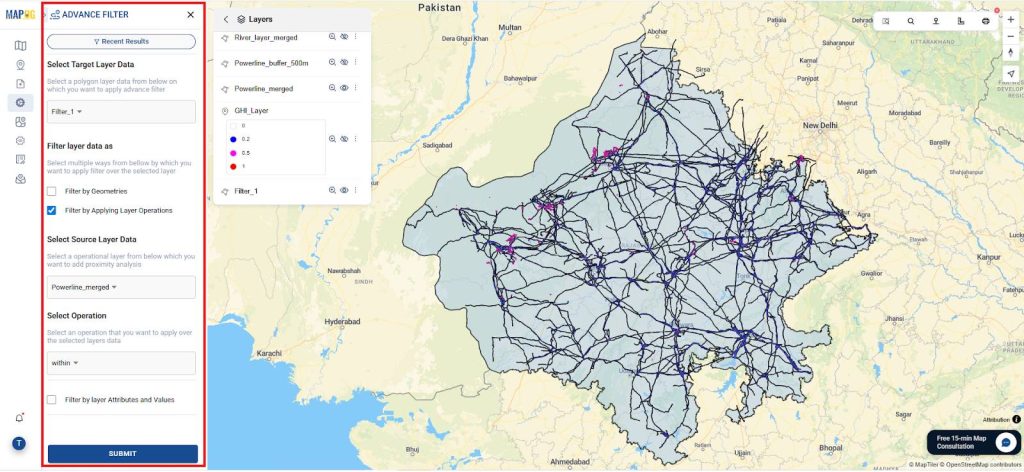
4. Apply Layer Filters
- To exclude industrial parcels within the 5 km flood risk zone, use Process Data > Advance Filter.
- Select the target layer as Land use Industrial, then use Filter by Applying Layer Operations.
- Choose the source as Merged River Layer and set the operation to Further with a 5 km distance.
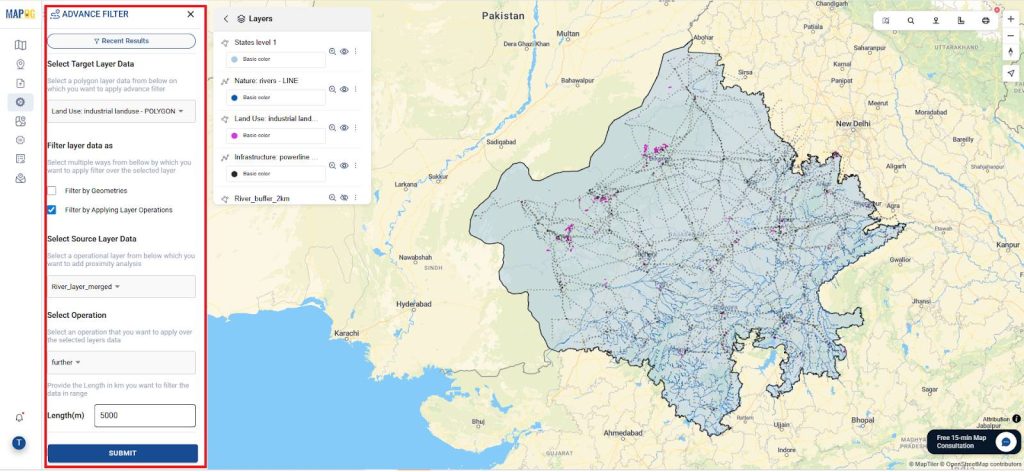
- Then, save the layer and rename it for easy identification and future use.
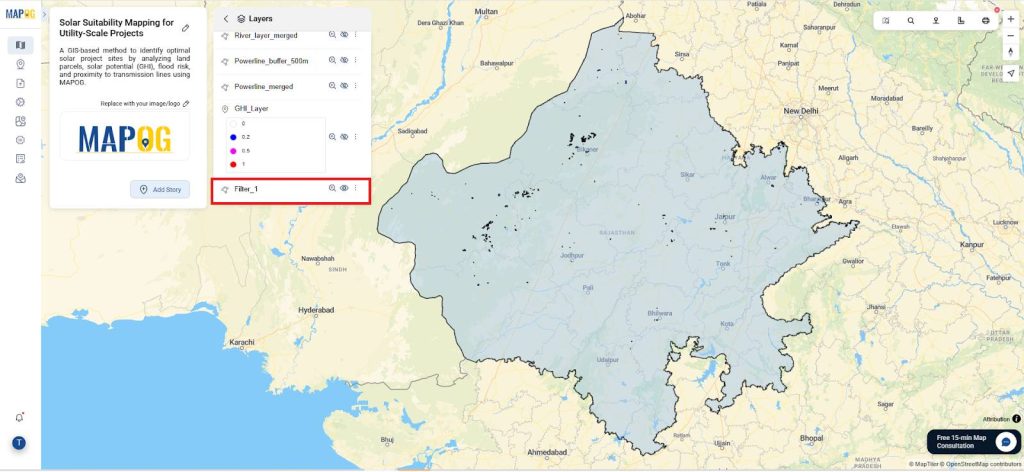
- Similarly, filter industrial parcels within 500m of transmission lines using Process Data > Advance Filter.
- Select the target layer as filter_1, then use Filter by Applying Layer Operations.
- Choose Merged Powerline as the source and set the operation to Within.
- Then, save the layer and rename it.
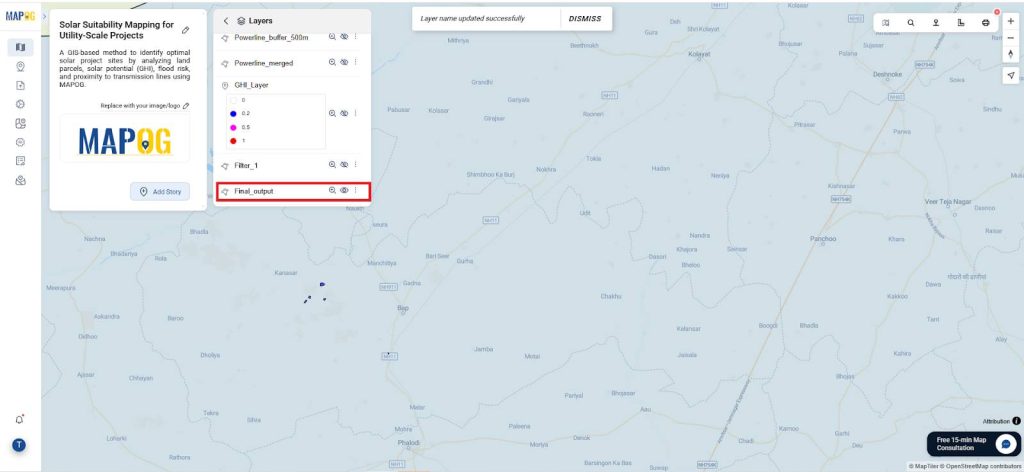
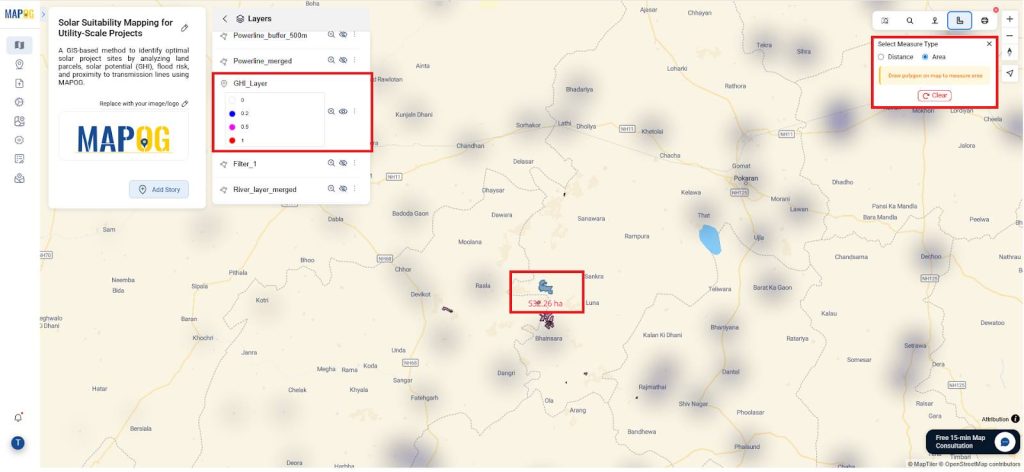
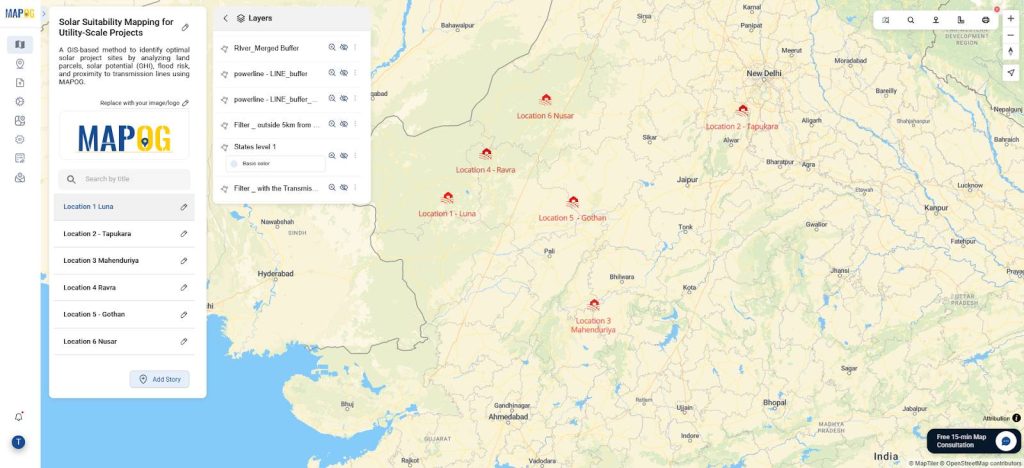
5. Select locations for Solar Site suitability
- Then, select 6 high-GHI points from the output layer, measure each area using the toolbox before plotting.
- Moreover, Use Add Story > Add Point Manually to mark solar site selections.
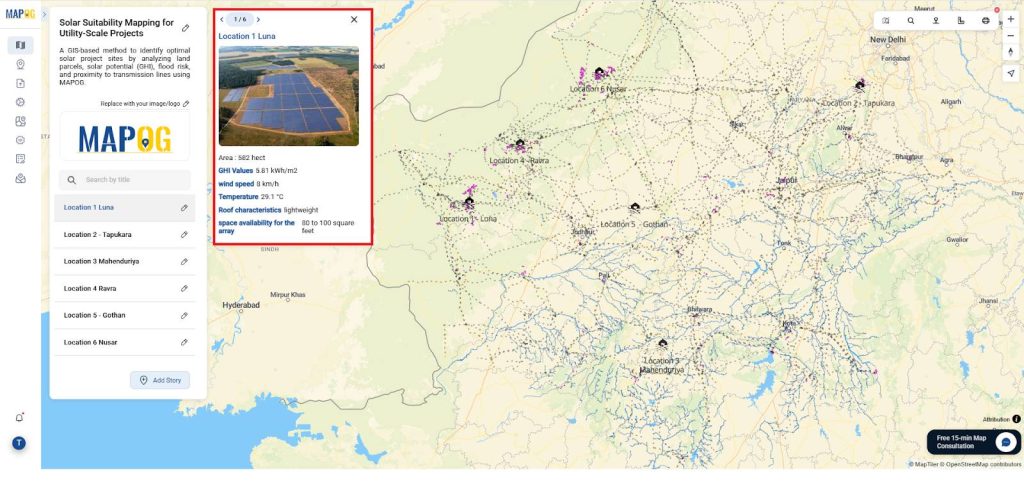
- Create a new select type named “Solar Site Selection” and add an attribute called “GHI Value”, “Temperature”, “Wind Speed’, Roof Characteristics” and “space availability for the array”.
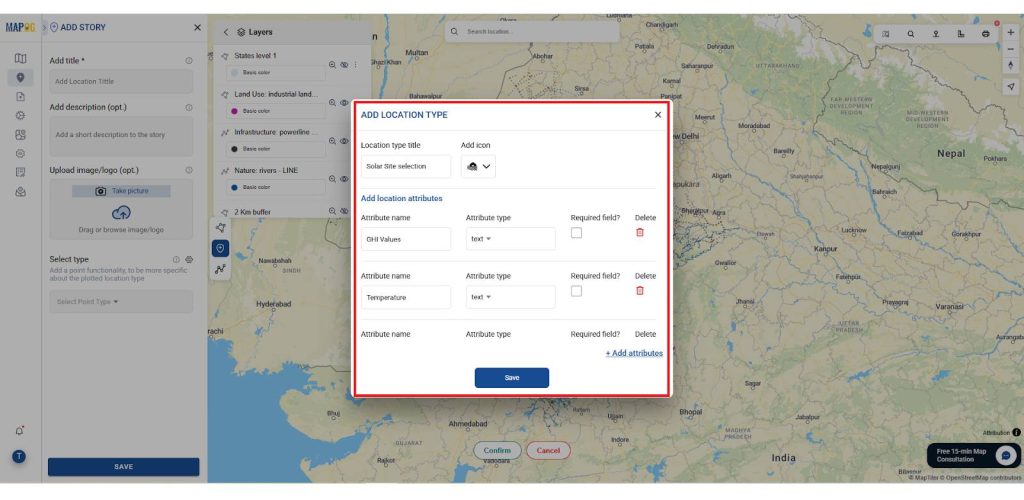
- Give the location name, image and short description and GHI value as shown.
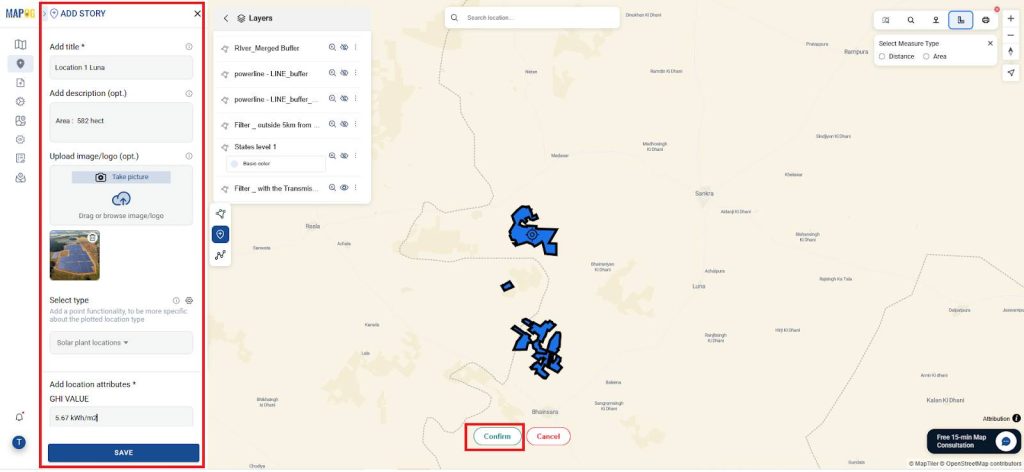
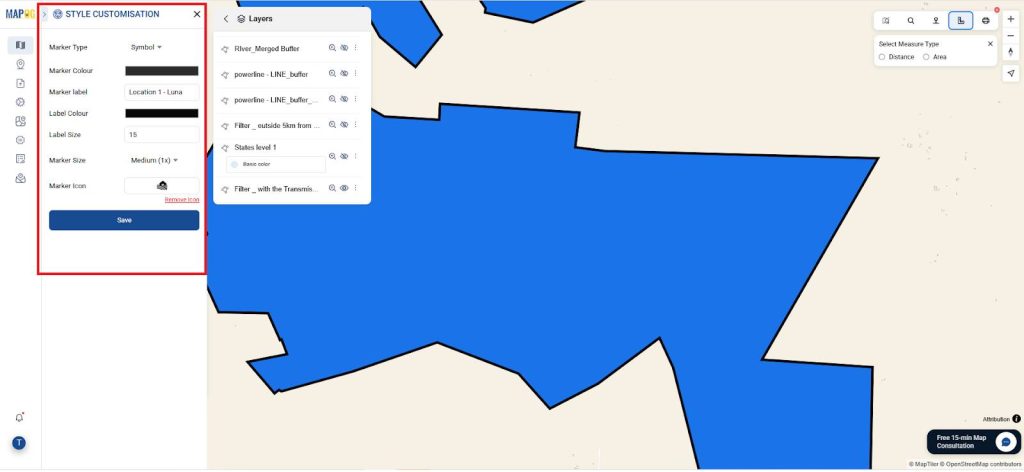
- Finally, give a label and icon using point customization.
- Similarly do for all the locations.
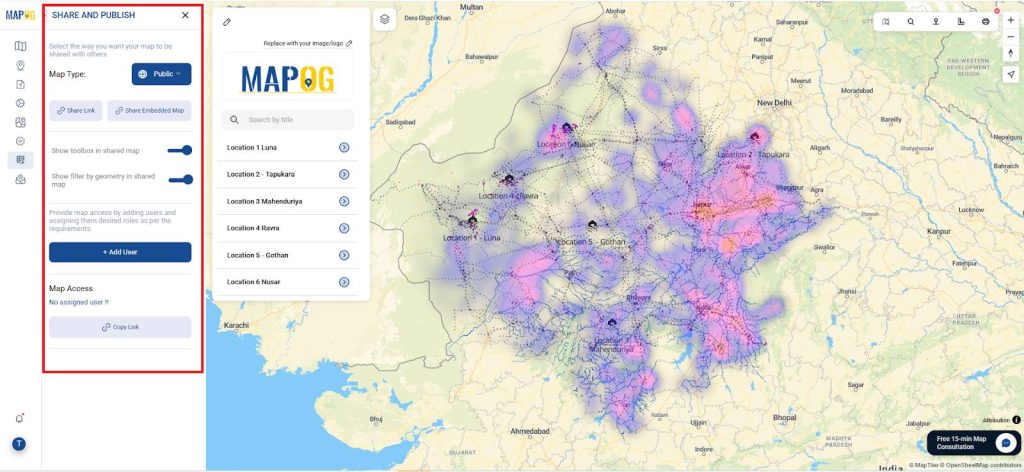
6. Publish and Share
- In summary, use MAPOG’s “Publish & Share” to export interactive maps.
Data Used
Insights and Relevance Across Disciplines
- Solar Suitability Mapping: Uses GIS layers for irradiance, land use and identifies low-conflict sites.
- Wider Impact: Supports clean energy planning, and collaboration across academic fields.
Conclusion
To conclude, solar suitability mapping with MAPOG relies on simple layering and filtering not complex modeling.
Finally, It Turns raw data into insights for intuitive, resilient solar planning proven by real-world case studies.