In this article, we examine the utilization of MAP OG’s MAP ANALYSIS techniques for visualizing Air Quality Index (AQI) data and Mapping Air Quality Index. Discover how GIS tools offer insights into pollution patterns, aiding informed decision-making for environmental health. Through sophisticated mapping techniques, we uncover nuanced insights into air pollution distribution. Explore how these analyses empower stakeholders in implementing targeted interventions for improved air quality management.
KEY CONCEPTS
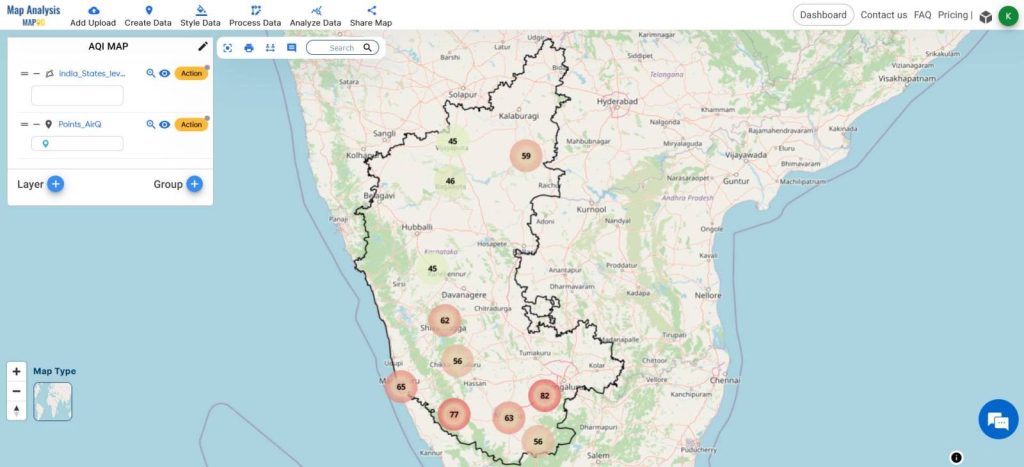
Our goal is to create a map of the Air Quality Index to understand the level of Air Pollution. By leveraging spatial data, we aim to inform strategic decision-making for more effective pollution control measures. We use Heatmap style in this analysis, similar to Create Map for Analyzing Water Quality using Heat Map Style. For Demonstration purposes, we have taken a few major places in Karnataka, India.
Steps for Mapping Air Quality Index using Heatmap Style.
Below are the steps to follow to create an AQI map.
- Open MapOG Map Analysis
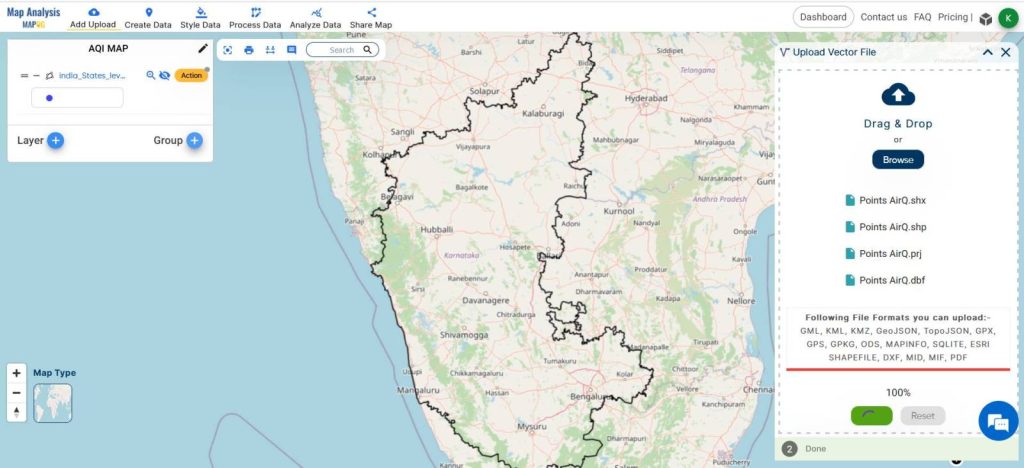
- Click on Add Upload and click Add Vector Data

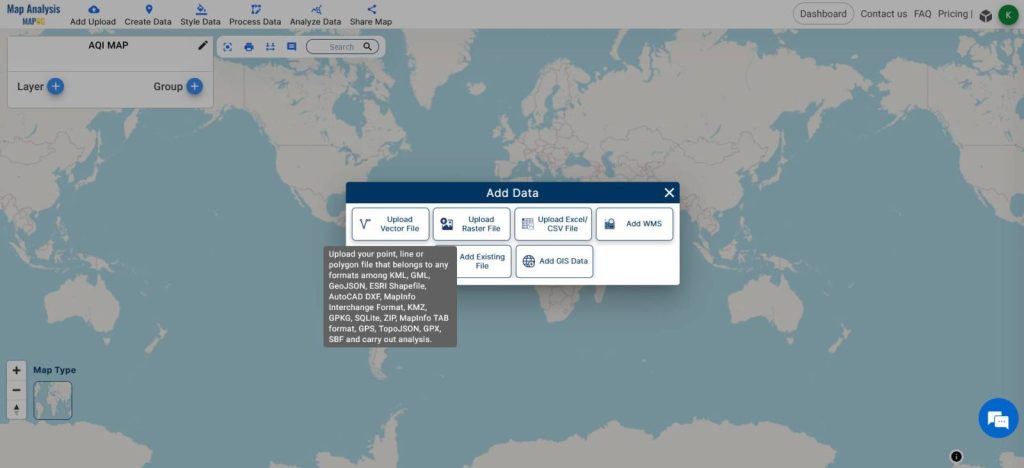
- Choose the Boundary Shapefile and click Upload
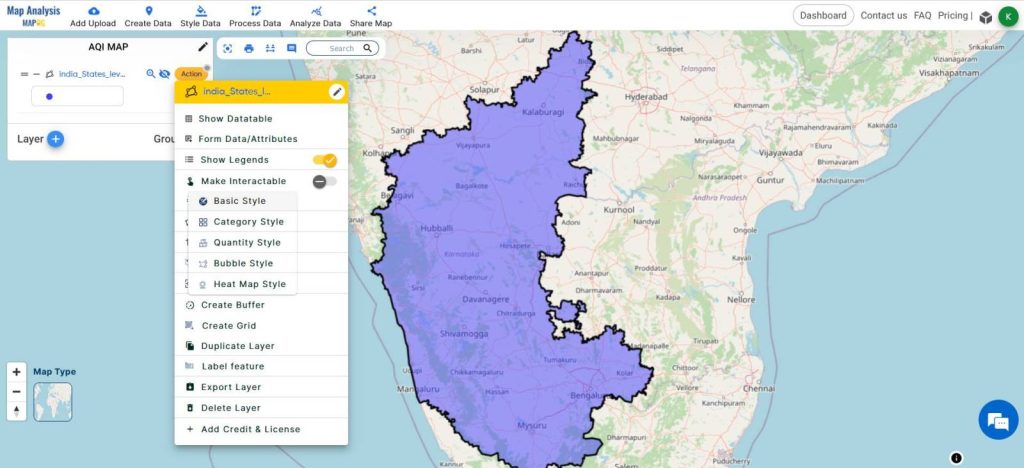
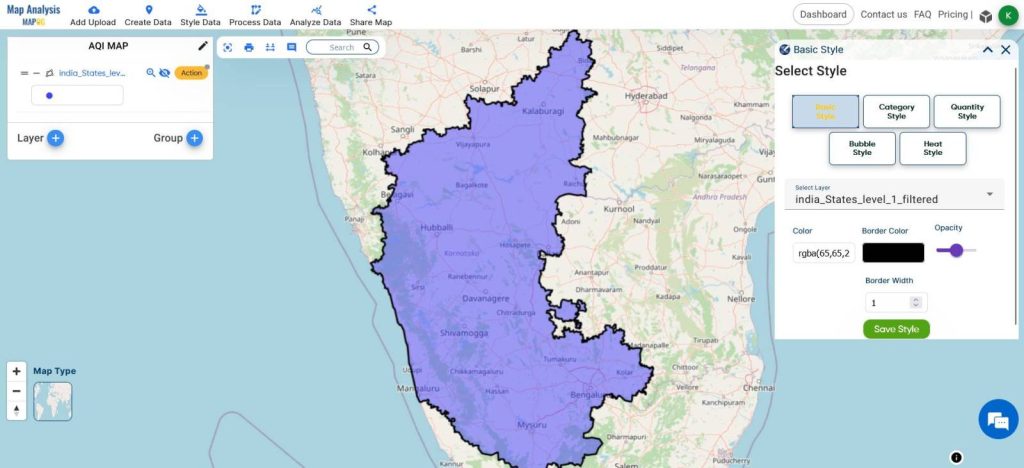
- Edit the style of the shapefile using Basic Styles from Style Tools.
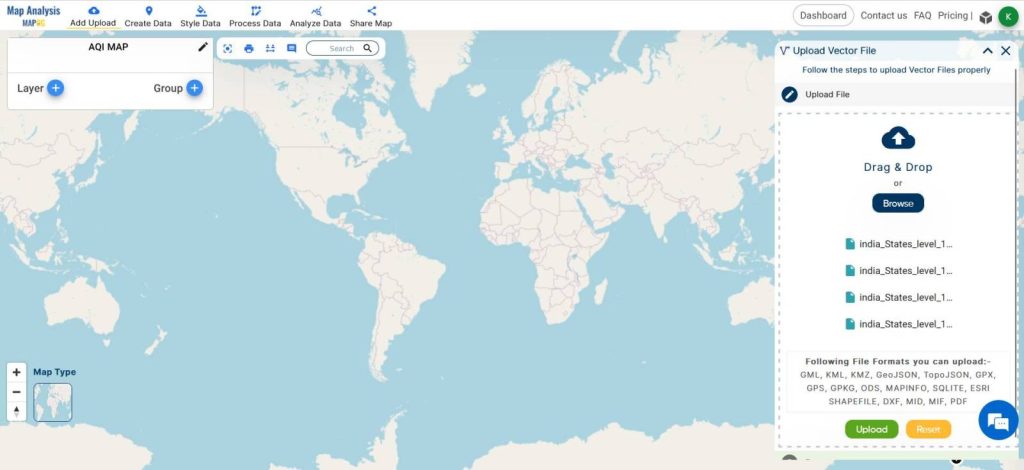
- Repeat the same steps to add the Points shapefile

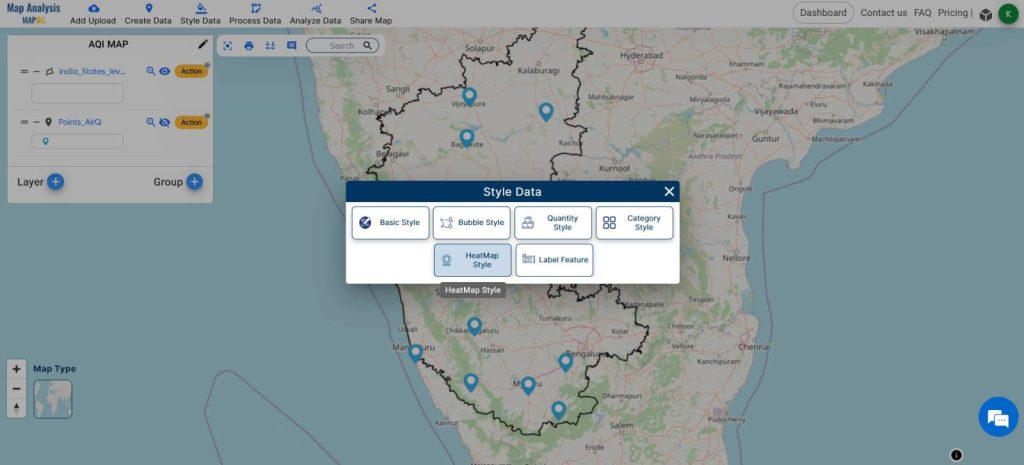
- From the Style tools, select Heatmap Style
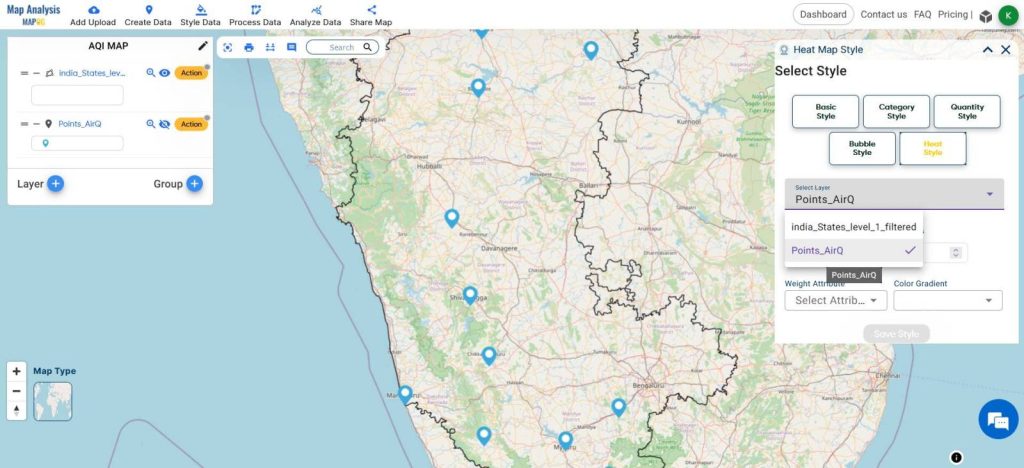
- Choose the Points Layer.
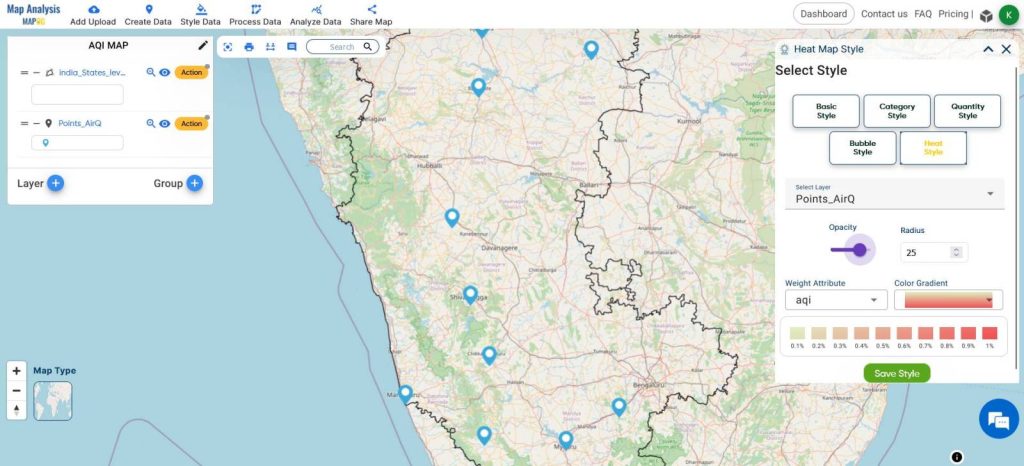
- Select the desired attribute
- Choose the color gradient and edit the opacity and radius of the circle.
- Hit Save Style.
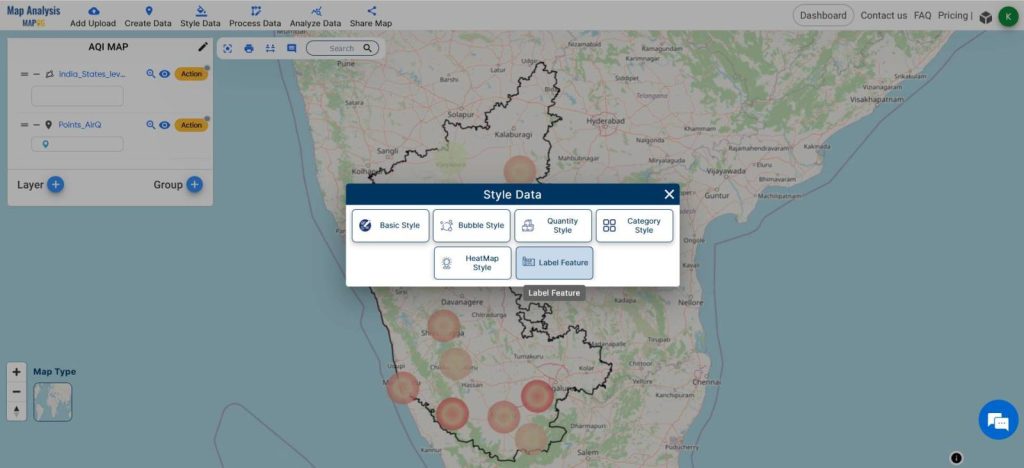
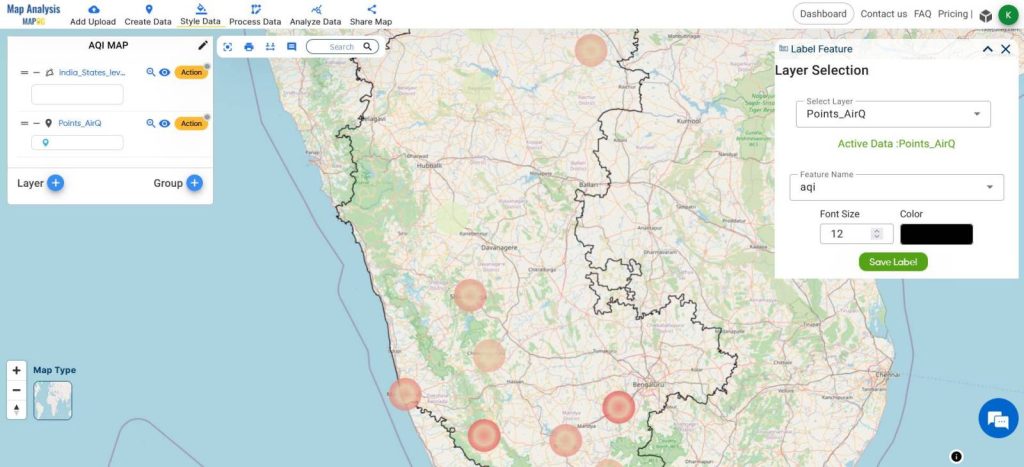
- From the Style tools, select Label Features.
- Choose the Points layer and select the attribute with Air Quality values.
- Edit the styles and click Save Label.
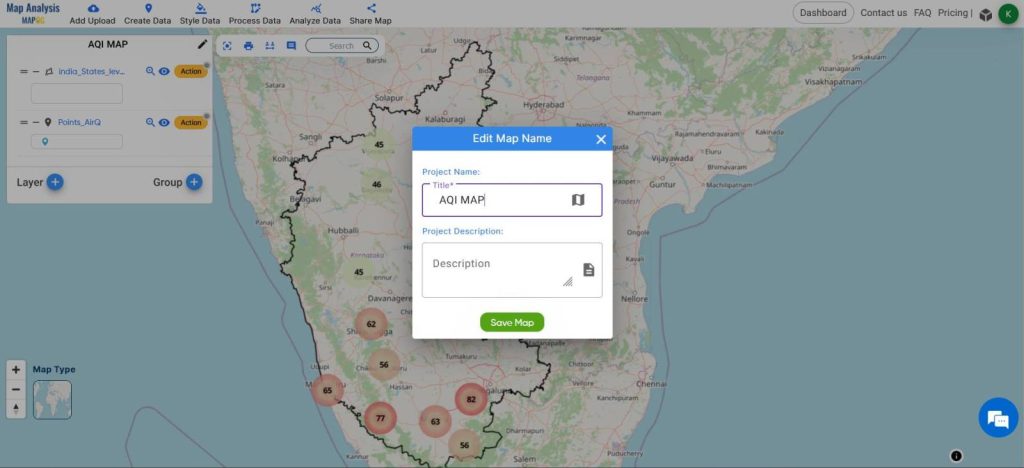
- Edit the map name by clicking on the pencil/edit icon from the top of the Layer Panel.
- Share the final map using the share tool.
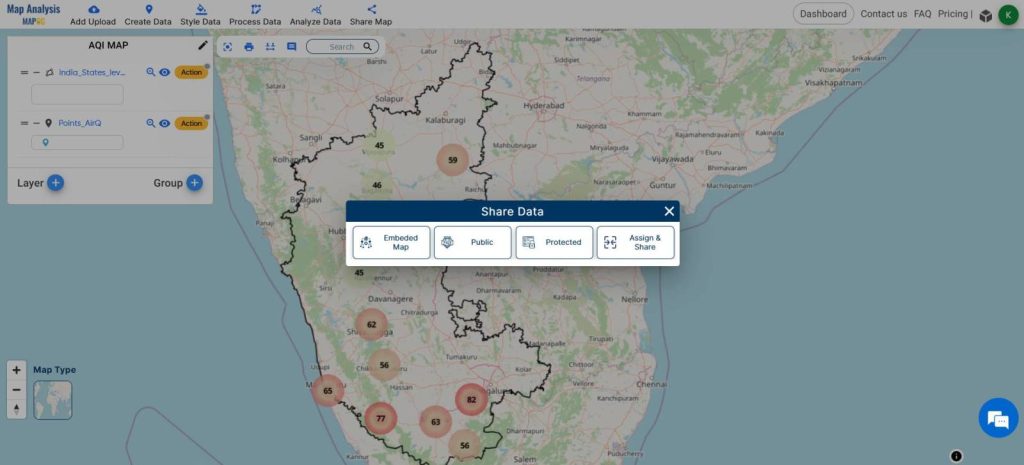
This is the Final Map
MAJOR FINDINGS
- Through MAP OG MAP ANALYSIS, historical trends in air quality were uncovered, facilitating informed decision-making for long-term pollution control strategies.
- Leveraging MAP OG MAP ANALYSIS, correlations between air quality and socioeconomic factors were identified, aiding in the development of targeted interventions to improve environmental equity.
- MAP OG MAP ANALYSIS revealed spatial disparities in air quality, enabling policymakers to prioritize resources and interventions for communities most affected by pollution.
BENEFICIAL DOMAIN: Environmental Management, Public Health, and Urban Planning.
- Environmental Management: This analysis aids in identifying pollution hotspots and temporal trends, enabling the implementation of targeted interventions for pollution control and ecosystem preservation.
- Public Health Initiatives: By revealing correlations between air quality and health outcomes, this analysis supports the development of policies and interventions aimed at reducing health risks associated with poor air quality, thus safeguarding public health.
- Urban Planning Strategies: Through GIS mapping, this analysis provides valuable insights into spatial disparities in air quality, guiding urban planners in designing more sustainable and livable cities by considering air quality impacts on land use, transportation, and infrastructure development.
For any inquiries or support needs, feel free to contact us at support@mapog.com to ensure seamless assistance and optimize your infrastructure protection strategies.
CONCLUSION
In summary, the application of MAP OG MAP ANALYSIS has yielded invaluable insights into air quality management. Through the examination of pollution hotspots, temporal trends, and spatial disparities, this analysis has provided crucial information for environmental management, public health initiatives, and urban planning strategies. By harnessing GIS mapping techniques, stakeholders can make data-driven decisions to tackle air quality challenges effectively, fostering healthier and more sustainable communities. As we further refine our understanding and implementation of MAP OG MAP ANALYSIS, we are primed to make substantial advancements in addressing air quality concerns and improving overall public well-being.
GIS DATA USED
VIEW OUR PREVIOUS BLOGS
Create Map for Analyzing Water Quality using Heat Map Style
Analysis in Urban Planning: Reshaping Transportation Future Insights of state/city
Step-by-Step Guide: Creating a Dynamic Bubble Map for Free – Exploring Population Demographic