In today’s data-driven retail world, every customer leaves behind a digital footprint — where they live, how often they buy, and how much they spend. Yet, even with this information it can be difficult to decipher the bigger picture or understand where your most valuable customers actually come from.
That’s why visualizing customer data matters. When you color code your customers on a map based on their purchase behavior, patterns begin to emerge — instantly showing you which areas are thriving, which are underperforming, and where new opportunities may lie.
By using MAPOG, businesses can seamlessly transform raw addresses into visual insights. As a result, decision-making becomes clearer — helping retailers plan store expansions, optimize delivery routes, and target marketing campaigns with precision.
Key Concept: Why Color Coding your Customers based on their Purchase Behavior is Important?
Color-code your customers by purchase behavior to transform raw data into a clear visual story. Instead of sifting through endless rows of numbers, businesses can instantly see where high-, medium-, and low-value customers are located.
This visual clarity makes it easier to target marketing campaigns, optimize delivery zones, and uncover untapped areas with growth potential. In essence, color-coding helps companies move from data to decisions — faster, smarter, and with greater confidence.
Step by Step Guide on how to color code your customers on a map
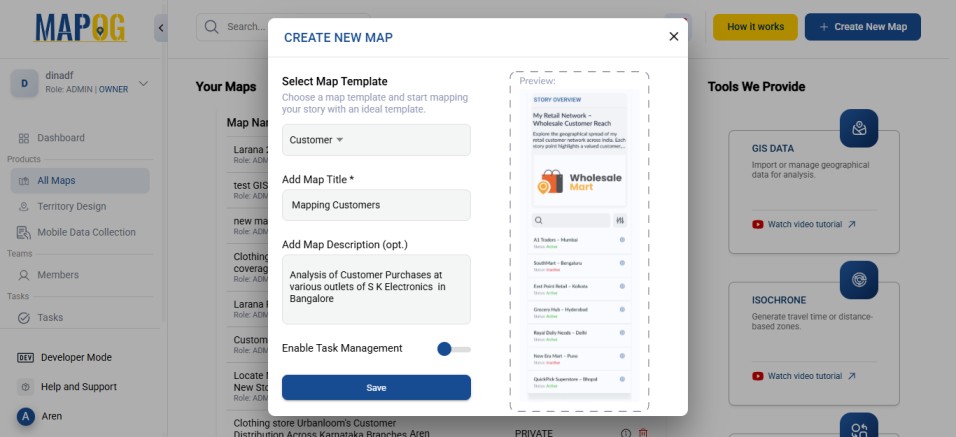
1. Start with a New Map
Open MAPOG and click on “Create New Map” Select Customer as your story template, give your project a title and brief description, then hit save.
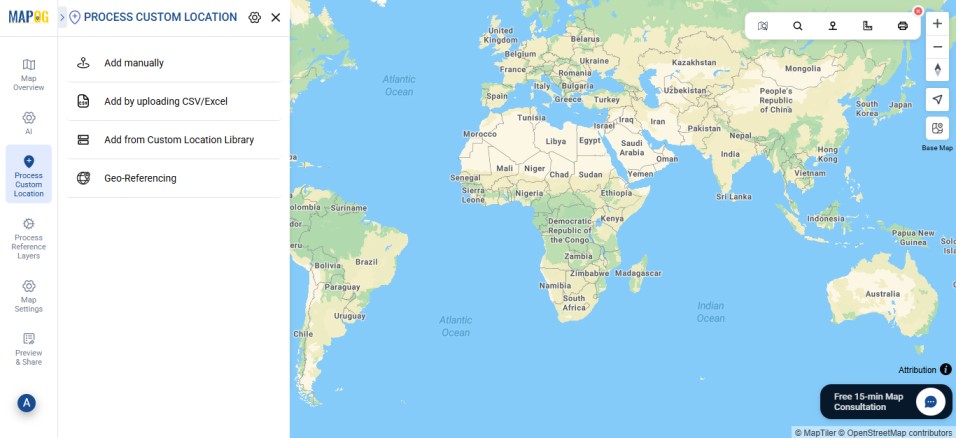
2. Add coordinates using a CSV file
Go to Process Custom Location and then select “Add by uploading CSV/Excel”.
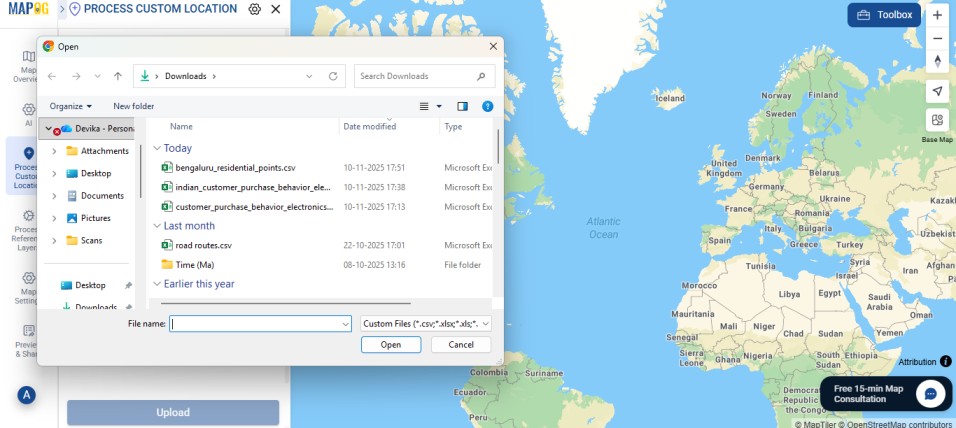
And then upload your desired CSV file.
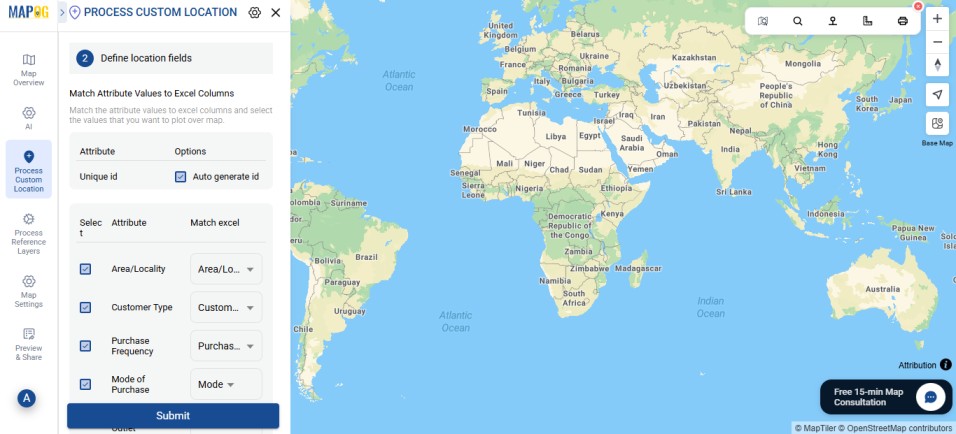
Go to Select Custom Location Template settings option, add custom location template type such as — Customer mapping and then input necessary attributes such as the area, customer type, purchase frequency, etc.
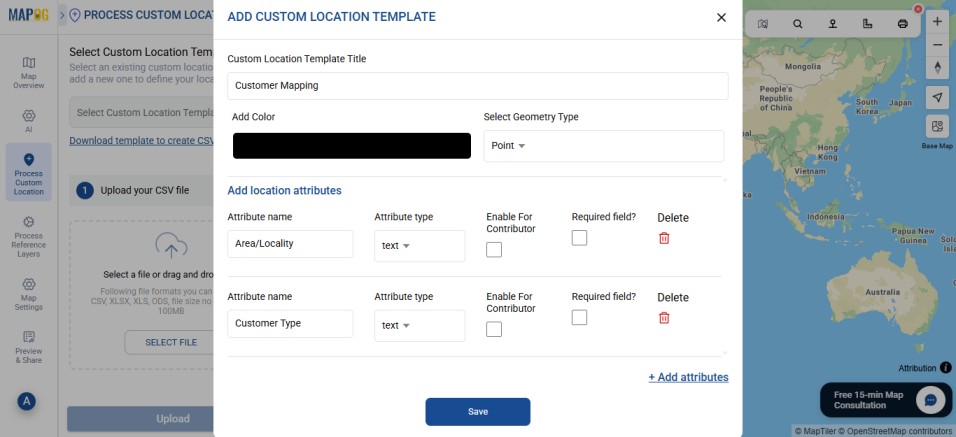
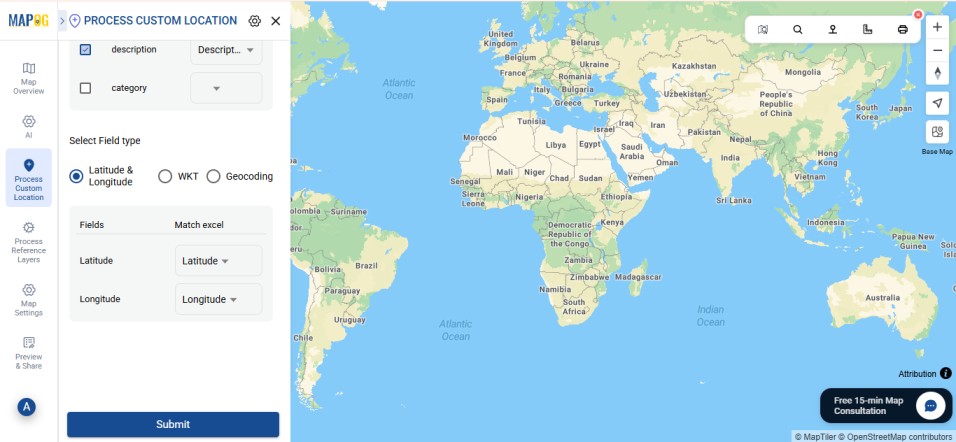
Then match your excel with attributes, and the field type with latitude and longitude, respectively. After that, hit submit.
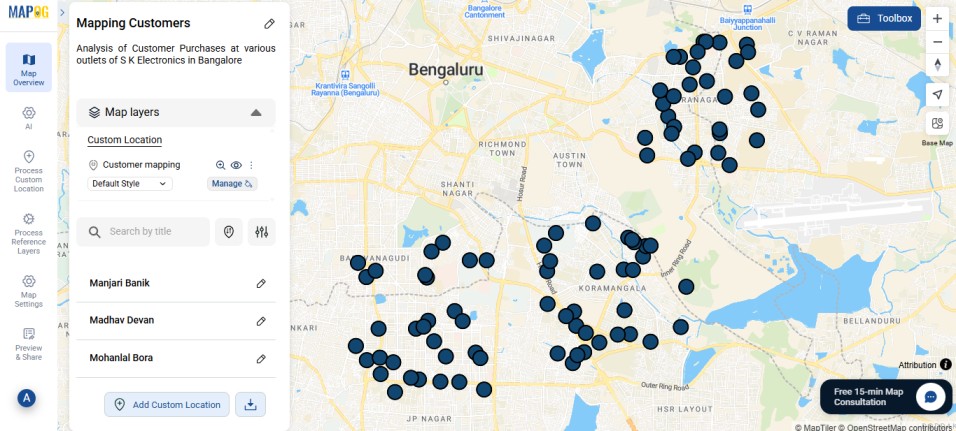
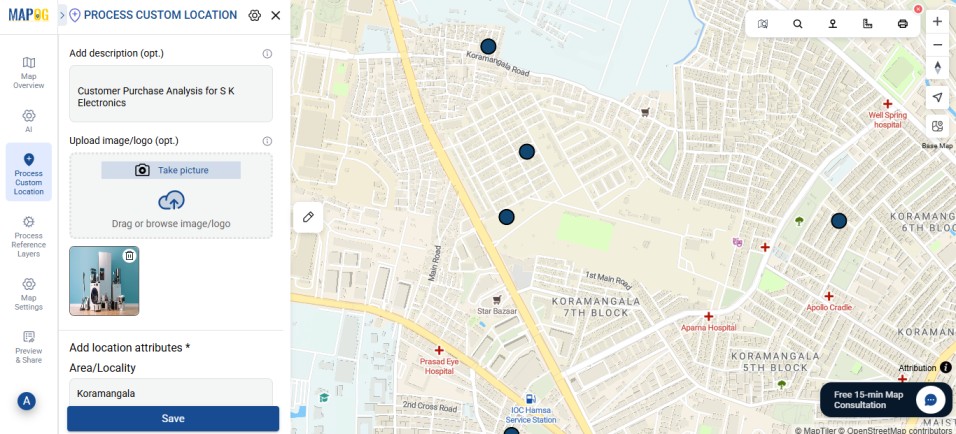
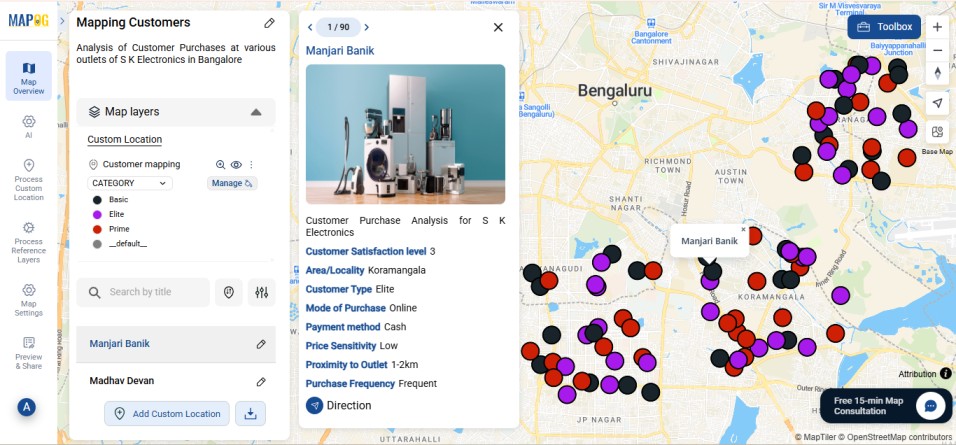
3. Editing the points.
Go to Edit point details.
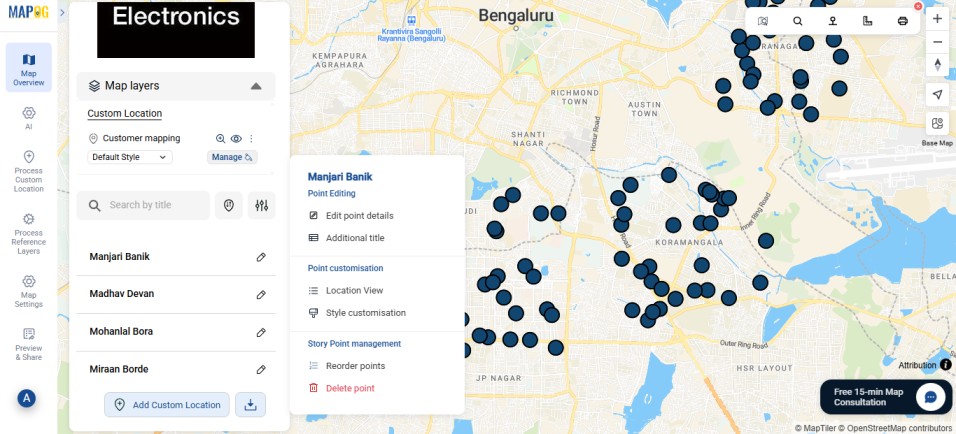
Next, add a relevant image for your point to complete the necessary attributes, then click Save.
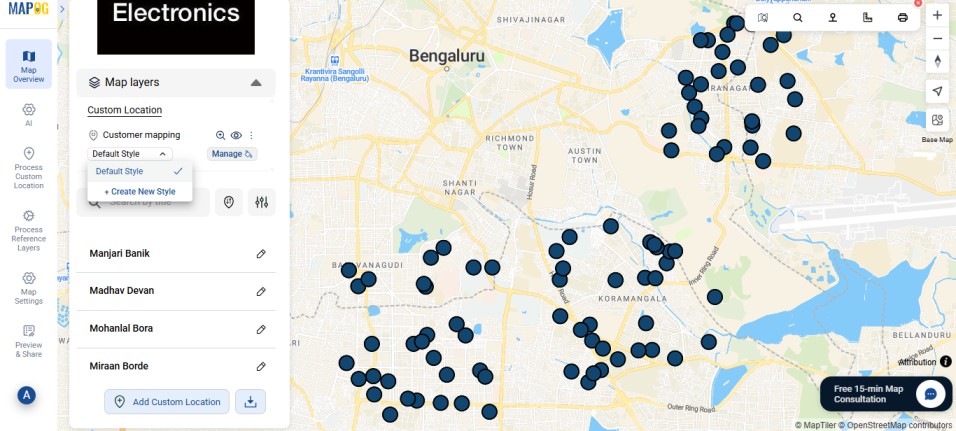
Categorize the point icons by applying a Style Layer. Go to Style layer and select Create New Style.
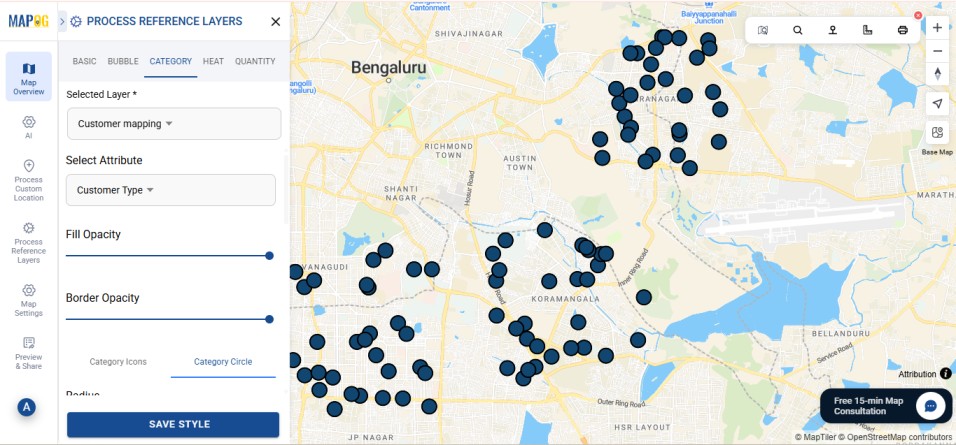
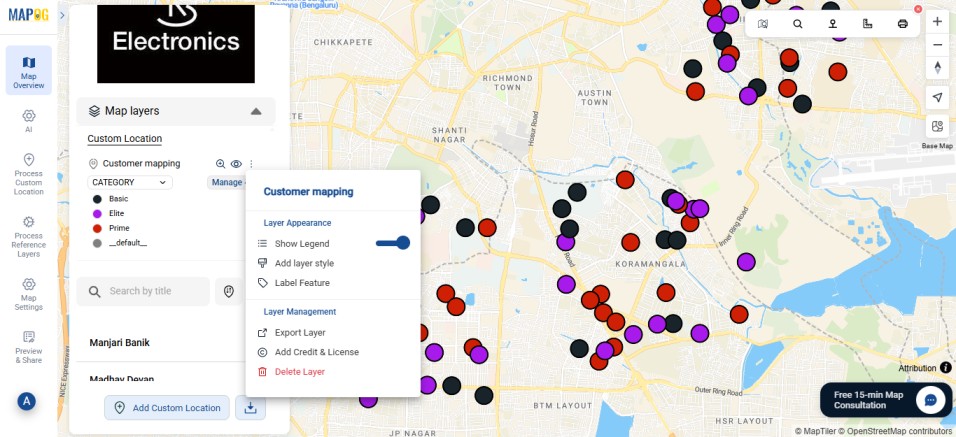
Go to the category section, select the attribute on the basis of which you wish to categorize the customers. Here, we use Customer Type, which further divides customers into Elite, Prime and Basic.
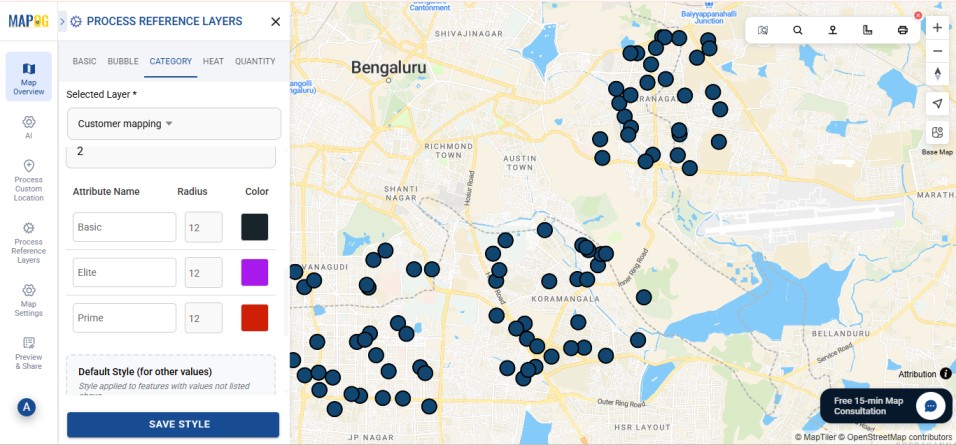
Customize the colors for each attribute. In this case, Purple for premium customers, Red for occasional customers and Black for rare customers.
4. Show Legend
Once your map is ready, under the map layers section click on the three dots next to the custom location, and select “Show Legend” to enable the legend display.
Real World Applications
Color-coding customer behavior has clear, real-world value across retail operations.
For instance, in store planning, mapping customer data helps identify areas with strong sales activity or untapped potential, guiding smarter expansion decisions. In addition, marketing teams can target campaigns more precisely by focusing on regions with higher engagement or loyalty.
Moreover, logistics and delivery operations become more efficient when customer clusters are visible, allowing businesses to optimize routes and reduce costs.
Ultimately, linking purchase behavior to geography turns data into direction — helping businesses act strategically, not just reactively.
Conclusion
In the end, mapping and color-coding customer behavior is more than a visualization tool — it’s a bridge between data and decision. By viewing customers through a spatial lens, businesses can move beyond spreadsheets and see the real-world context behind their numbers.
Furthermore, MAPOG allows teams to connect behavioral data with geography, revealing patterns that drive smarter marketing, efficient operations, and informed growth strategies.
Ultimately, this approach helps businesses transition from reactive analysis to proactive planning. When data is visualized meaningfully, it doesn’t just inform — it empowers.