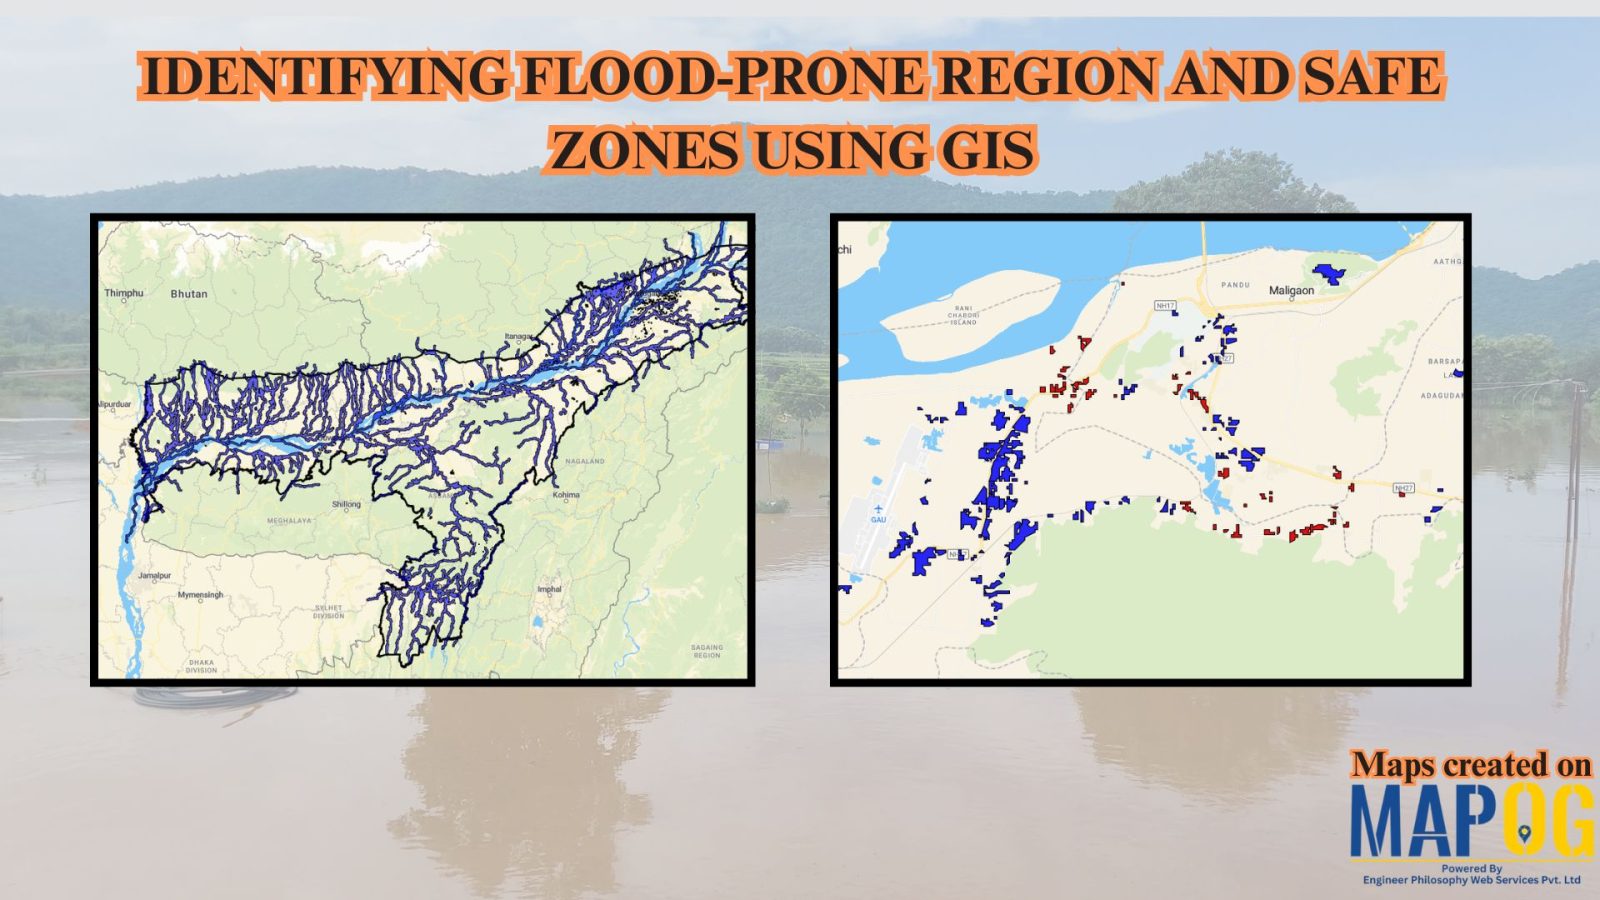
GIS in Education

Mapping Emergency Services Near Education Institutions Using GIS

How to Map Emergency Services Near Educational Institutions Using GIS Tools

Ensuring the emergency services Near Education become more critical than ever safety of students in educational institutions is a high priority in urban and regional planning. As cities expand rapidly and population density increases.  This article explains how Geographic Information Systems (GIS) can be effectively used to map emergency services near educational institutions. For this … Read more

Mapping Hospital Coverage and Categories Using Convex Hull

Mapping Rural Hospital Coverage Using GIS and Convex Hull

Mapping Hospital Coverage and Categories, locations in rural areas ensures that communities have access to essential healthcare during emergencies. Visualising hospital distribution and overall coverage helps identify underserved regions and gaps in healthcare infrastructure. With MAPOG, users can build interactive GIS maps showing hospital points, health facility types, and Convex Hull polygons that represent the … Read more

How to Use GIS Mapping for Solar Development A Step-by-Step Guide to Smart Site Selection

How to Use GIS Mapping for Solar Development: A Step-by-Step Guide to Smart Site Selection

Planning utility-scale Solar Site Suitability Mapping projects with MAPOG involves overlaying layers like GHI, land parcels, flood zones, and transmission lines. Spatial filters quickly eliminate unsuitable areas, helping prioritize sites that are both high in solar potential and accessible to the grid streamlining smart, data-driven solar development. Key Concept: Solar Site Suitability Mapping While many … Read more

Mapping Cyclone Shelter Locations for Coastal Safety Using GIS

Mapping Cyclone Shelter Locations for Coastal Villages Using GIS

Mapping Cyclone Shelter Locations in coastal villages need quick access to shelters during emergencies. Visualizing shelter locations and their accessibility helps uncover gaps in disaster readiness. With MAPOG, users can build interactive GIS maps showing shelter distribution, village settlements, roads, and key geographic features. Instead of complex tools, this method uses simple layers and spatial … Read more

Performing Retail Site Selection with Convex Hull Analysis

Performing Retail Site Selection with Convex Hull Analysis

Choosing the right retail location goes beyond guessing where people shop. Instead it’s about recognizing spatial clusters, identifying market gaps, and optimizing coverage. With this in mind, MAPOG, retailers can make data-driven decisions by interpreting customer and store distributions visually. Coupled with heat bubble styling, grid-based analysis, or retail site selection , MAPOG enables smarter … Read more

Create Story Maps for Education: A Visual Way to Teach History, Geography, and More

Visual storytelling through maps offers a dynamic way to teach history, making abstract timelines and political shifts more tangible. When learners can Create Story Maps for Education, they visualize how historical events unfolded across space, leading to deeper understanding. For example, using a British India interactive map, educators can illustrate how the British Empire expanded—from … Read more

Free GIS Mapping Tools for Students and Researchers

Free GIS Mapping Tools for Students and Researchers

In today’s logistics-driven world, Geographic Information Systems (GIS) play a pivotal role in analyzing spatial data for informed decision-making. Fortunately, MAPOG offers Free GIS Mapping Tools that empower students, researchers, and planners to explore and visualize real-world location-based patterns. With tools such as Buffer Zones, Clip and Isochrones, users can easily identify optimal sites for … Read more

The Ultimate Guide to Uploading GIS Data Formats (CSV, KML, Shapefile)

Uploading GIS data is the crucial first step in any spatial analysis workflow. Whether for urban planning, environment, infrastructure, or disaster response, clean and structured data ensures accuracy in representing real-world features and relationships. Using correct formats allows mapping software to interpret boundaries and attributes effectively. MAPOG, a leading cloud-based GIS platform, supports various formats … Read more

Interactive Population Maps

Interactive Population Map with Heat Bubble and Category Styling

Analysing and interpreting population data across various geographic regions can be done visually with Interactive Population Maps with Heat Bubble and Category Styling. It is simple to quickly identify high and low concentration areas on these maps because they use heat bubbles, which vary in size and colour, to represent population density or totals. Furthermore, … Read more

“Visual map showcasing top universities categorized by popular courses such as MBA, Law, Engineering, and more”

Top Universities on Map by Popular Courses: MBA, Law, Engineering & More

In a globally connected world, students, researchers, and academic planners are increasingly turning to smart solutions for understanding how leading institutions are distributed across regions. Whether you’re exploring top engineering schools, renowned MBA programs, or historic fine arts colleges, mapping education institute places offers a dynamic and visual way to grasp academic reach and reputation. … Read more