Visualizing COVID-19 Mortality Patterns: Heatmap Analysis
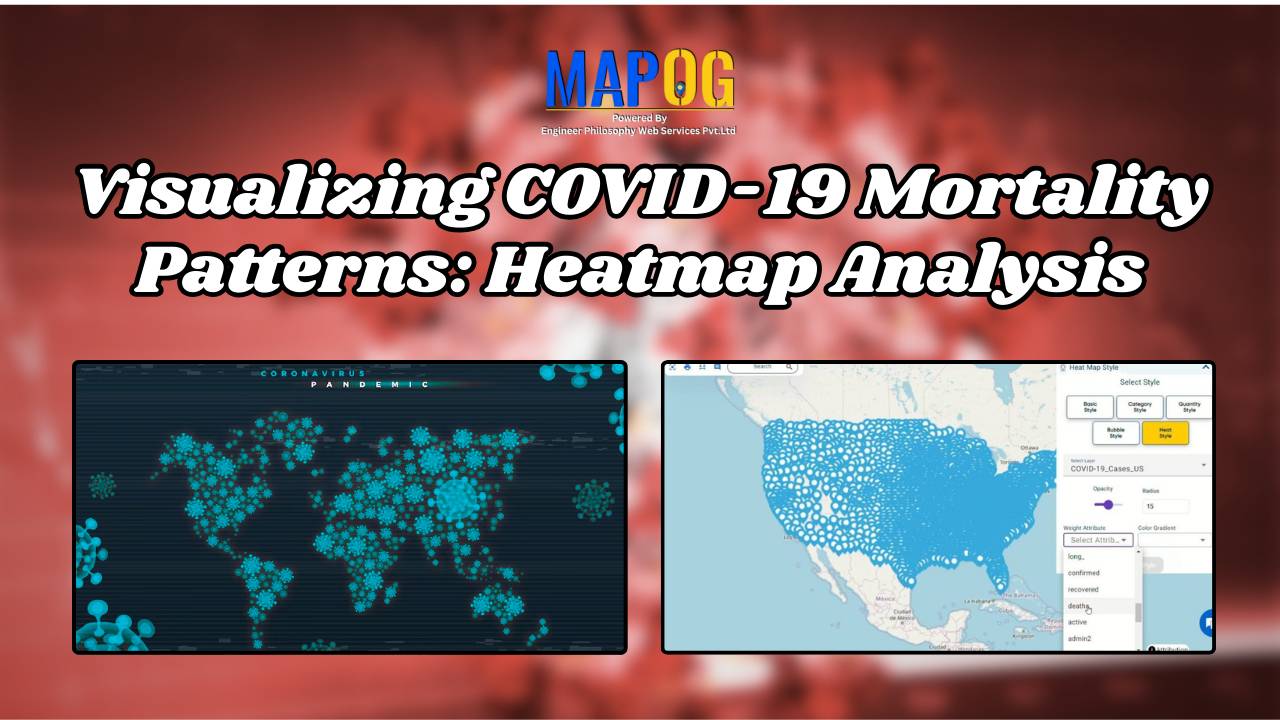
Explore COVID-19 mortality patterns through heatmap analysis. Visualize and analyze data for informed insights into disease impact and response strategies.
Explore COVID-19 mortality patterns through heatmap analysis. Visualize and analyze data for informed insights into disease impact and response strategies.
In this article, we will explore how to create and analyze heat maps to understand disease spread, specifically focusing on COVID-19 death rates. Utilizing the powerful MAPOG Map Analysis tool, we’ll walk through the process of visualizing data using heat maps, making it easier to identify patterns and make informed decisions. This step-by-step guide will … Read more
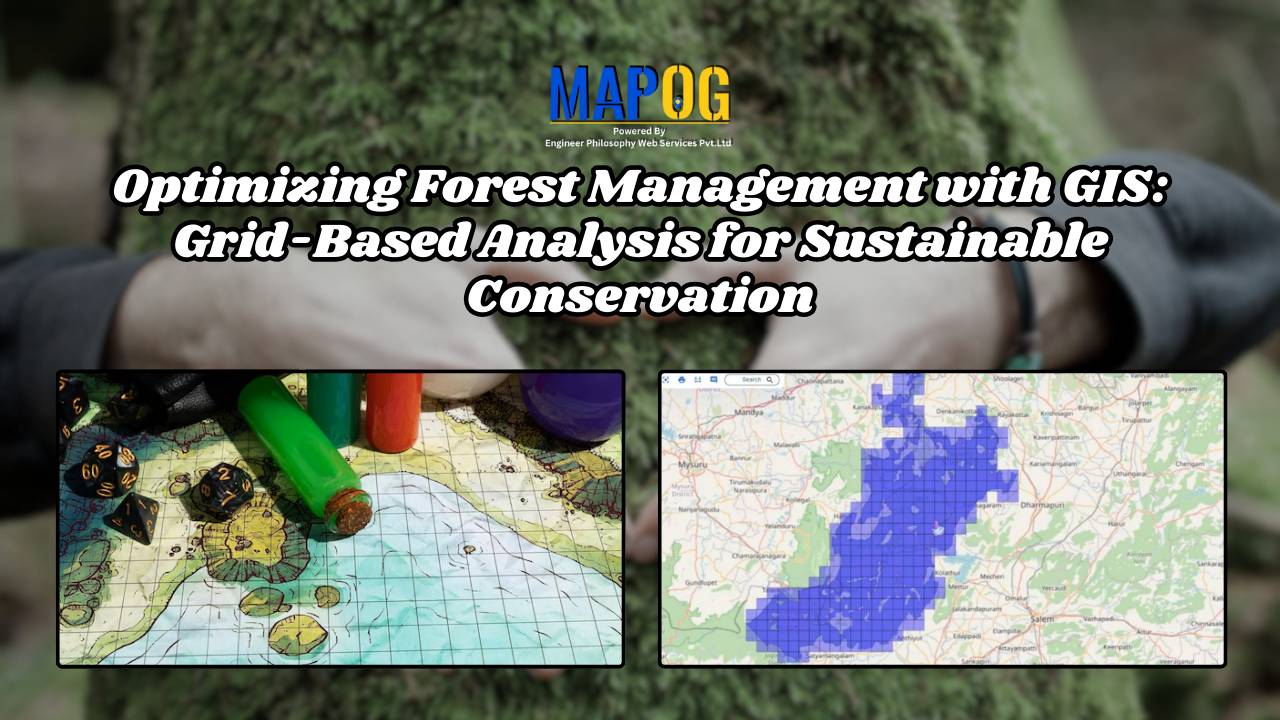
In forest management, the utilization of Geographic Information System technologies is paramount for enhancing resource management and conservation efforts. Leveraging MAPOG Map Analysis, we embark on a journey to explore the utilization of grids for better decision-making. By integrating forest data onto the map and employing spatial analysis techniques, such as clipping and grid creation, … Read more
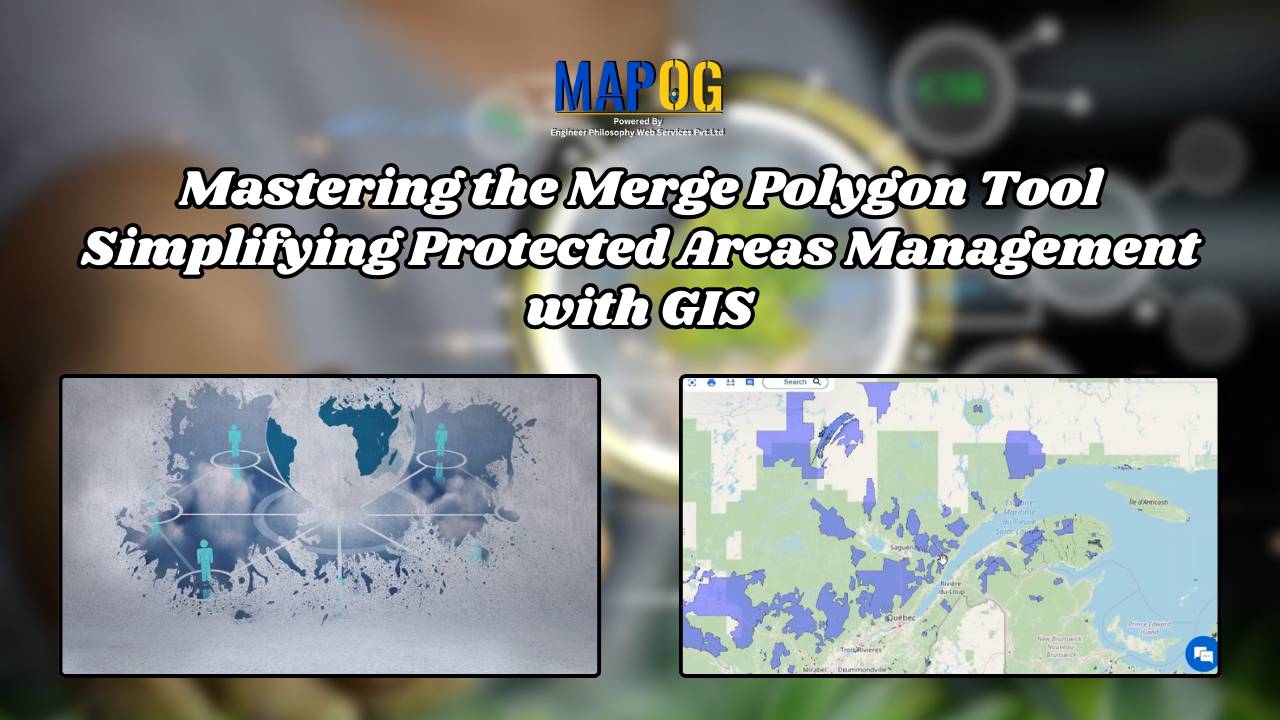
What is Merge Polygon tool? The Merge Polygon tool is a functionality that enables the combination or consolidation of adjacent or overlapping polygons into a single, cohesive polygonal feature. This tool is essential for spatial data processing and analysis, allowing users to simplify complex datasets, resolve geometric inconsistencies, and streamline data representation. This article delves … Read more
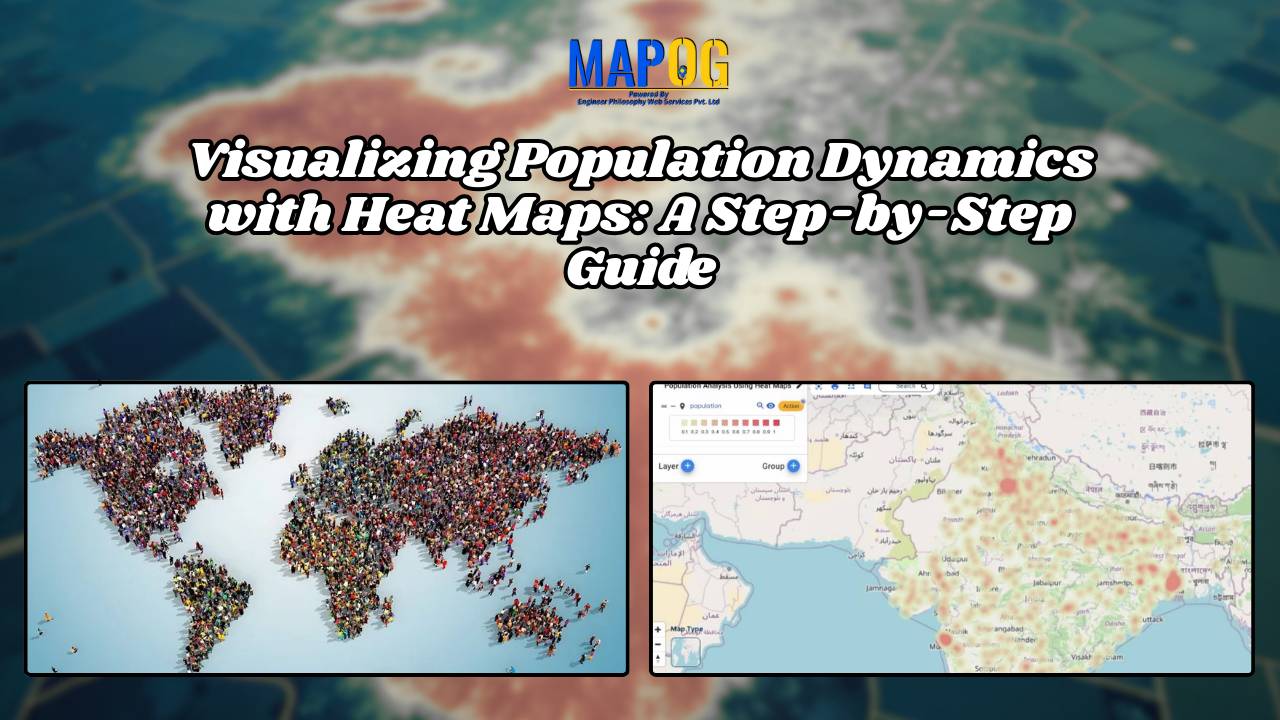
In data visualization, heat maps emerge as powerful tools for conveying information in an intuitive and visually engaging manner. Through the use of color gradients, heat maps offer valuable insights into population distribution, trends, and patterns. In this use case, we explore heat maps as a tool for mapping population data from a CSV file … Read more
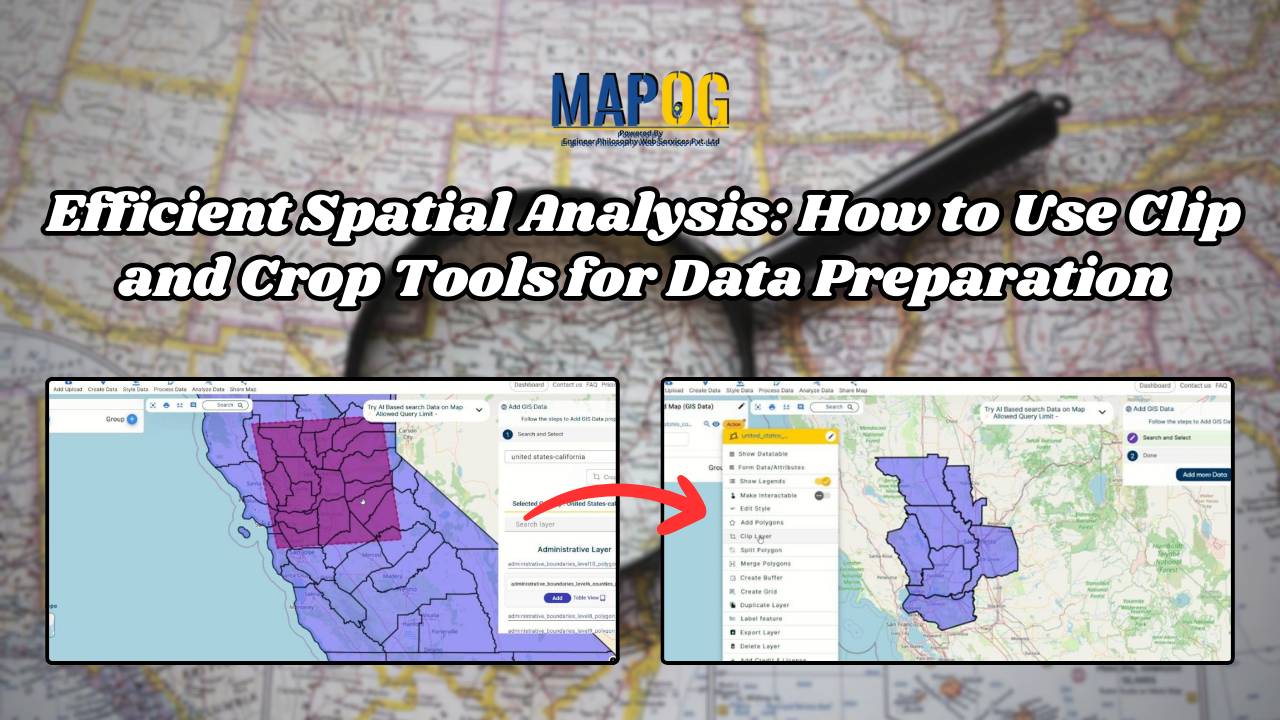
Enhance map customization with clip or crop layers functionality. Tailor geographic data precisely for focused analysis and visualization.
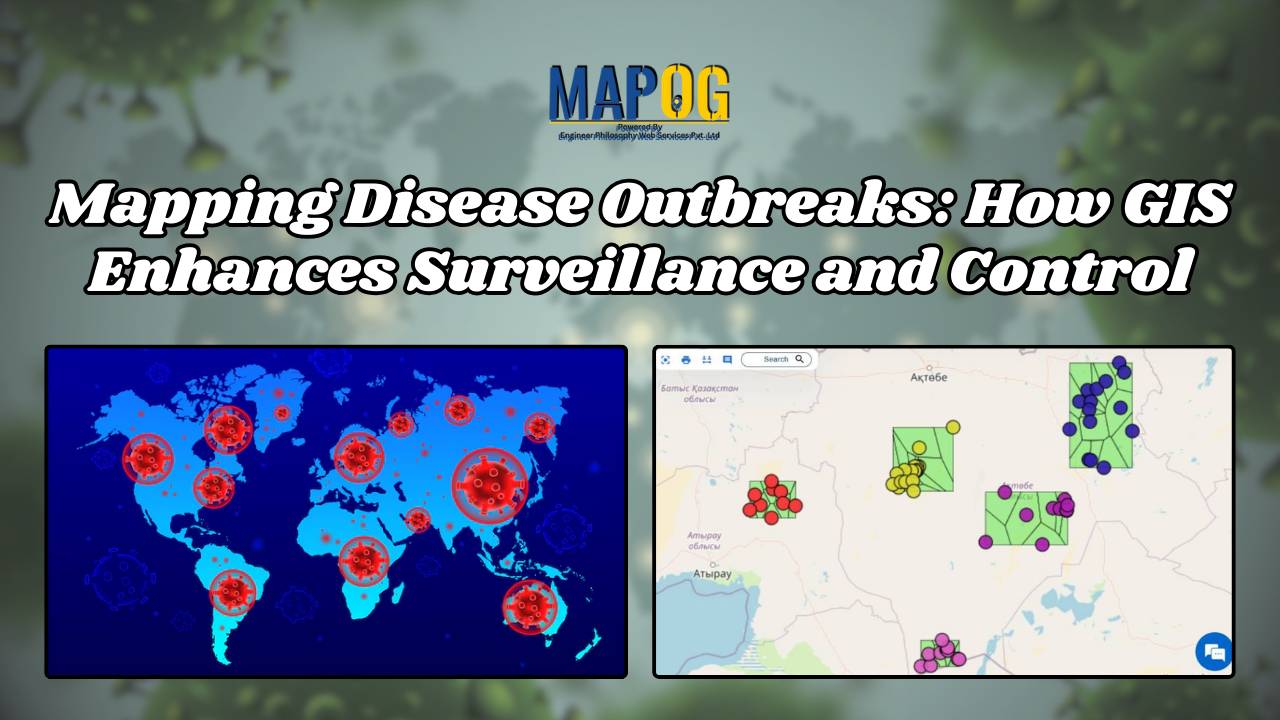
In recent years, the importance of disease surveillance has been underscored by various global health challenges, including pandemics and emerging infectious diseases. Disease surveillance plays a pivotal role in public health management, enabling the timely detection, monitoring, and control of infectious diseases. MAPOG is a powerful tool for health authorities to augment traditional surveillance methods. … Read more
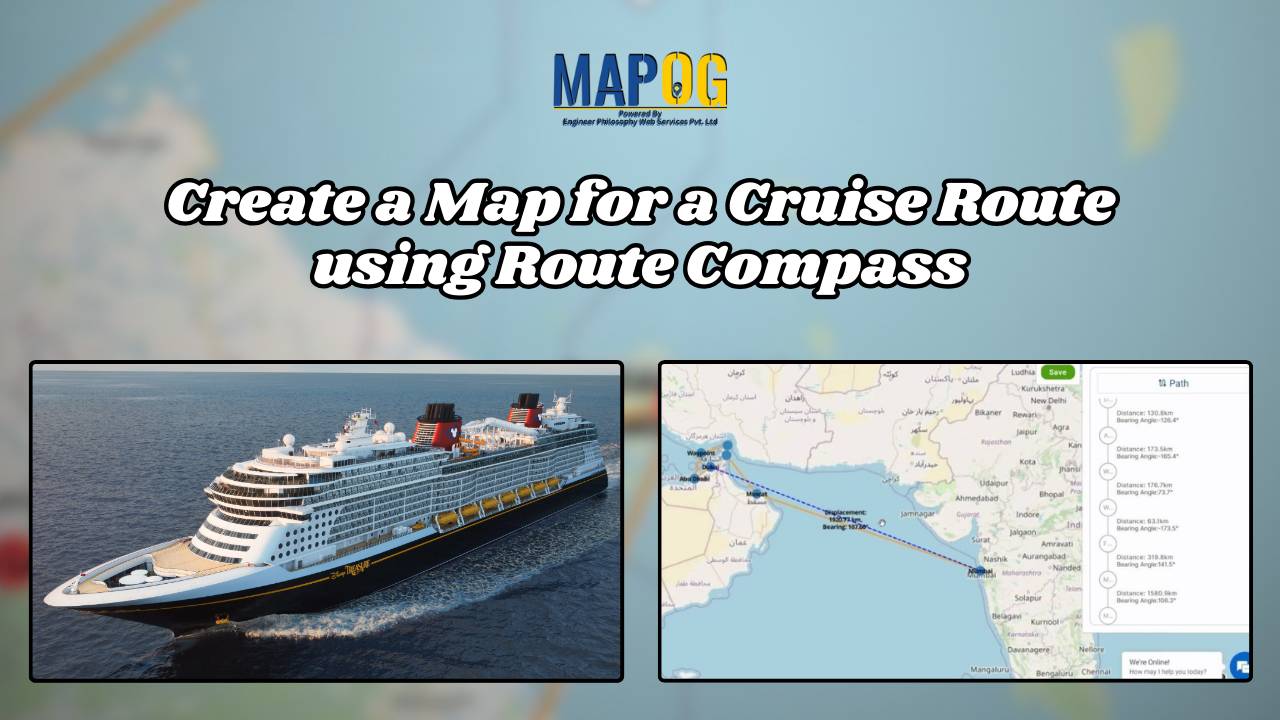
Embarking on a cruise journey entails meticulous planning and navigation along the designated route. Leveraging MAPOG Route Compass, we unveil a streamlined solution for mapping cruise routes with precision and ease. In this use case, we delve into the intricacies of cruise route mapping using MAPOG, illuminating its efficiency in navigation and its utility in … Read more
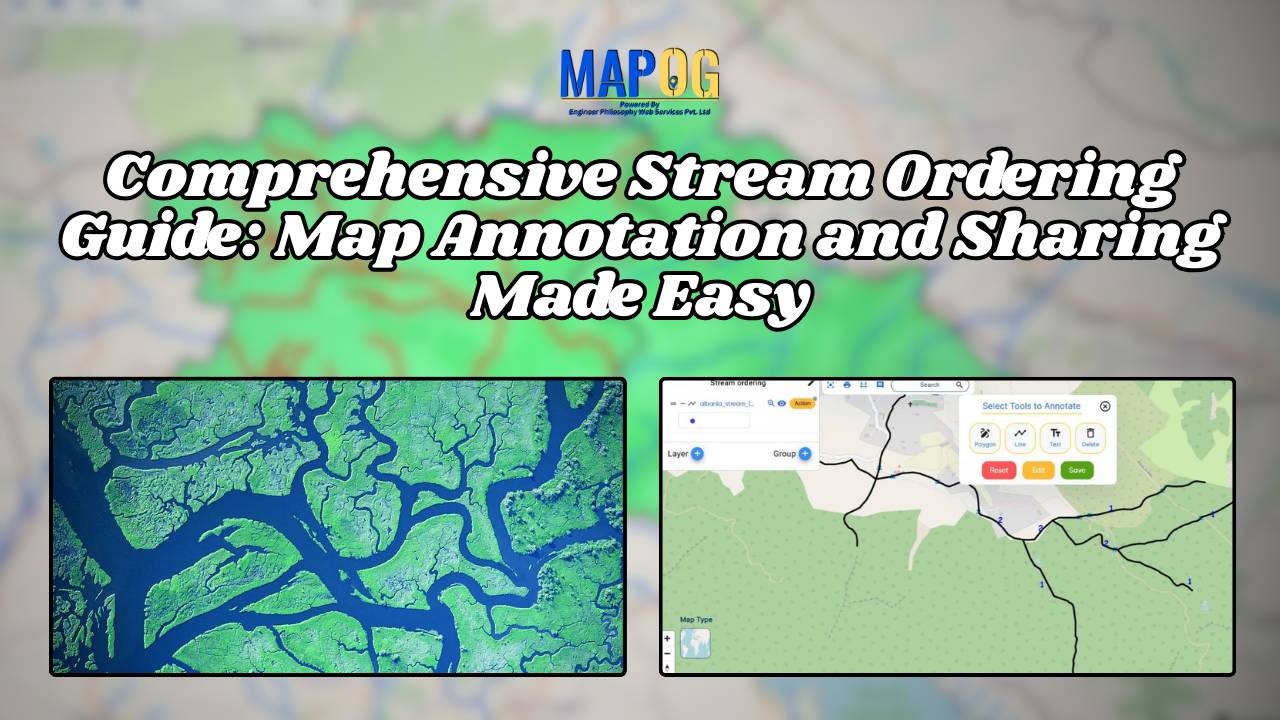
The accurate mapping of stream orders is crucial for various applications, from environmental management to infrastructure planning. MAPOG, a leading GIS platform, offers a powerful text annotation tool designed to streamline this process, significantly enhancing efficiency and accuracy. Explore this article to enhance your knowledge in Renewable energy- Create Map – DIGITIZING SOLAR, HYDROELECTRIC, WIND … Read more
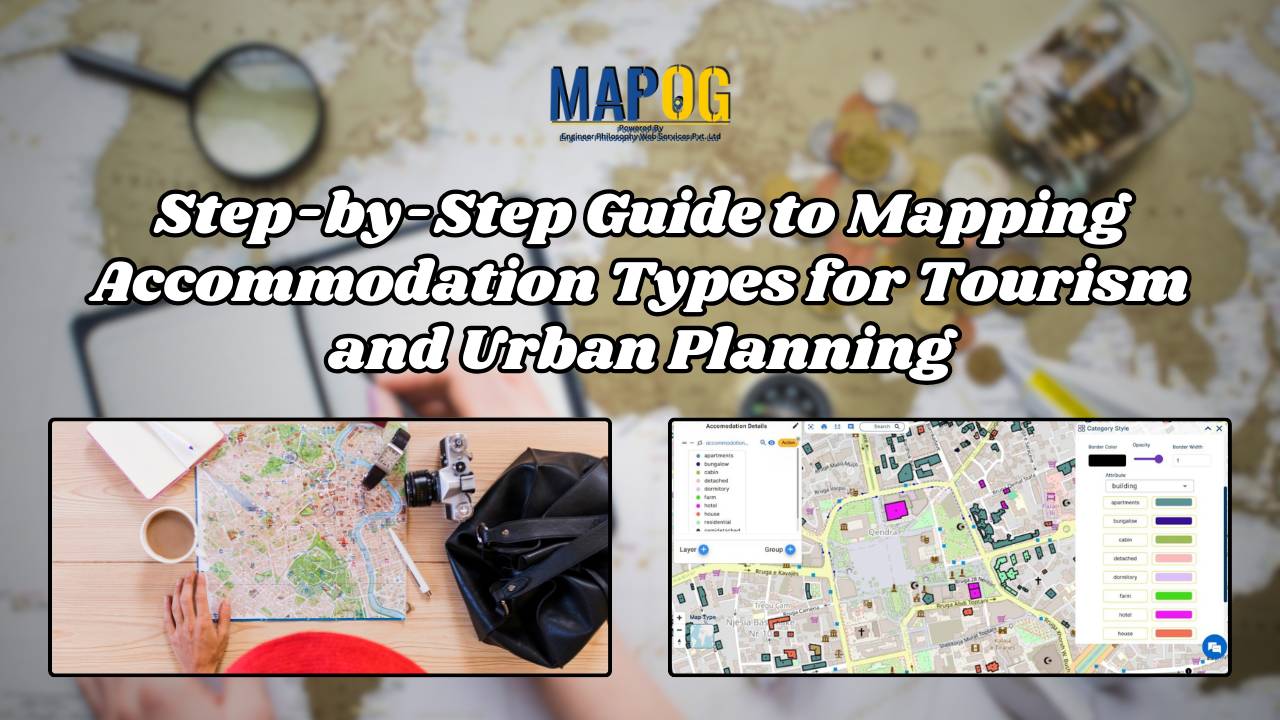
In today’s digital age, mapping accommodation types has become an essential tool for travelers, city planners, and businesses alike. By utilizing MAPOG’s category style feature, we can represent each accommodation type with variant colors, simplifying the process of identifying and understanding the diverse range of accommodations available. If you are interested in habitat mapping, then … Read more