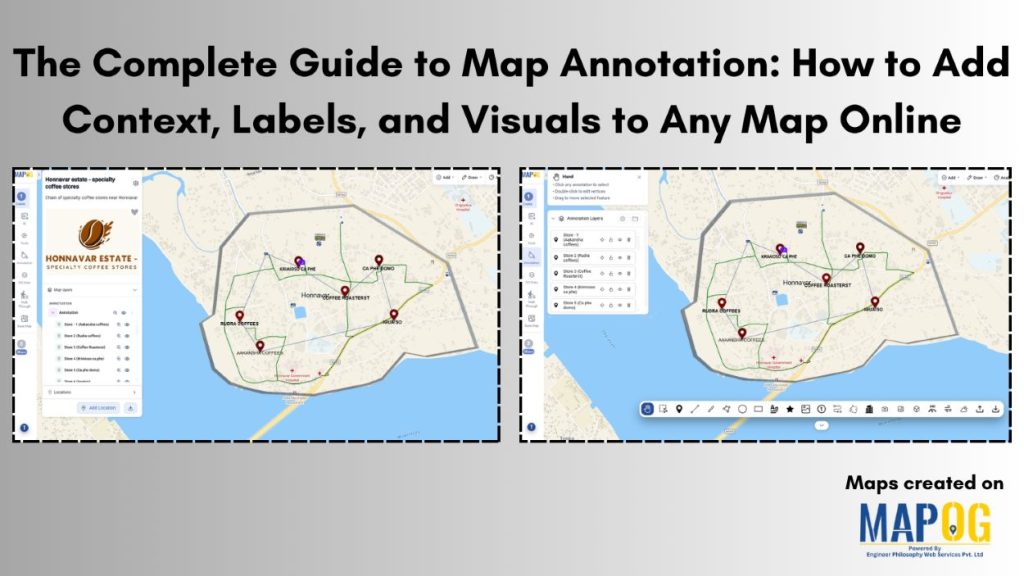
From specialty coffee store locations to infrastructure projects, communicating spatial information is often frustrating when maps don’t clearly highlight what matters most. Property boundaries, nearby amenities, delivery routes, and planning zones can be difficult to interpret without additional context. This is where map annotation tools make a difference. With MAPOG, you can add labels, notes, markers, drawings, and visuals directly onto maps, which transform geographic data into clear and engaging insights.
Key Concept of the Map
The key concept of complete guide to map annotation is to add meaningful context to geographic data, making locations easier to understand and explore. For example, a map showing specialty coffee shops within a neighborhood can include custom markers, labels, and notes that highlight unique offerings, helping users quickly discover and compare cafes in the area.
Step-By-Step process of map
Step 1: Create map
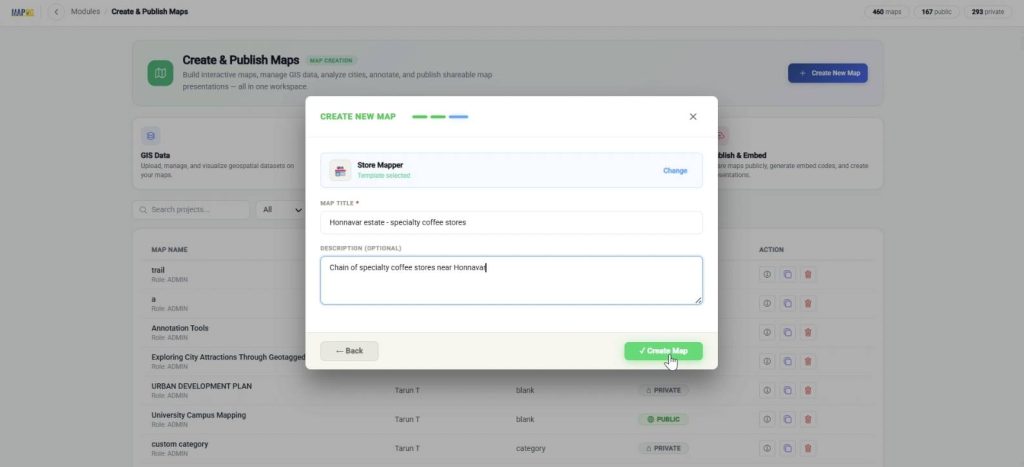
Go to MAPOG and select Create & Publish Maps.
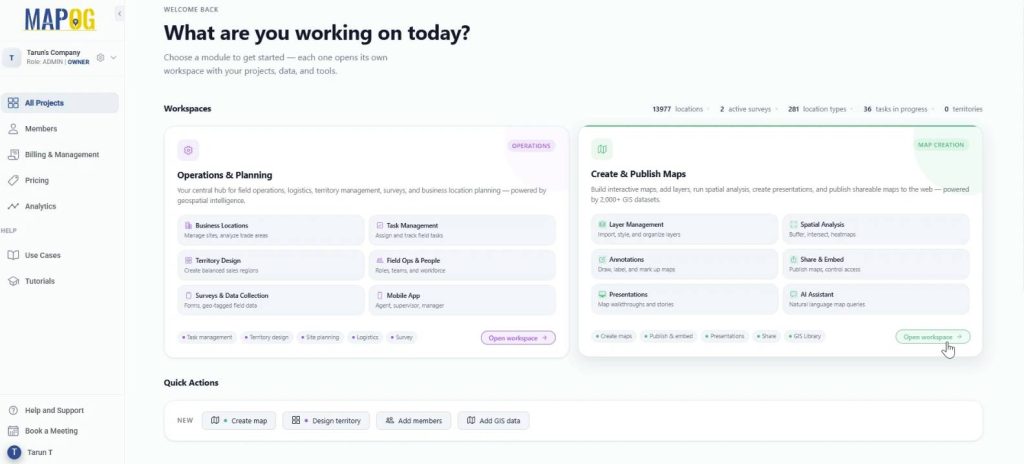
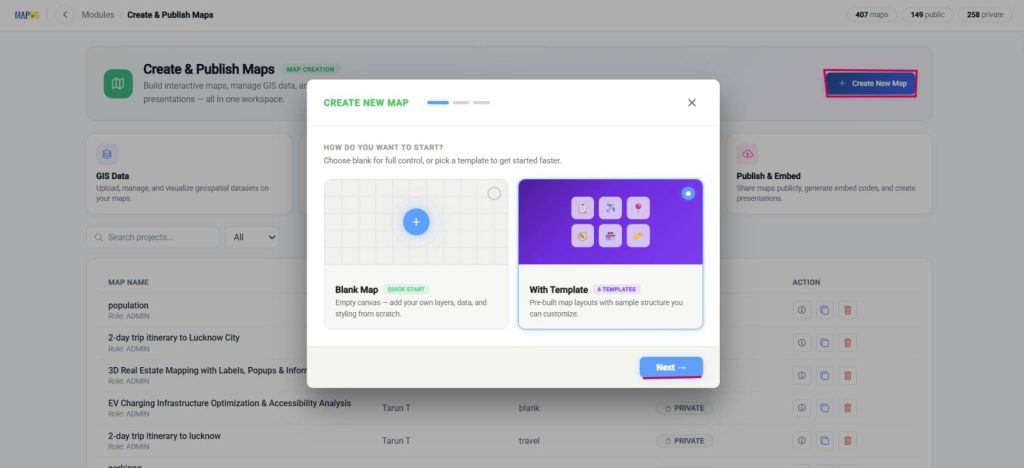
Afterward, select Create new map, With template and press next.
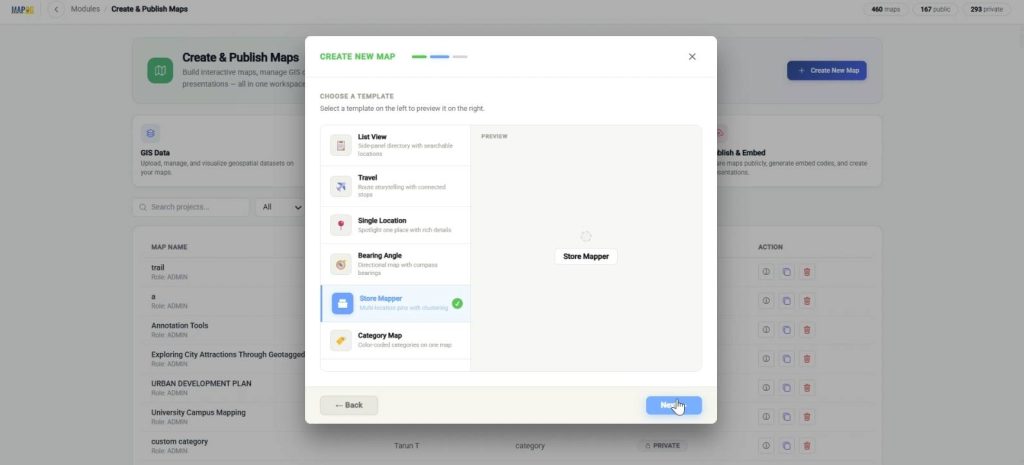
Further, choose the store mapper template.
Finally, add title and description and Create map.
Step 2: Upload logo
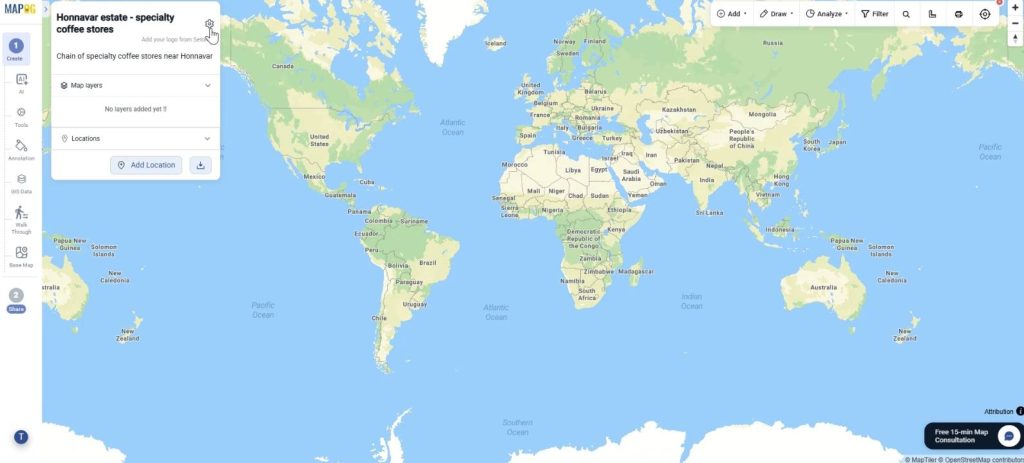
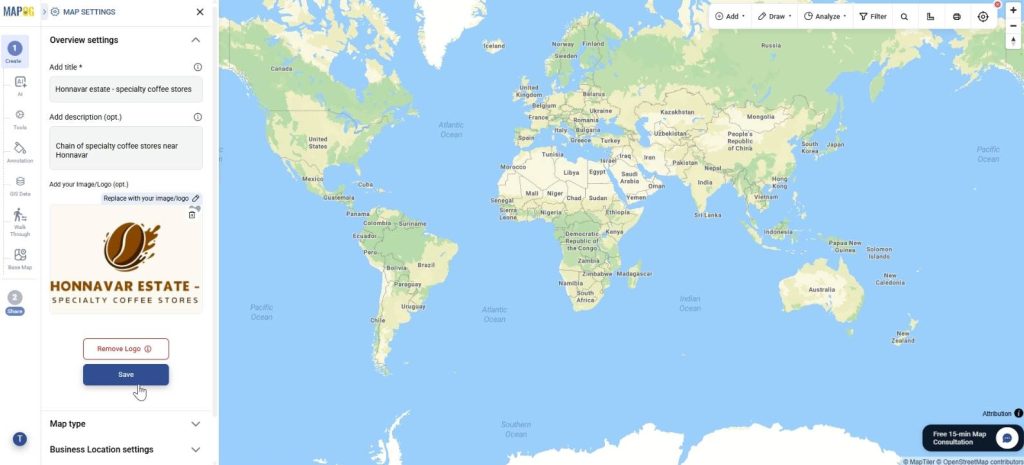
Further, to upload your company logo for a professional look, go to map settings.
Upload map logo and save.
Step 3 : Search location
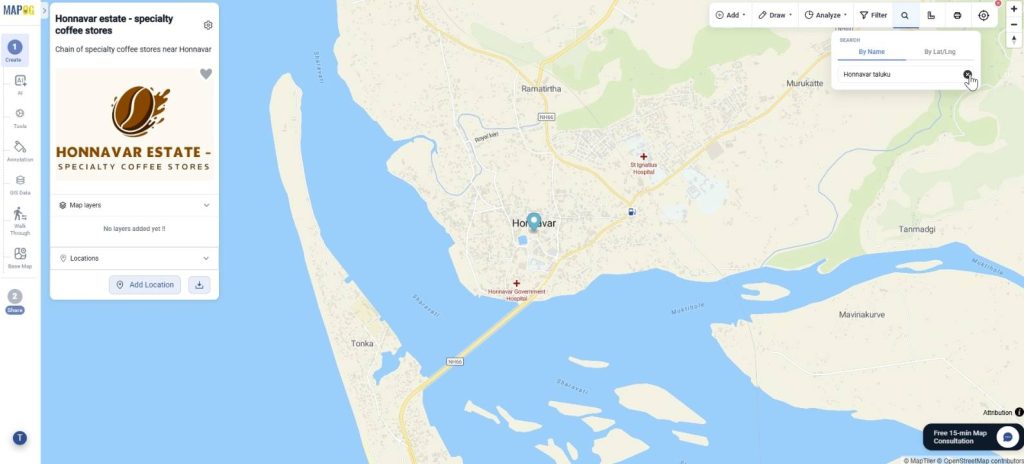
To locate your preferred area on the map, go to search in the toolbar and search by name or by coordinates.
Step 4 : Arrange cafes with the annotation tool
Further, click the annotation tool on the left panel. In this complete guide to map annotation, explore whatever tool you want for your map and apply it.
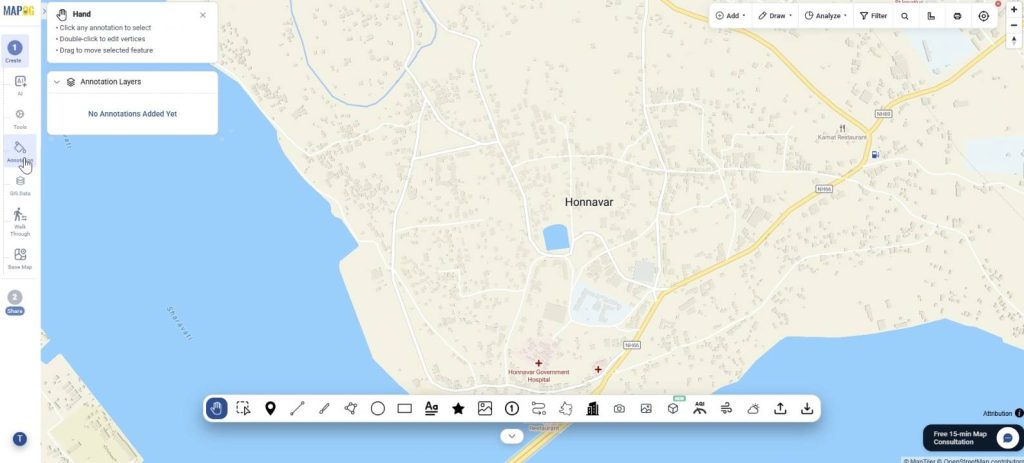
The Point Tool
This can be used for pinning the store locations exactly on the map. Simply click to place on the map. Optionally, give it a name and edit colour. Afterward, you can rearrange any tool using the hand option on the extreme left.
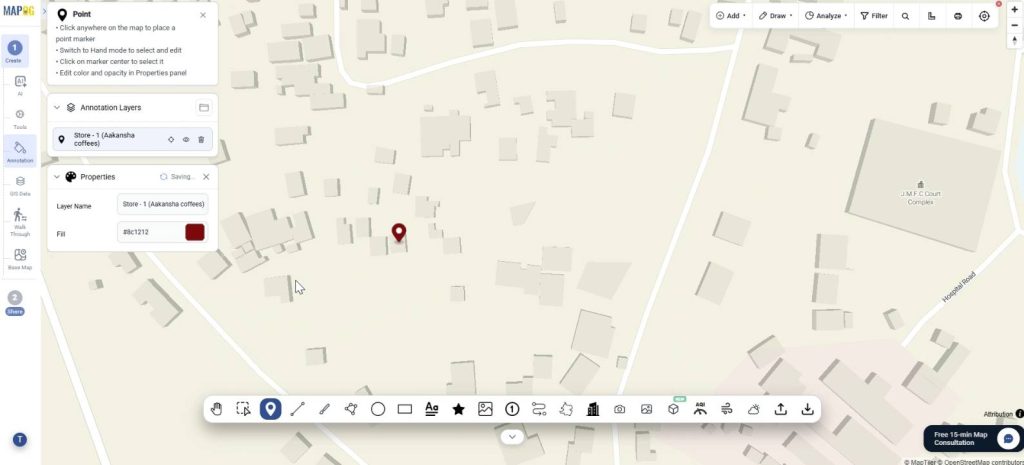
The Polygon Tool
This tool can be very useful in delineating the boundaries of any cafe for great visualization. Just click on all corners of the area and double click to save. Further, customize name colour, opacity etc.
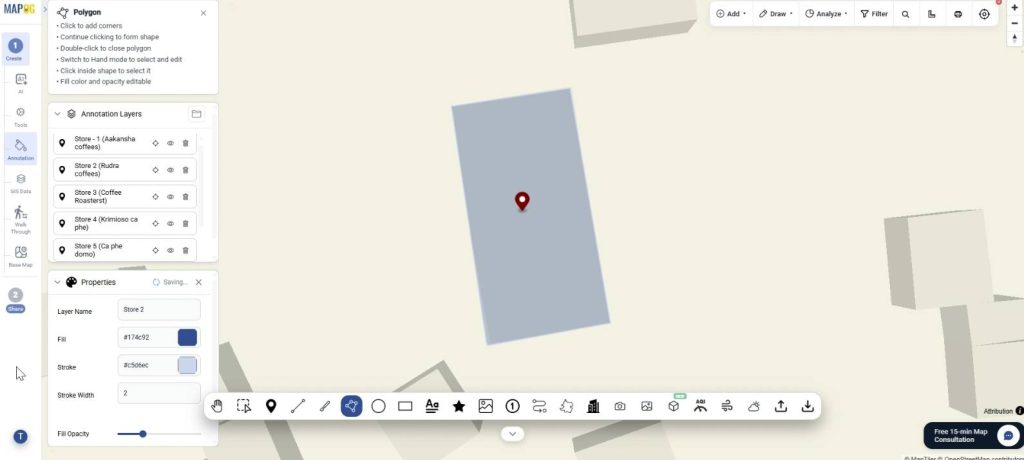
The “Shape” Tools
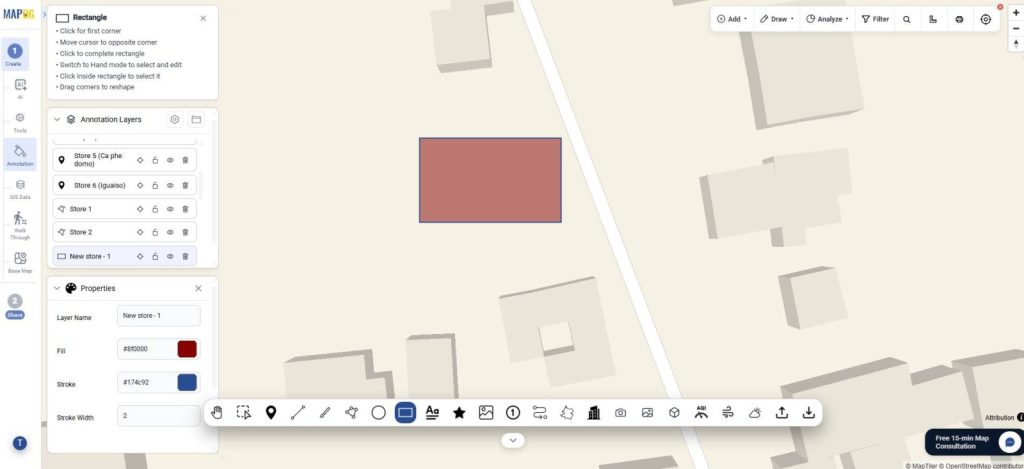
These include the rectangle, circle and line tool as well and can be used to demarcate certain areas or highlight things.
The rectangle can be used to show the location of upcoming cafes, just click for the first corner and stretch it out. You can use the hand tool to adjust it and further edit the color and name.
The circle tool can be used for representing an area which is a prospective for a new cafe. Just click on the area and move the cursor to adjust the radius. Click to finish it and adjust color, position accordingly.
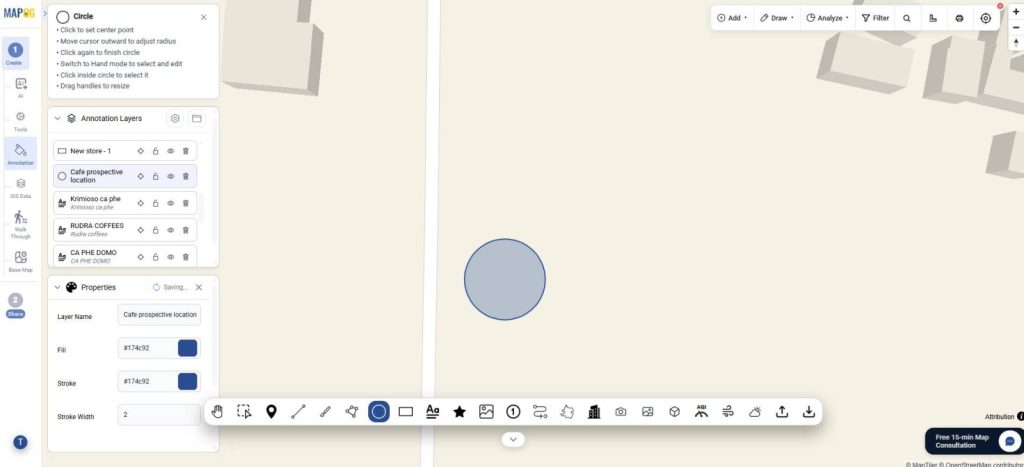
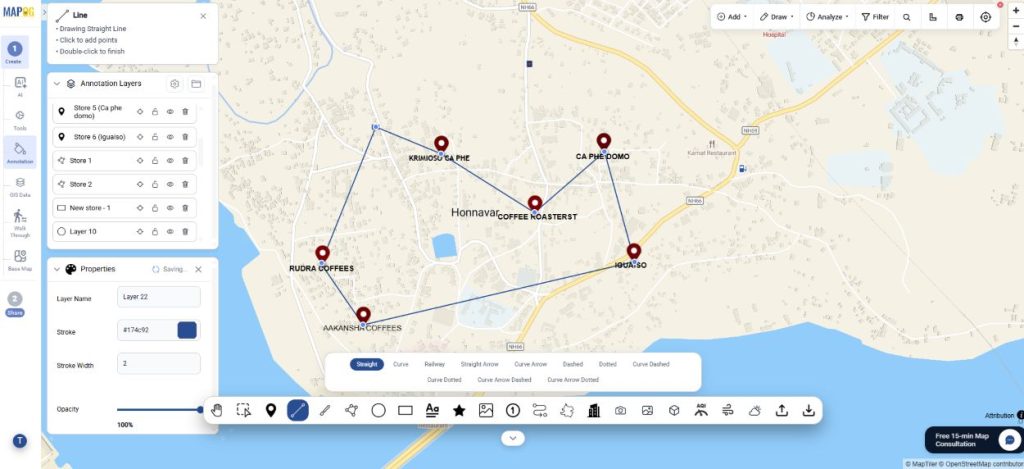
Similarly, the line tool can be used to connect all the specialty cafes. Simply click on all points and draw the points you want to connect. You can choose from a variety of lines such as dotted, straight, curved, etc.
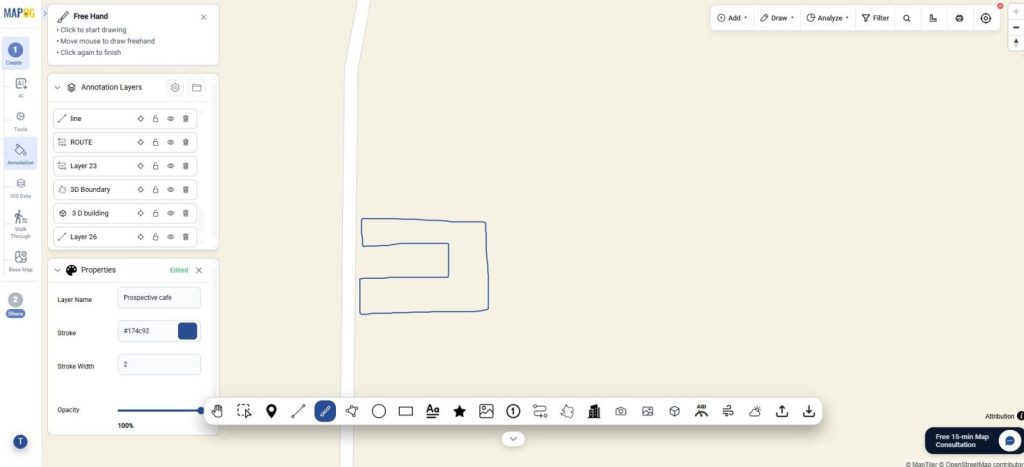
Optionally, you can use the free hand tool and draw any shape of your choice to represent important cafe prospects.
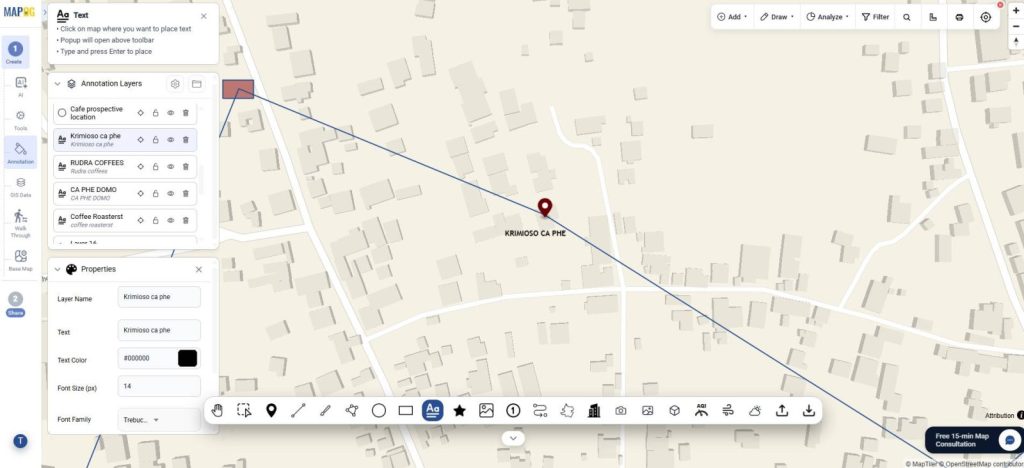
The Text Tool
This tool can be used to mark the names of all locations and explain the different elements of the map, just click on the map where you want to place the text and type. Further, you can edit the font, colour, size of the text.
The Icon Tool
Further, you can use the icon tool to visually represent the nearby locations such as aesthetic selfie points or natural beauty near cafes. There are different categories of icons to choose from such as scenic, selfie points or pet cafes.
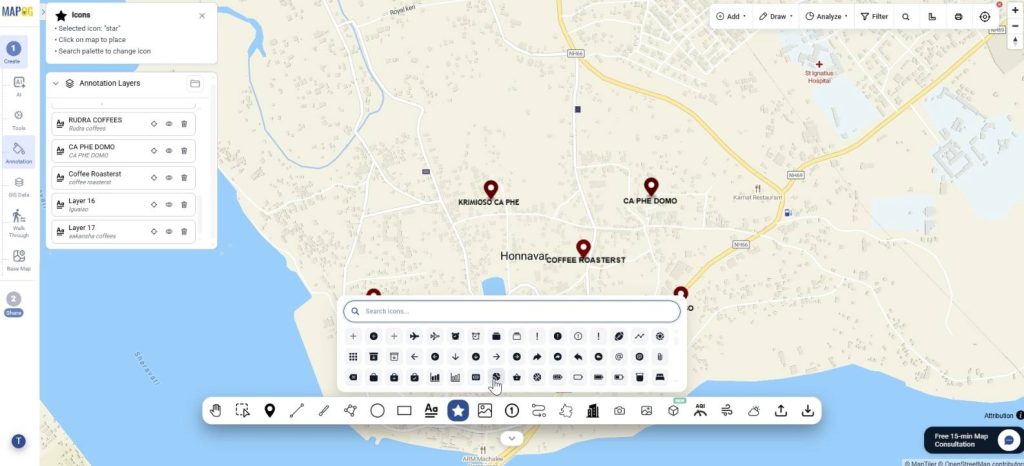
Afterward, you can edit the colour, size, etc.
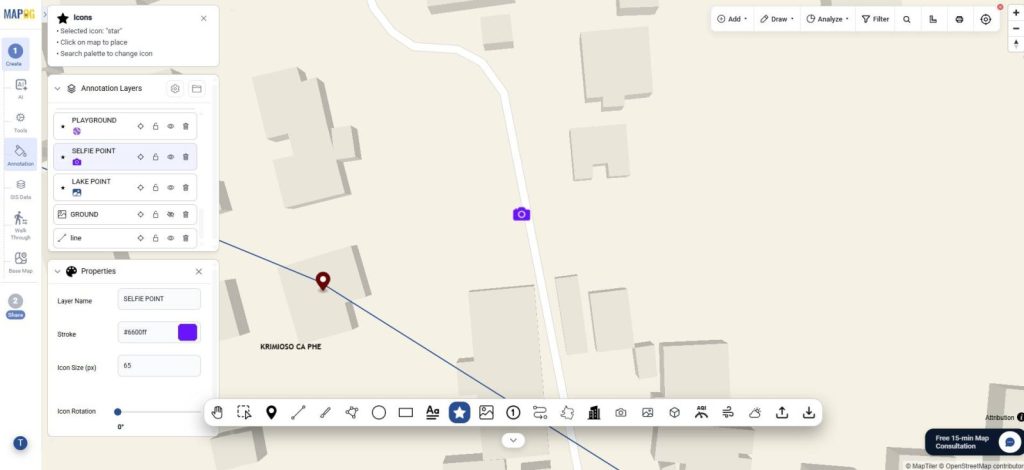
The Image Tool
Go to the image tool to add images for visual representation of the area. Click the image tool, browse & upload image.
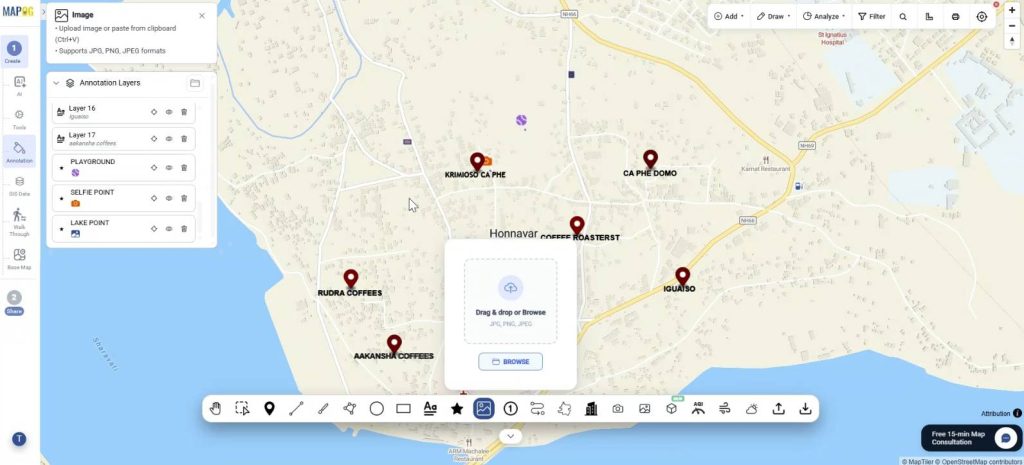
Then, draw an area of the image where you want to place it. Afterwards, you can adjust the image by rotating, scaling, etc.
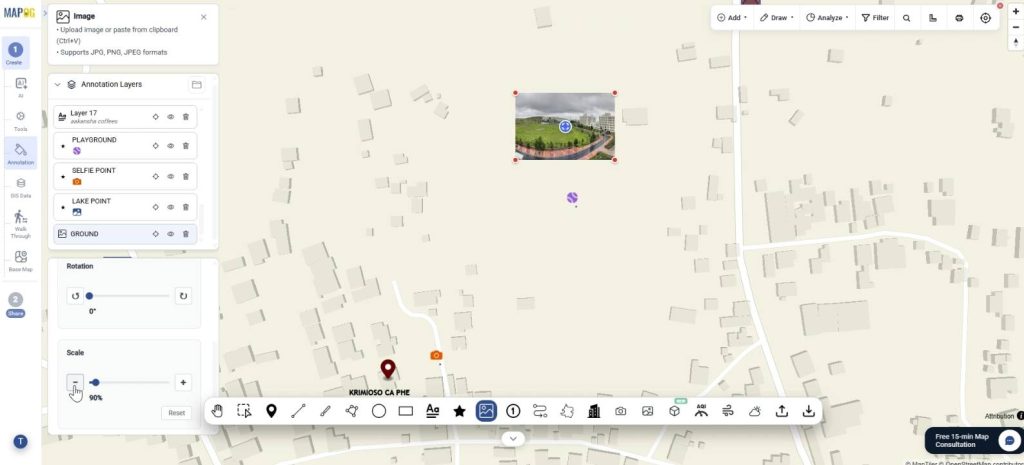
The Marker Tool
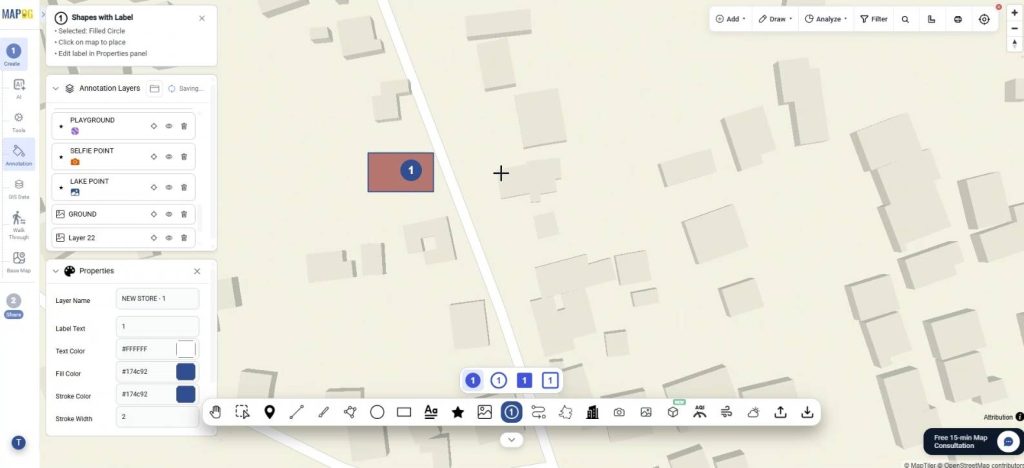
You can use the Shapes with labels to mark locations. Simply click on the map where you want to label something and choose the shape as circle or square. Then, you can edit the label text, location, colour, etc.
The Route Line Tool
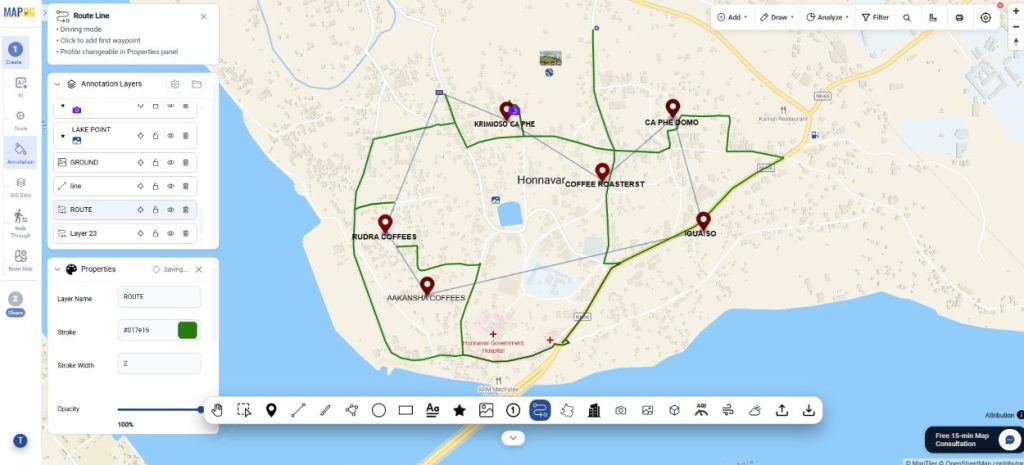
You can use the route line tool to show the routes connecting the cafes. Just click all the points where you wish the route to appear and double click to finish. Finally, an entire route line will appear.
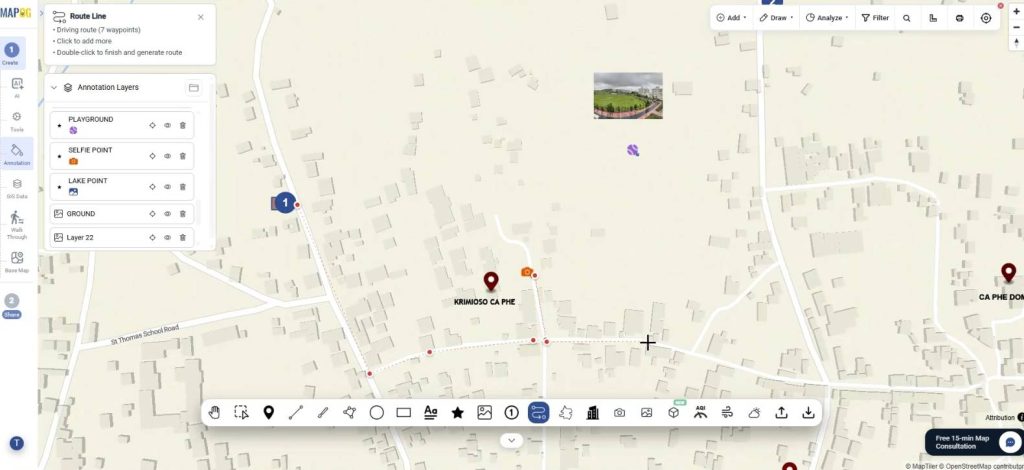
Afterward, you can change the colour, opacity, etc
3D Boundary tool
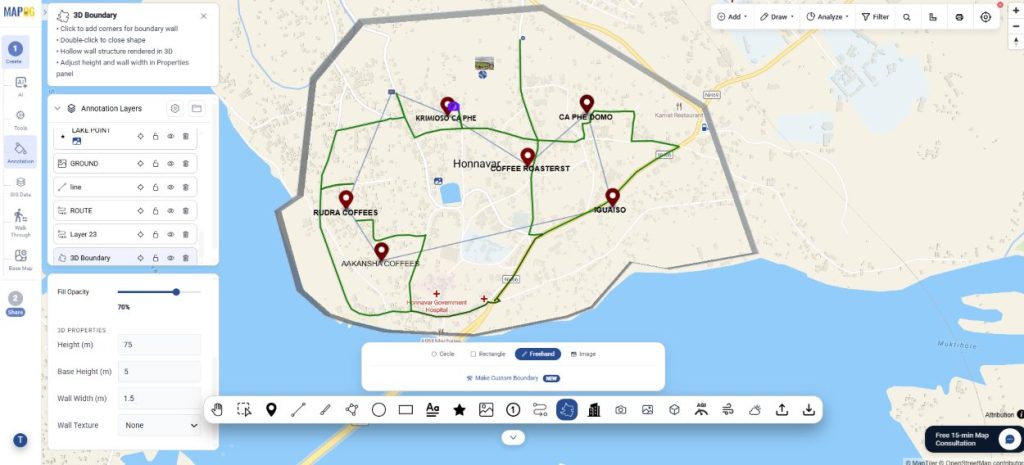
Further, you can use the 3D boundary tool to delineate your entire area of interest for specialty coffee hub and cover it in a 3D boundary. Just choose the tool and draw using the free hand or other options. You can adjust the height, base height, wall texture, etc.
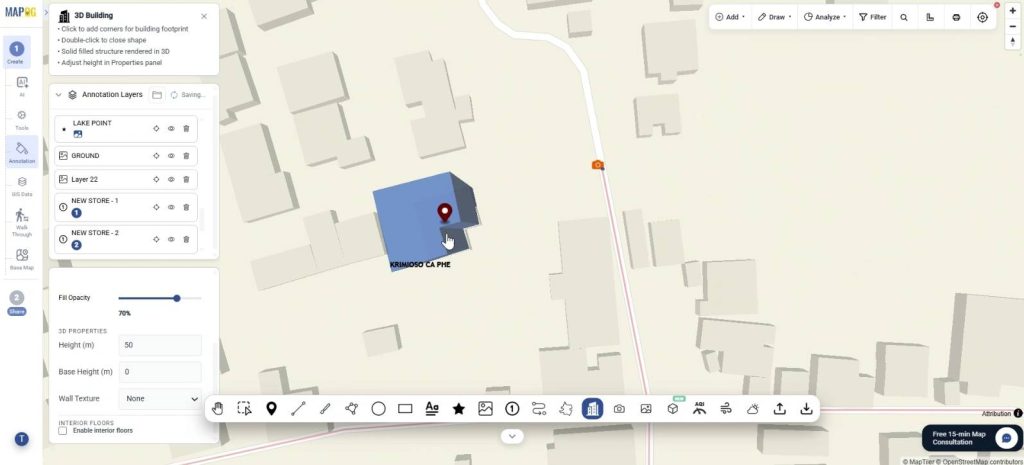
3D Building tool
Next, the 3D Building tool can be used for making the cafe structures easy to visualize in 3D form. Click on all corners of the building and double click to finish.
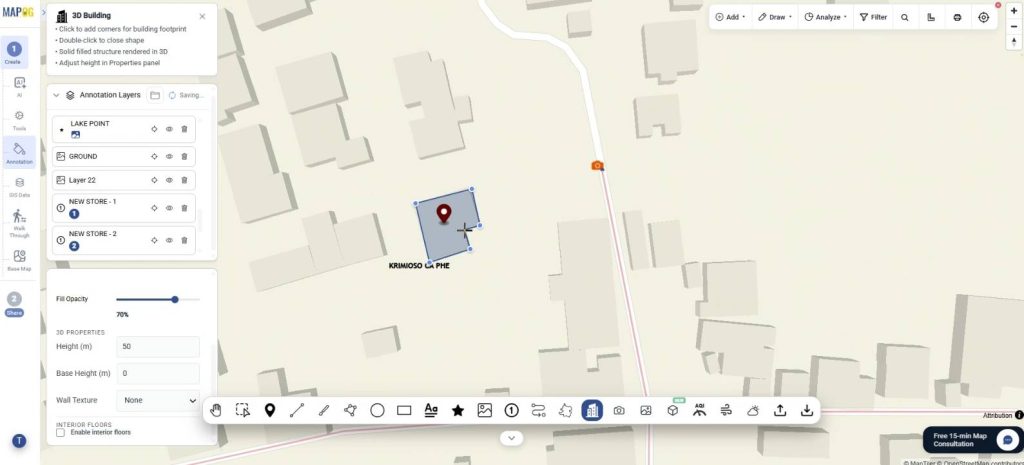
You can edit the features such as height, colour, etc.
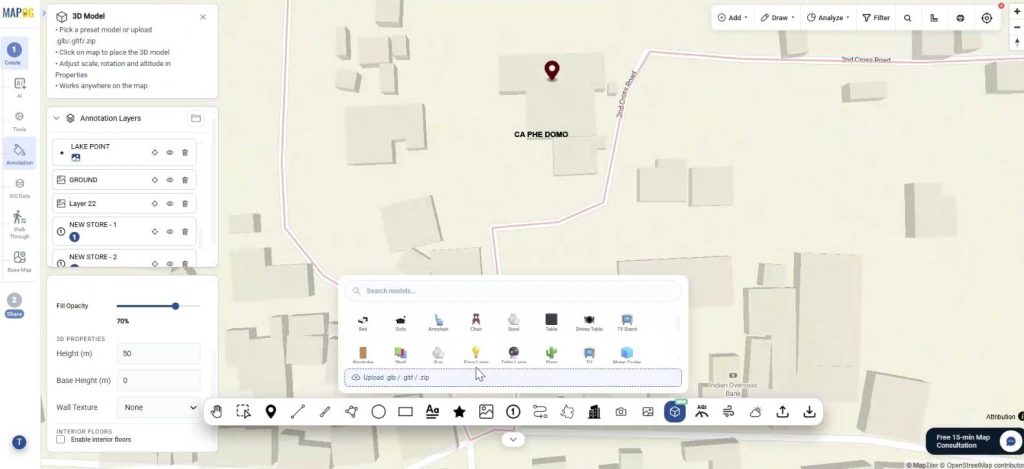
3D Model tool
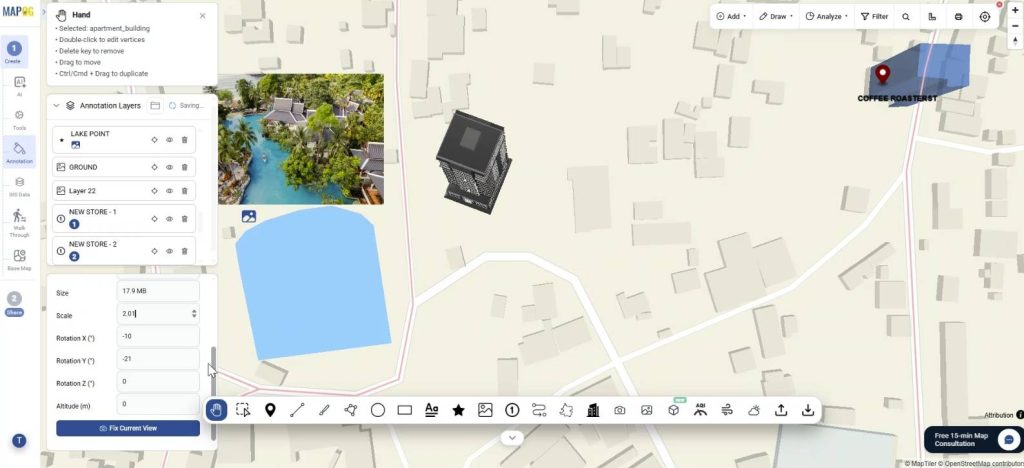
Further, you can add 3D Building models in .glb, .gltf, .zip format to enhance your map. Upload your 3D model and click to place it on the map.
You can adjust the building by rotating it along the axes, by size, scale, etc.
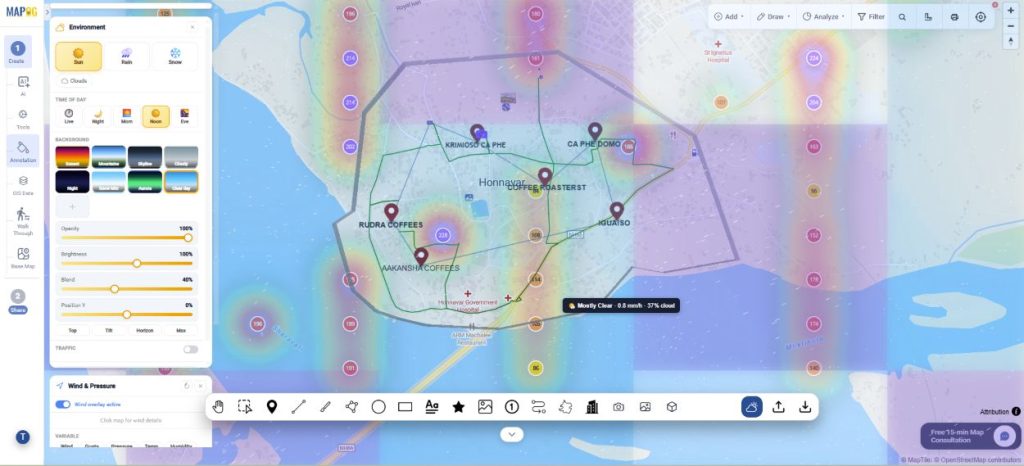
Air quality, Wind & pressure and Environment tools
You can enable the air quality, wind pressure and environmental tools to let people know the weather forecast of the area.
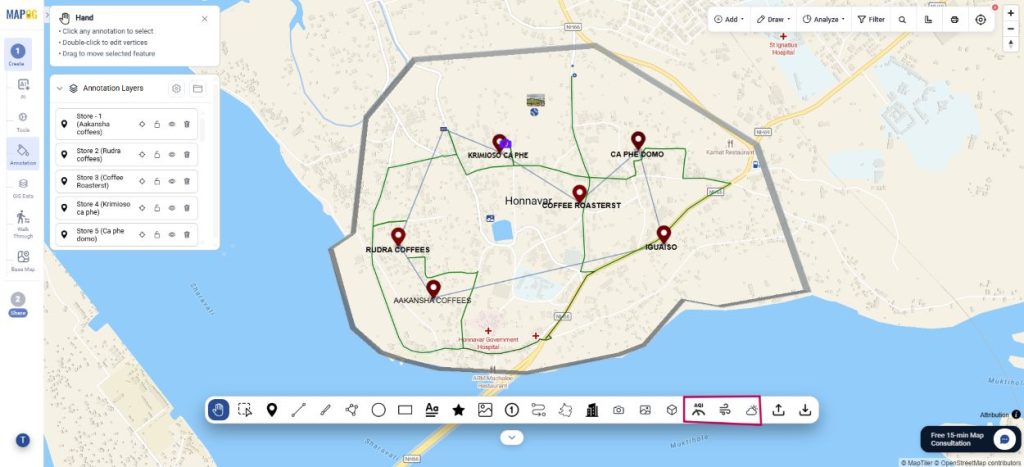
Further, enable all the tools and it will show on the map.
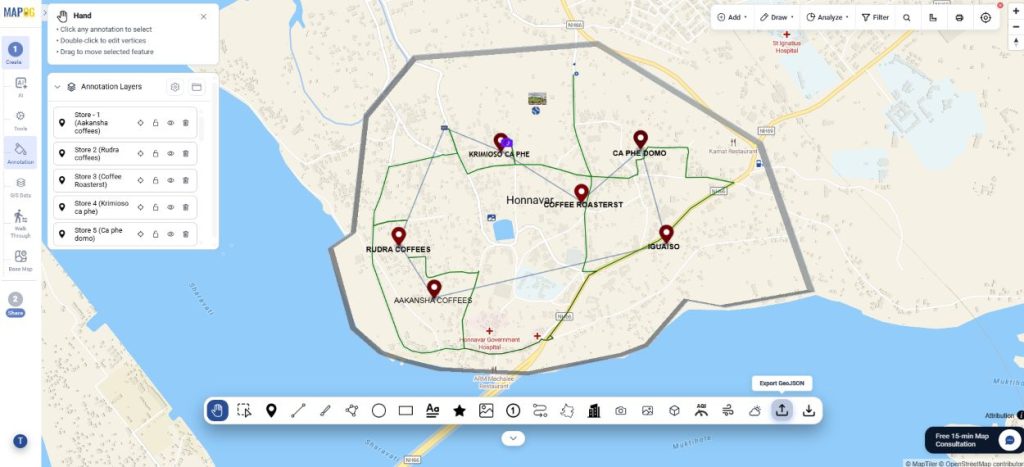
Import and export GeoJSON
Export map annotation features as GeoJSON to share cafe locations, routes, and delivery zones for backup, integration, and GIS analysis.
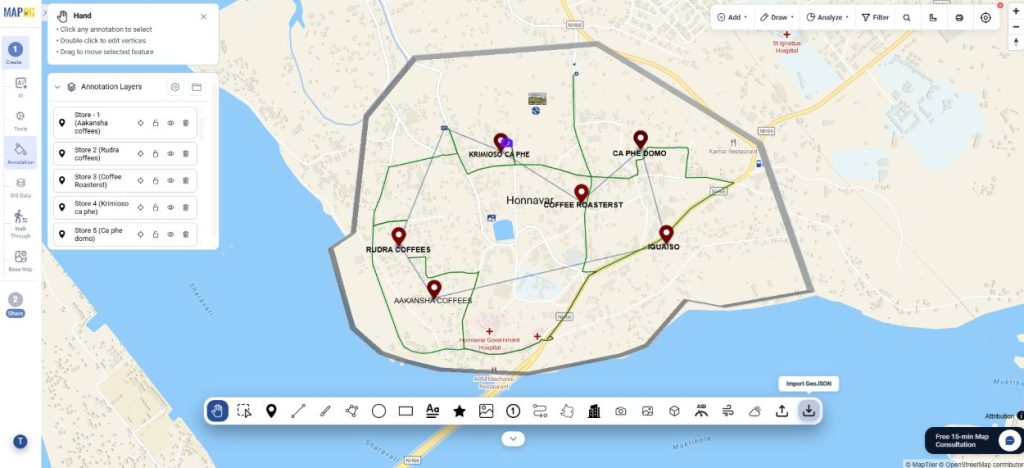
Import GeoJSON files to quickly add cafe locations, routes, territories, and service areas for mapping and spatial analysis.
Step 5 : Preview and share
Finally, go to Preview and share. Set your map to private or public depending on your audience.
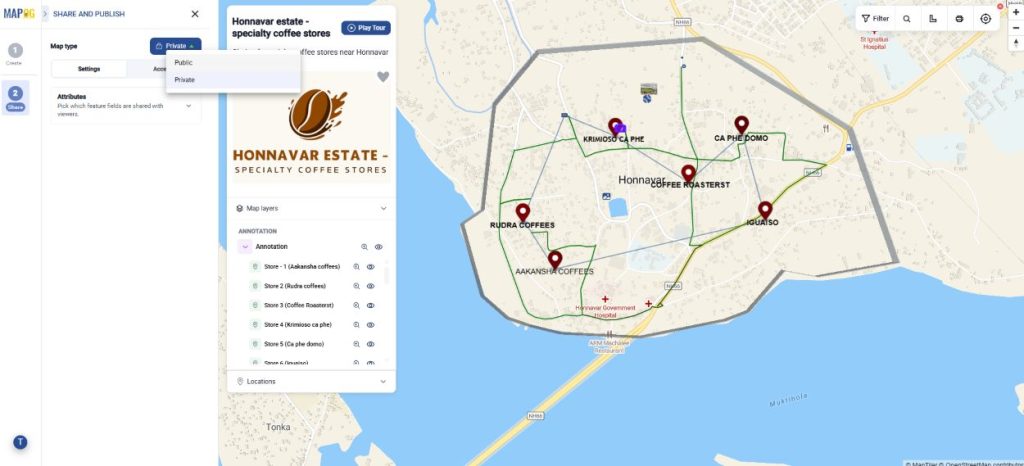
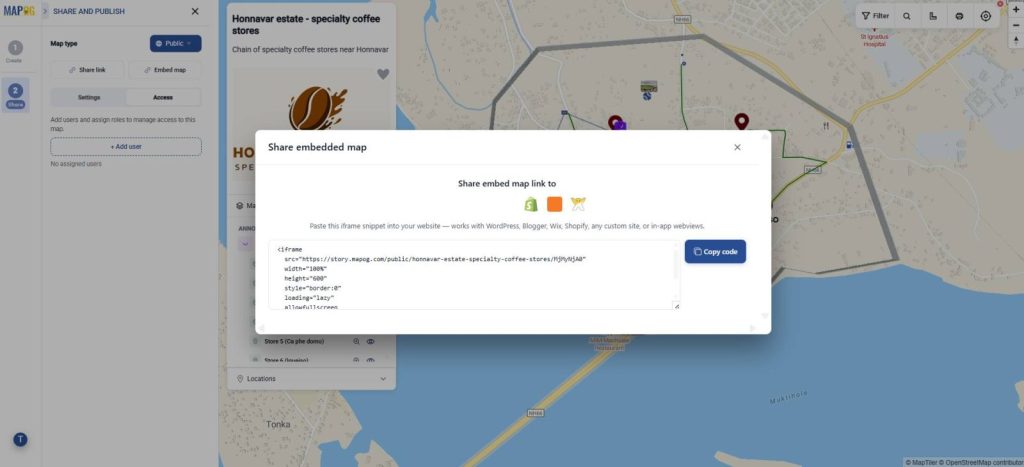
You can add users and assign roles for collaboration. Share via link or embed it on websites
Industrial Benefits
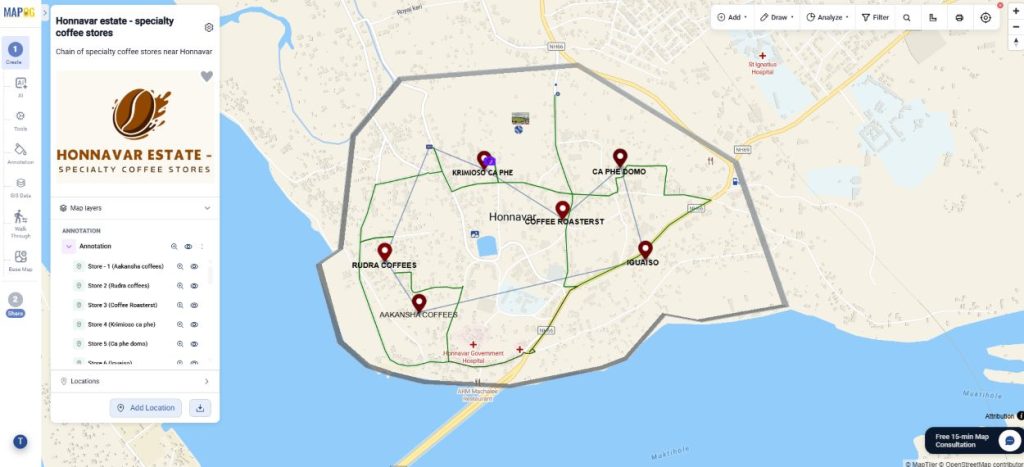
Across industries, the ability to add context directly onto maps helps teams communicate spatial information more effectively. Complete guide to map annotation can be used to highlight assets, project boundaries, service areas, delivery routes, inspection points, and nearby facilities, making complex geographic data easier to understand. From construction and infrastructure planning to real estate, logistics, and field operations, annotated maps improve collaboration, support informed decision-making, and streamline day-to-day workflows.
Conclusion
Complete guide to map annotation enhances geographic data by adding context, clarity, and visual meaning. Whether highlighting locations, routes, or project areas, annotations make maps easier to understand, communicate, and use for informed decision-making.