Traditional datasets mix property types, reducing spatial clarity and slowing analysis. MAPOG solves this by converting data into an interactive map with separate Residential and Commercial Properties layers, enabling clear visualization and smarter planning.
Key Concept: Residential and Commercial Properties
Instead of combining all properties, assets are grouped into separate map layers. Residential and commercial properties appear independently, enabling focused analysis while keeping a unified view.
What Is Residential vs Commercial Properties Mapping?
In simple terms, it’s a GIS-based approach where properties are classified by usage and shown on separate layers, helping users understand how residential and commercial zones are distributed.
Methodology: Mapping Residential and Commercial Properties
Separating property types simplifies analysis and improves planning.
1. Create Your Location type
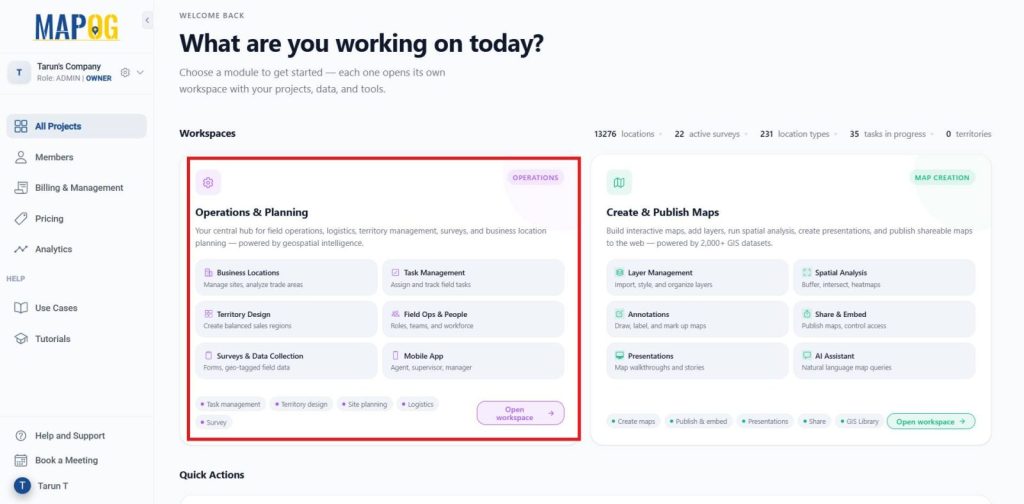
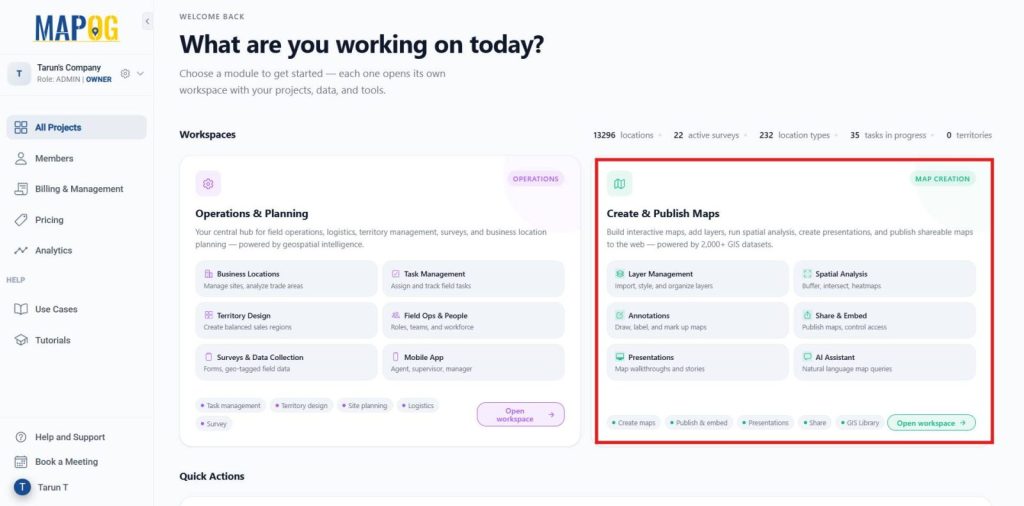
Launch MAPOG, navigate to Operations and Planning, and then select Open Workplace.
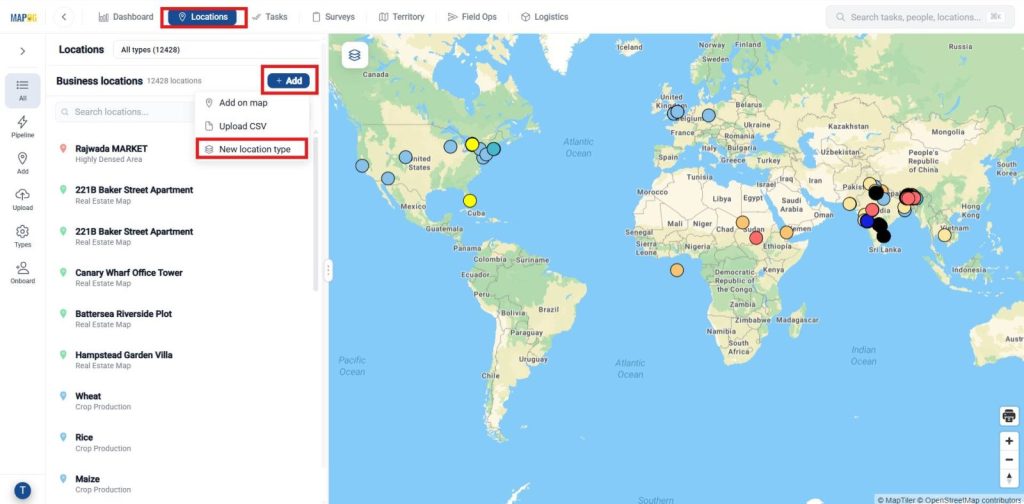
Within the workspace, go to the Location option from the dashboard at the top, click +Add, and then choose New Location Type.
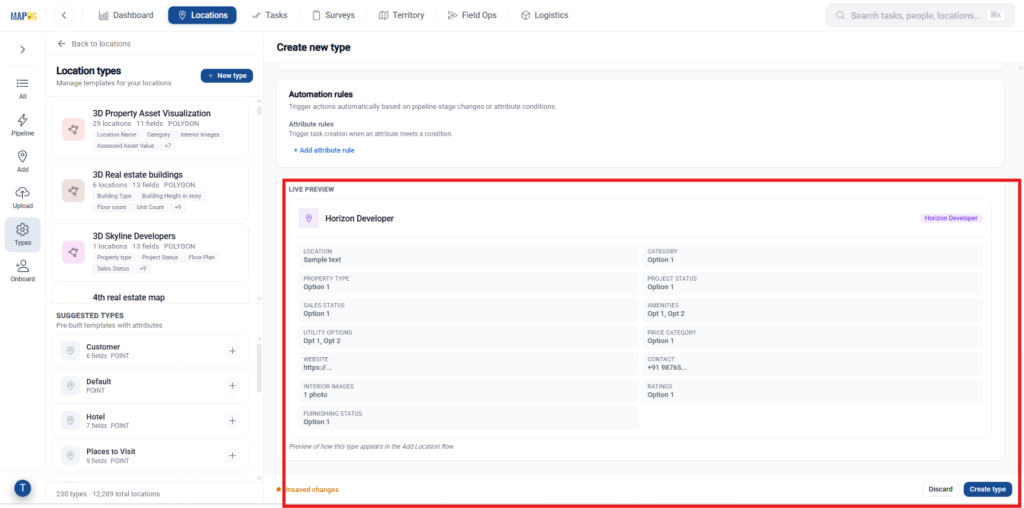
Additionally, Enter basic settings like Name, choose a color, and set geometry type to Point. Then add attributes to capture property data.
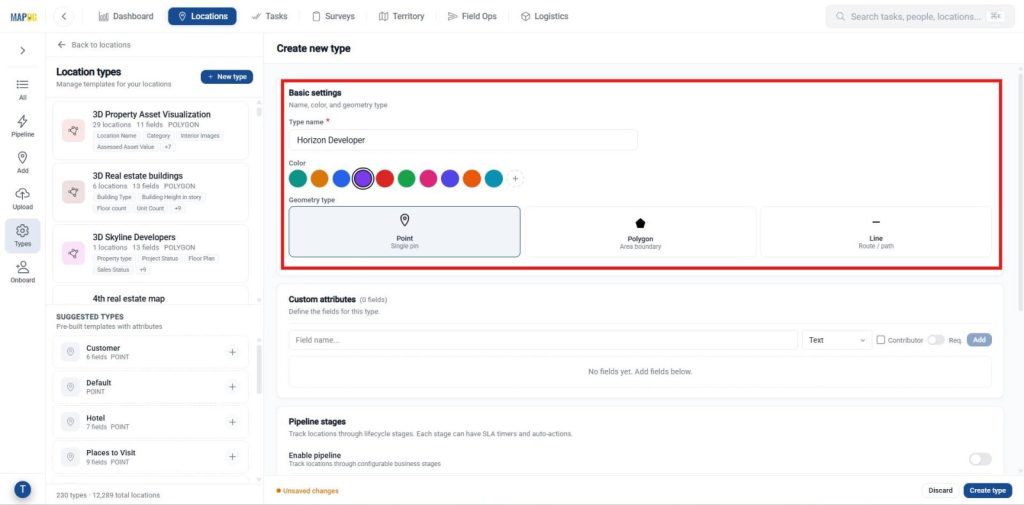
Include custom attributes like Location, Property Type, Price Range, Ownership Status, and Amenities. Set field types as needed, mark key fields required, and enable contributor access if needed.
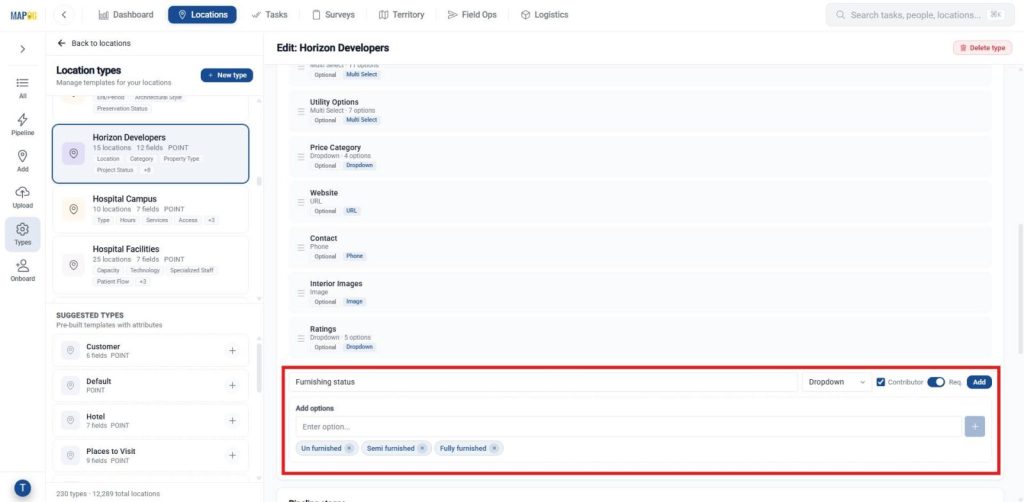
After adding all attributes, use Live Preview to review them, then click Create Type to create a new one.
2. Add Property Location Information
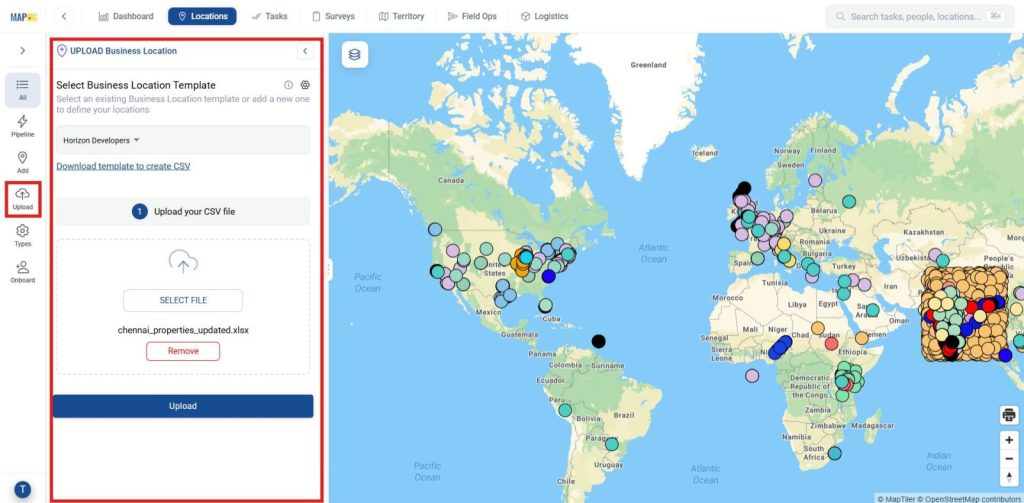
Go to Upload, select your Business Location Template from the dropdown, then use Select File to upload your CSV.
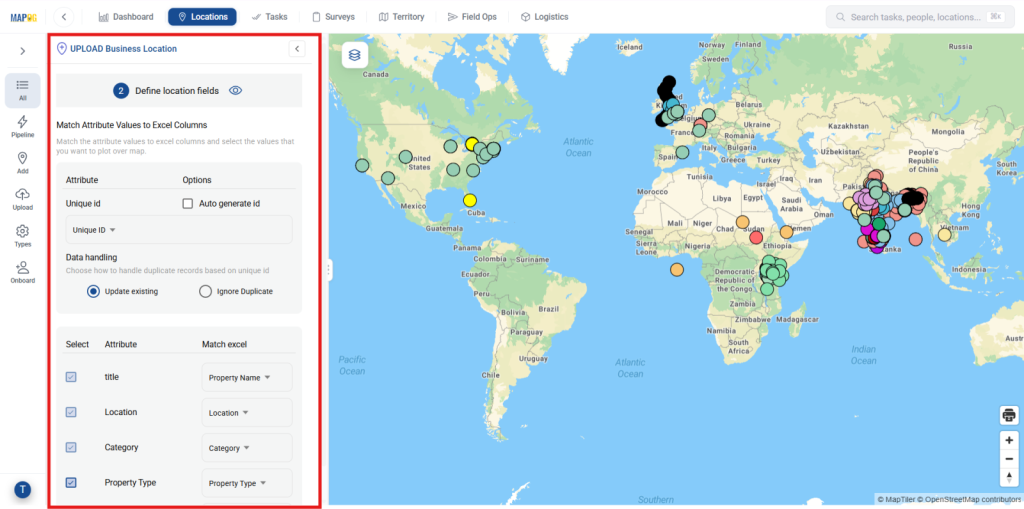
In Define Location Fields, map attributes to Excel columns and choose visible fields. Use a Unique ID for syncing or Auto-Generate ID, and set duplicates to Update Existing or Ignore.
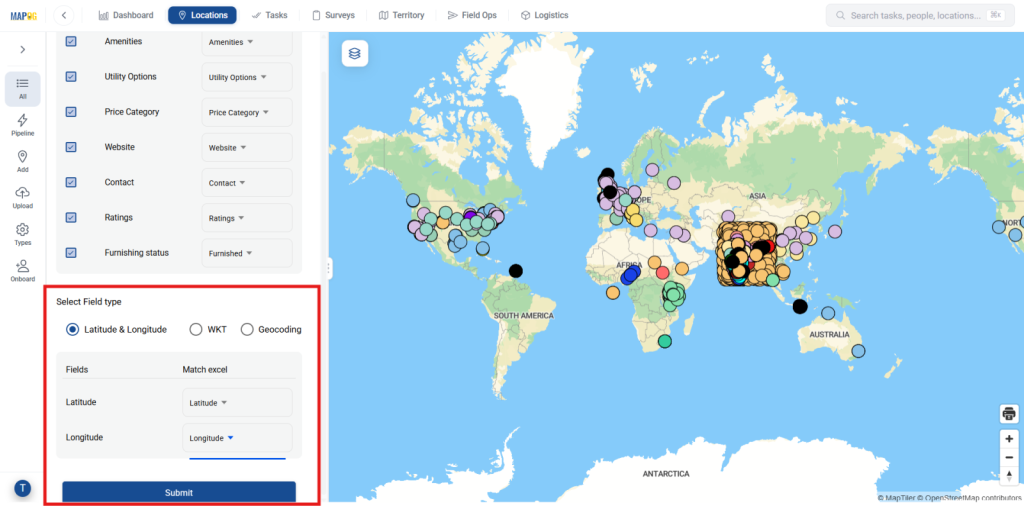
Assign the Latitude and Longitude fields correctly, then click Submit to complete the setup.
3. Adding Location Information
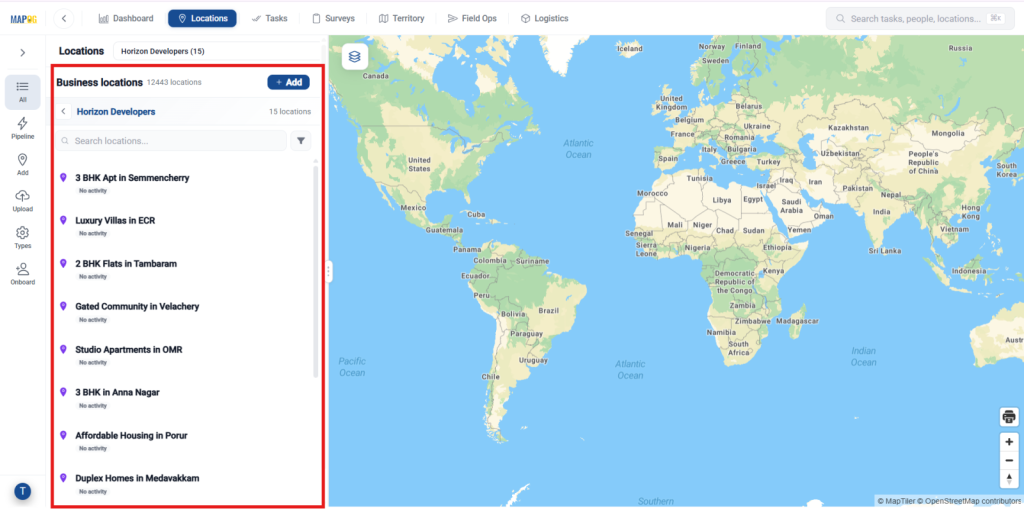
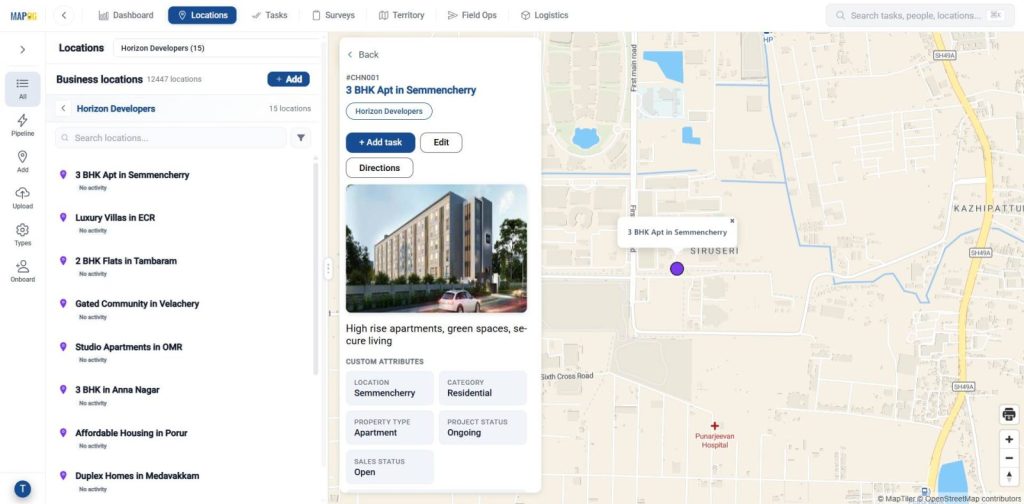
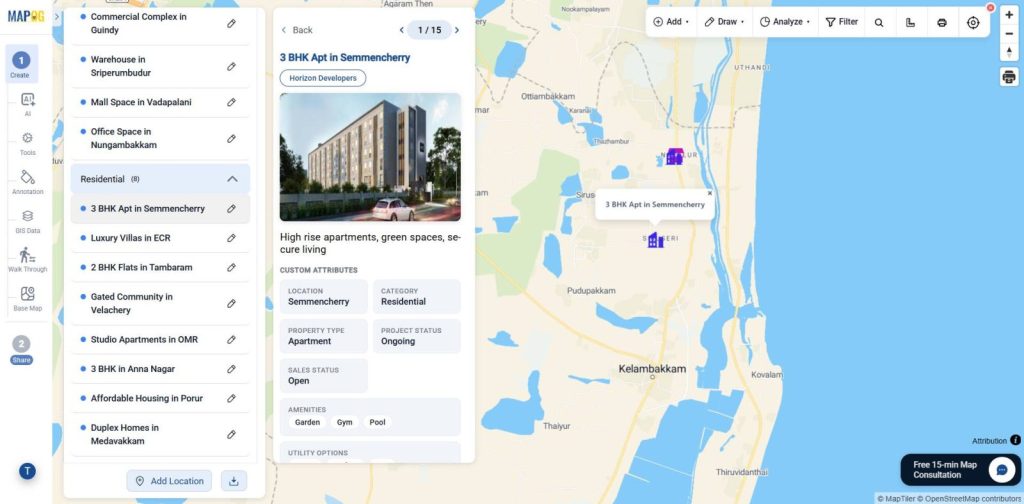
After uploading, locations are auto-saved in your business location template. Go to the Location dashboard, search your template, and open it.
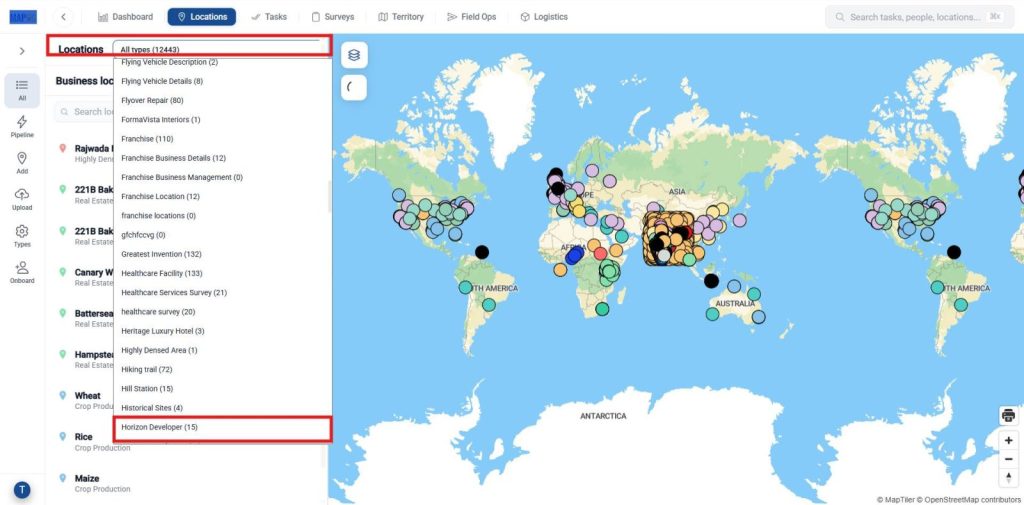
Select your template and verify all locations are added. Review pop-ups and make edits if needed.
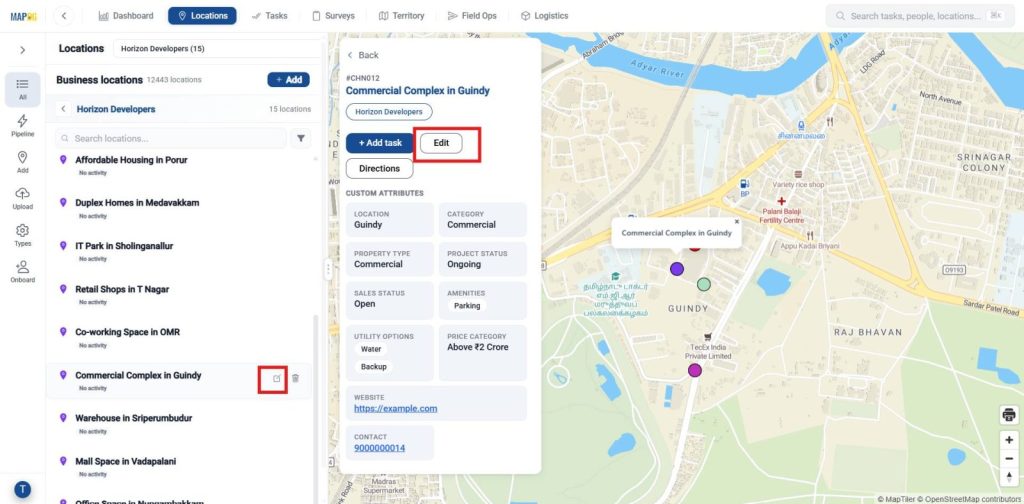
Select any location, then click Edit to update its details.
For each property, upload or add images, update location details with descriptions and additional info, then click Save Changes.
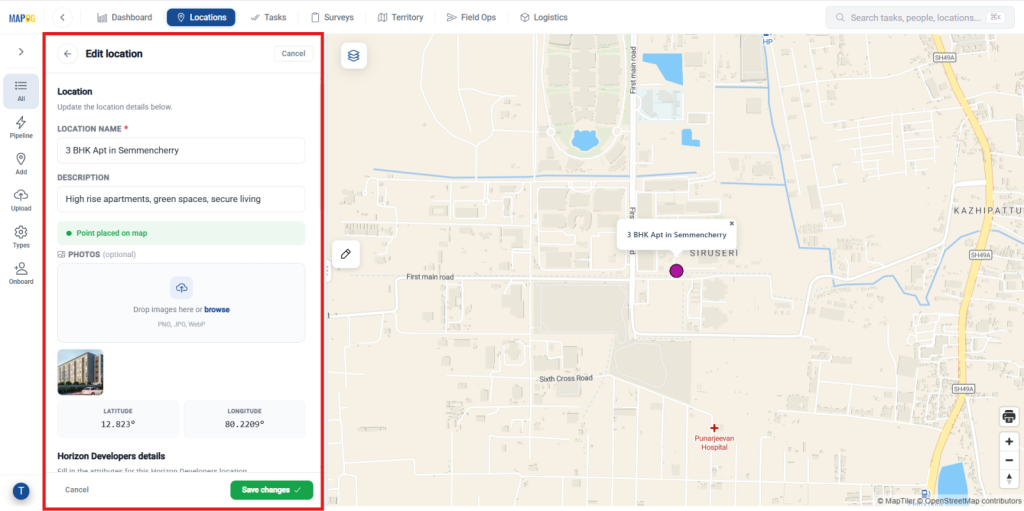
Repeat for each property to ensure complete, consistent data across all locations, with pop-ups for easy review.
4. Creating and Publishing a New Map
Go back to the MAPOG dashboard and select the Create and Publish Map.
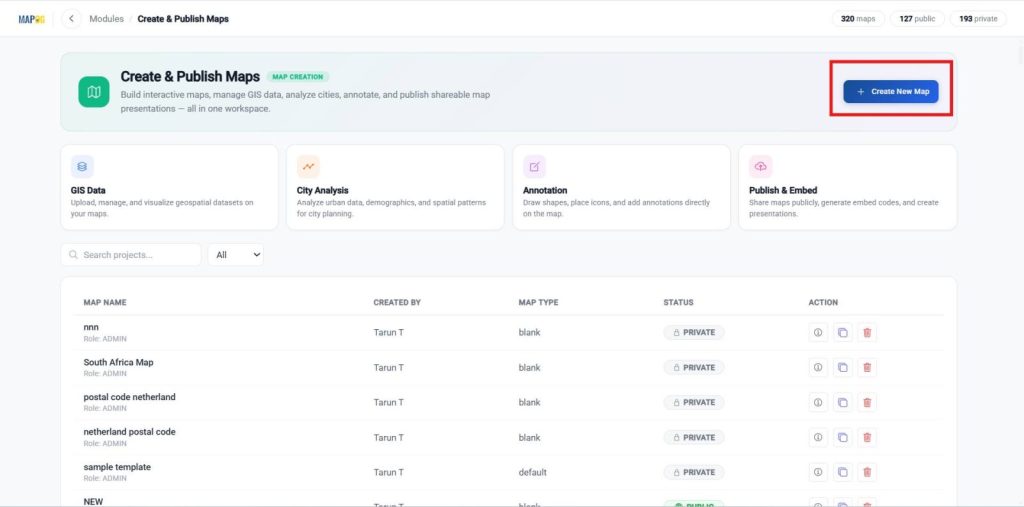
In the Create and publish map Dashboard, choose Create New Map.
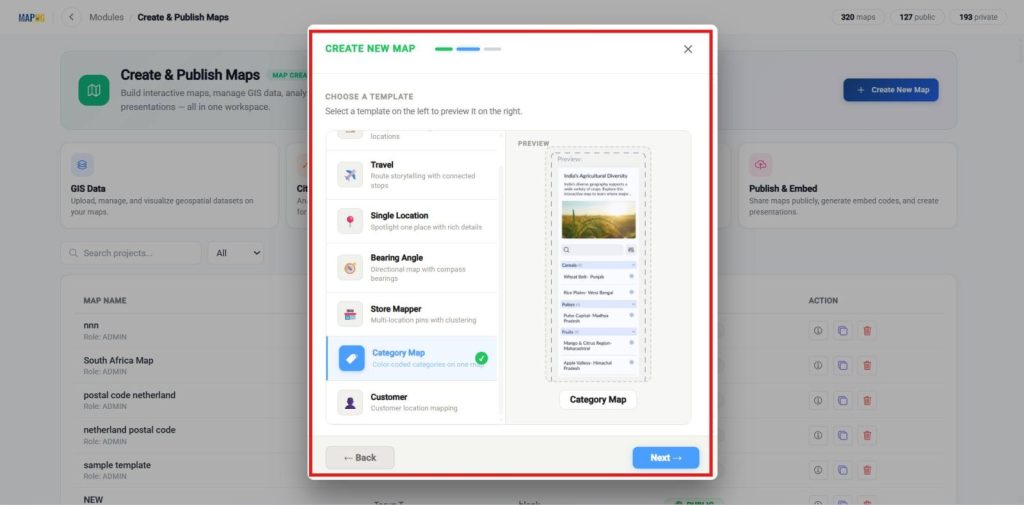
Create a new map, choose a template, and proceed to the next step.
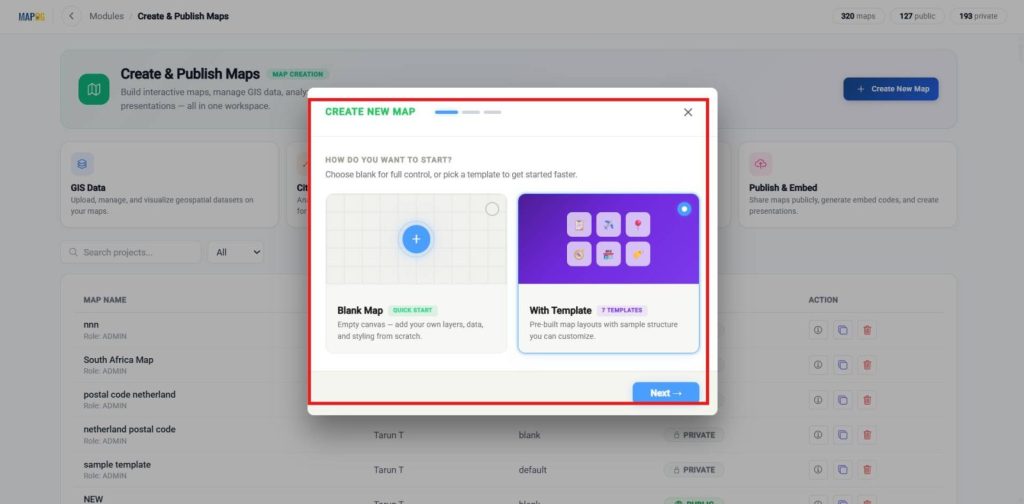
Select the template as the category, then proceed to the next step.
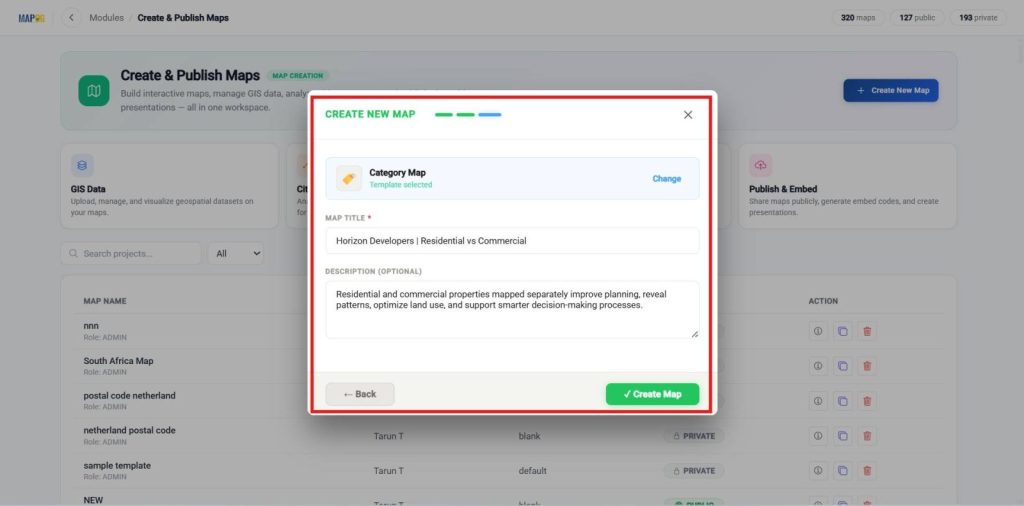
Enter a clear title and a brief description, then click Create to save your map.
5. Adding location details from library
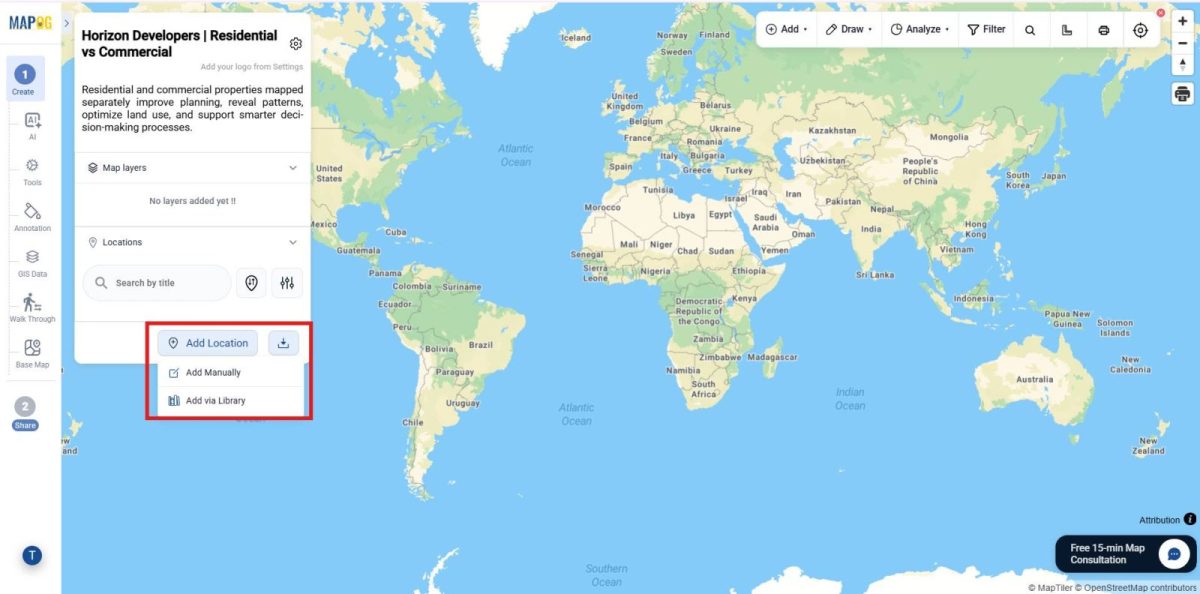
Once the map is created, select Add Location to import all the saved locations using Add Via library.
In the Business Location Library, search for the template you saved and select it.
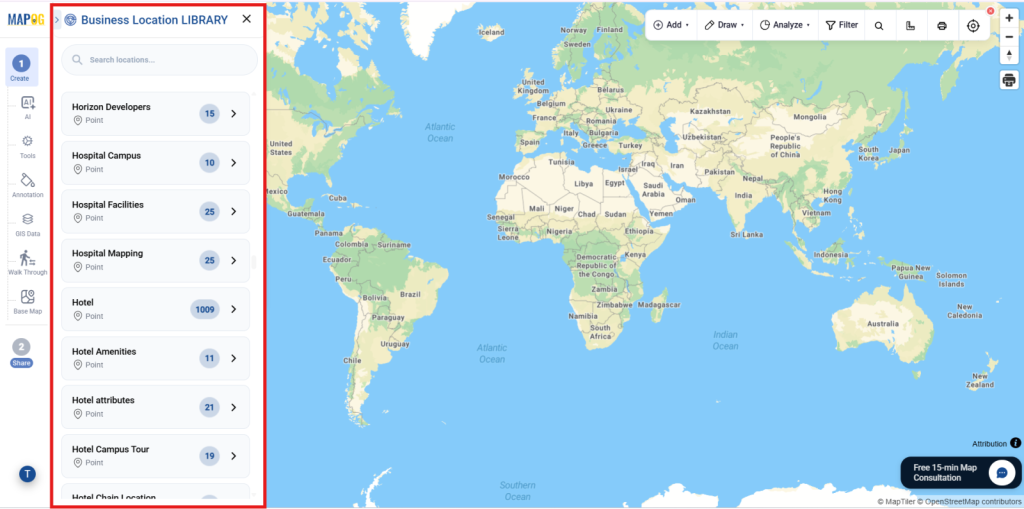
After selecting your template, choose Select All or pick locations manually or using filters, then click Add Business Locations to add them to the map.
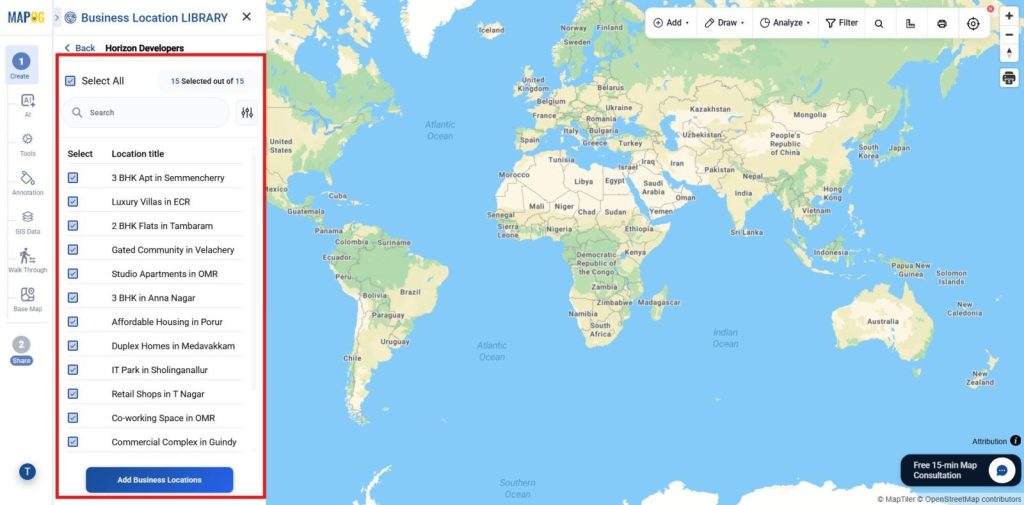
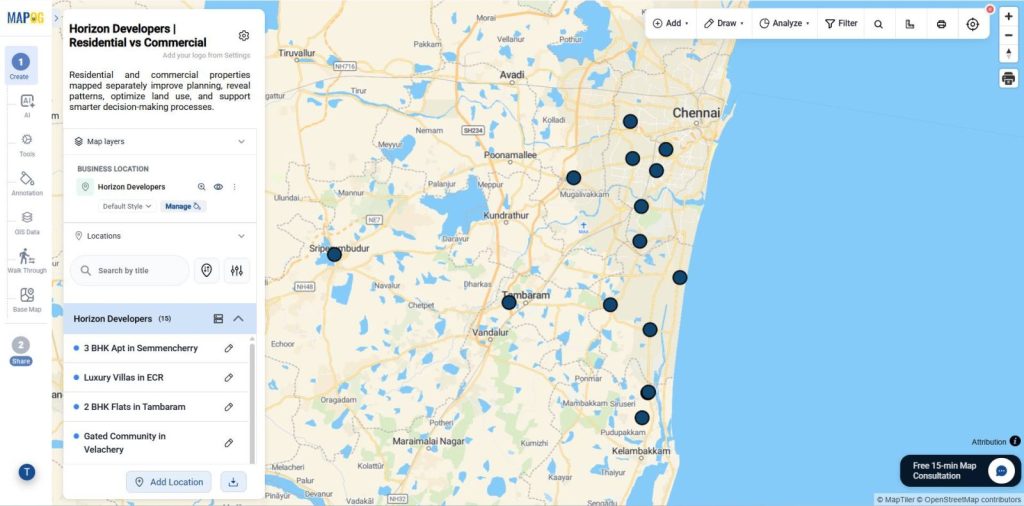
All saved locations will now be added to the map you created, and displayed as shown.
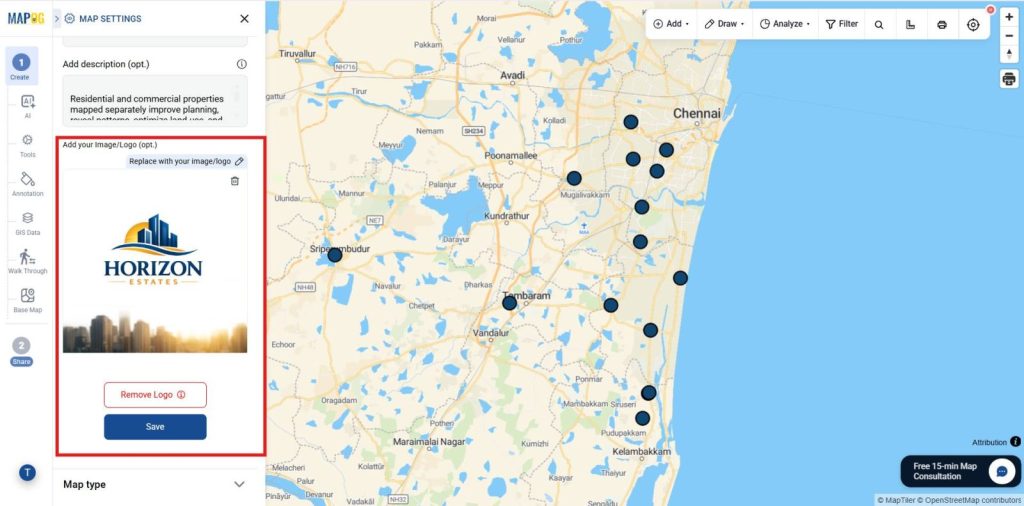
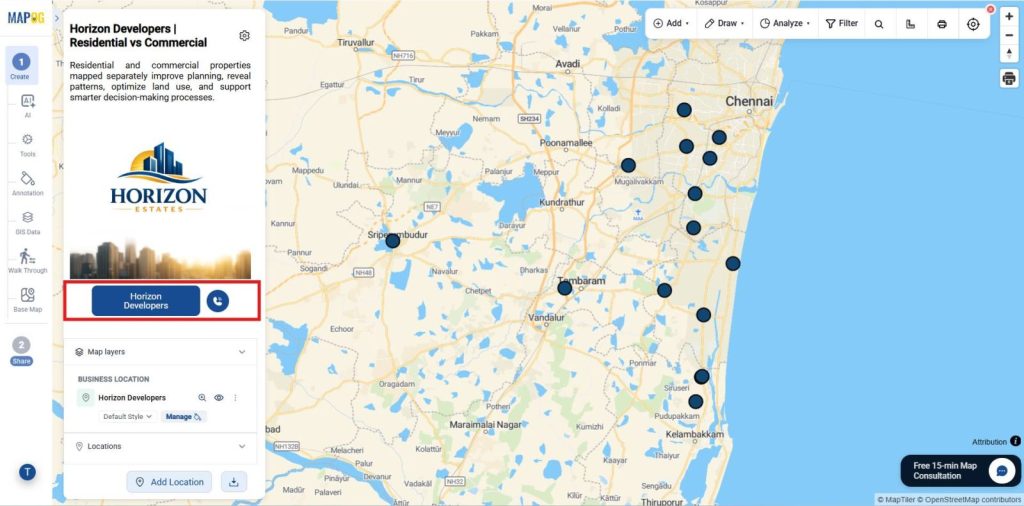
6. Upload Your Image or Logo
Go to map settings and upload your image or logo. Make any necessary adjustments, then save it as your company logo.
7. Configure the Action Button
Go to map settings and select the Action Button option. Add details like your website link and phone number.
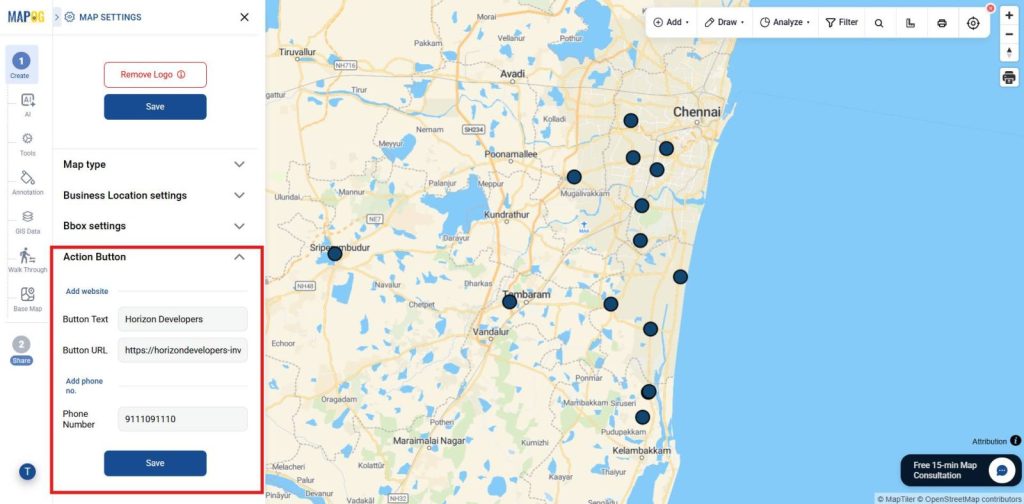
After entering the information, click Save. When used, the button instantly opens the website or starts a call.
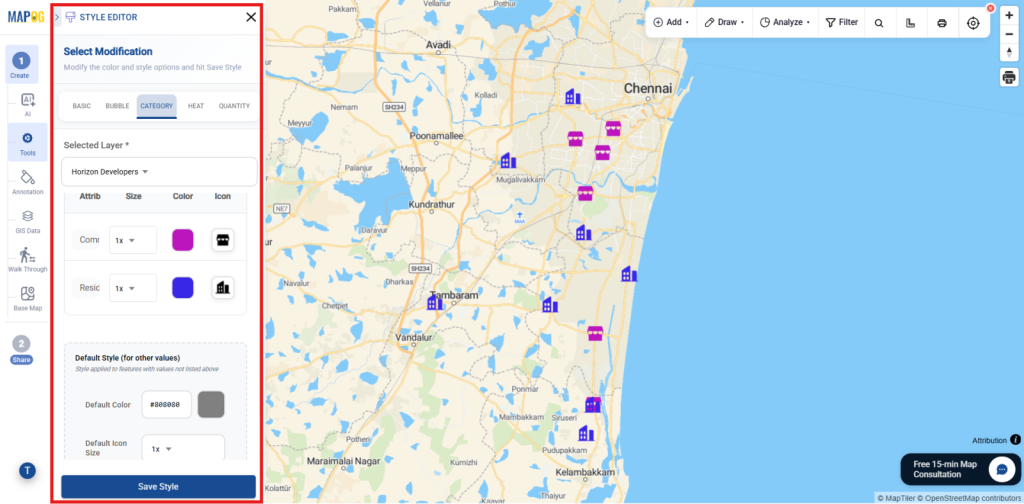
8. To Style Property Layers
Go to Settings under Map Layers, select Add Layer Style, set the category to Style, and choose the uploaded property layer.
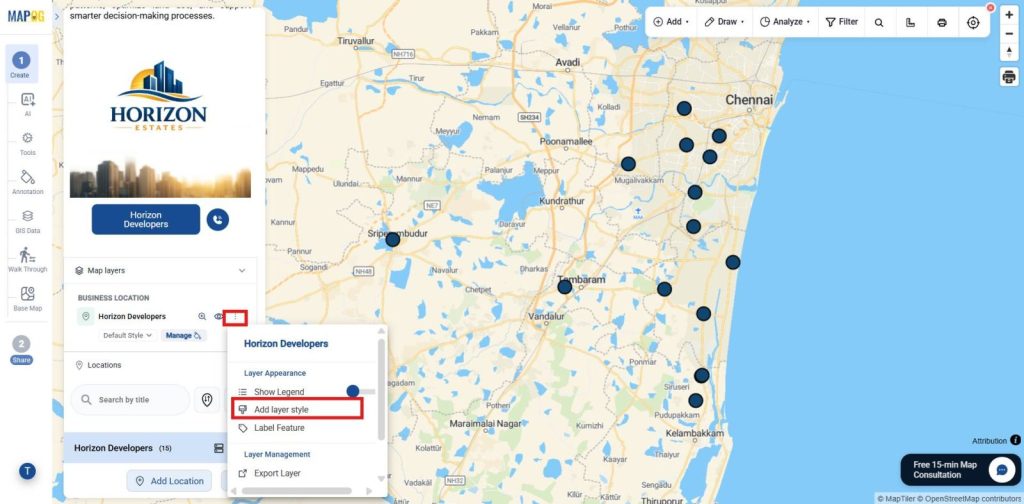
Overall, Select Property Type (Residential or Commercial), assign different icons, adjust marker size, and apply distinct colors. Click Save to display clearly styled properties on the map.
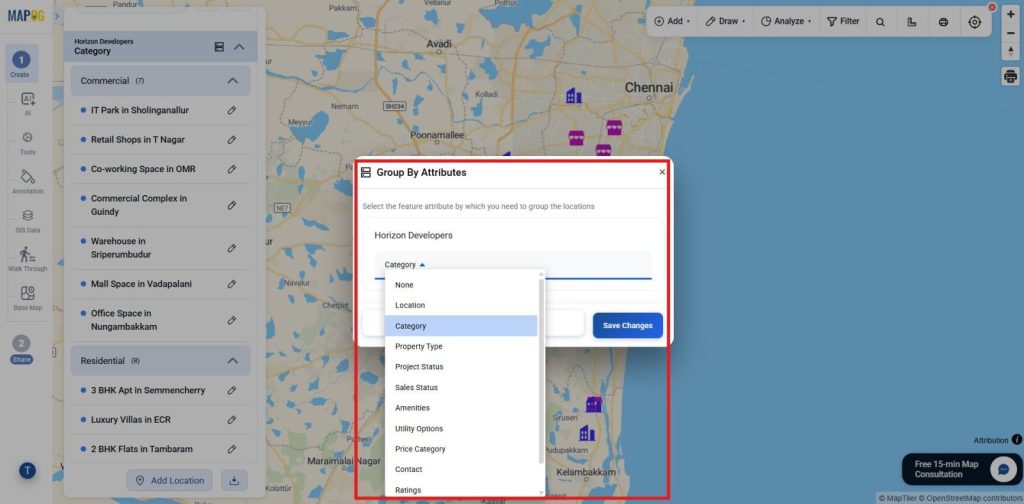
9. Group by Property Category
Therefore, using Group by Attributes, organize properties by type (Residential/commercial) or status to view each category separately. Click Save Changes to apply and update layers.
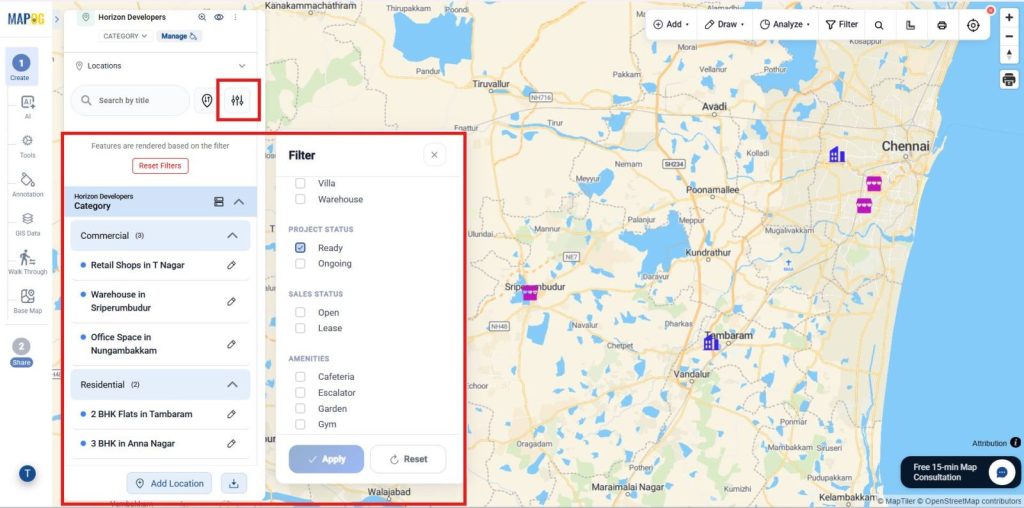
10. Filters and Sorting Tool
Filters help refine properties by type, price, or availability. Open Filters, choose criteria, and apply to view only relevant results.
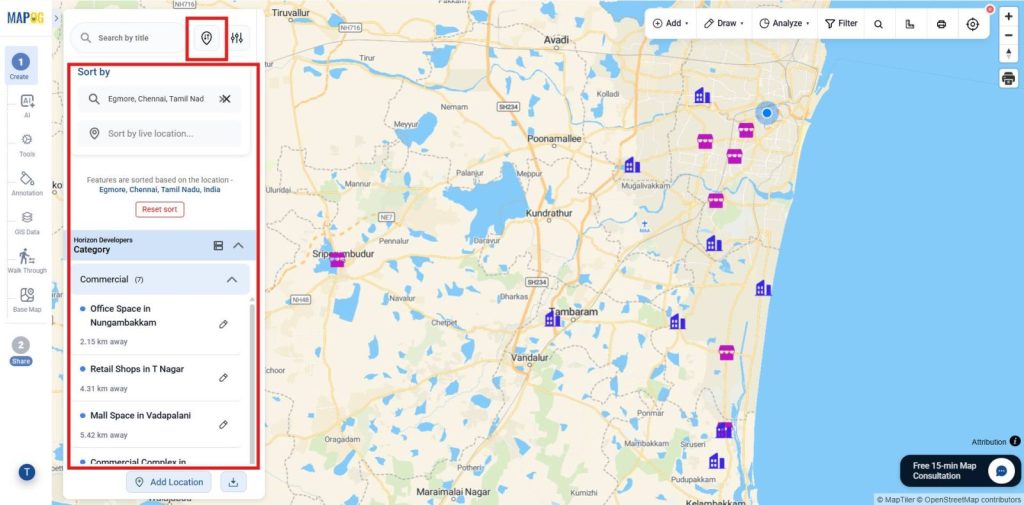
Instead, Use Sort by Distance to arrange properties by proximity to a selected location, making it easier to find and compare nearby residential or commercial options.
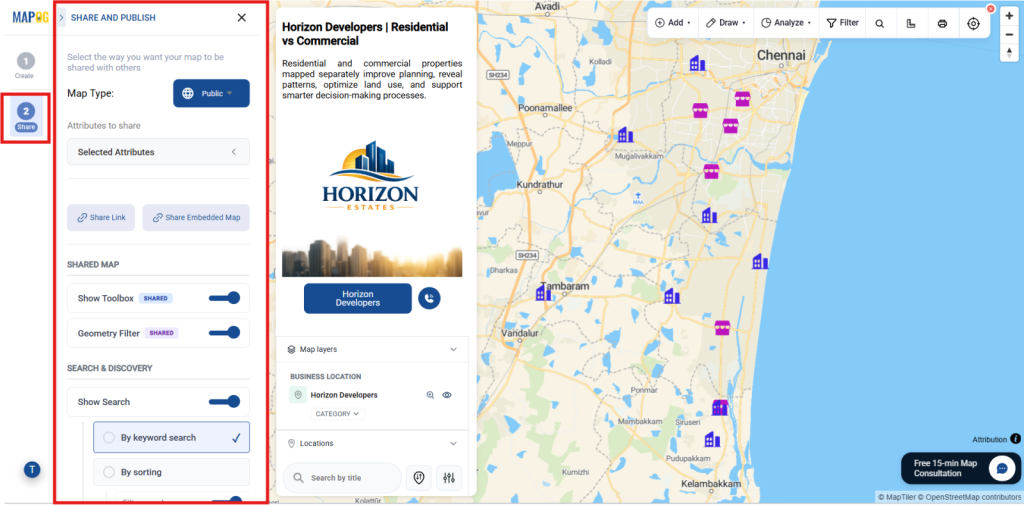
11. Publish and Share Your Map
Once setup is complete, use Preview & Share to publish your map and generate a shareable or embeddable link, letting users explore properties by all or selected attributes.

Also, Provide map access by adding users, assigning roles, and enabling shared tools like geometry filters, search, and map controls.
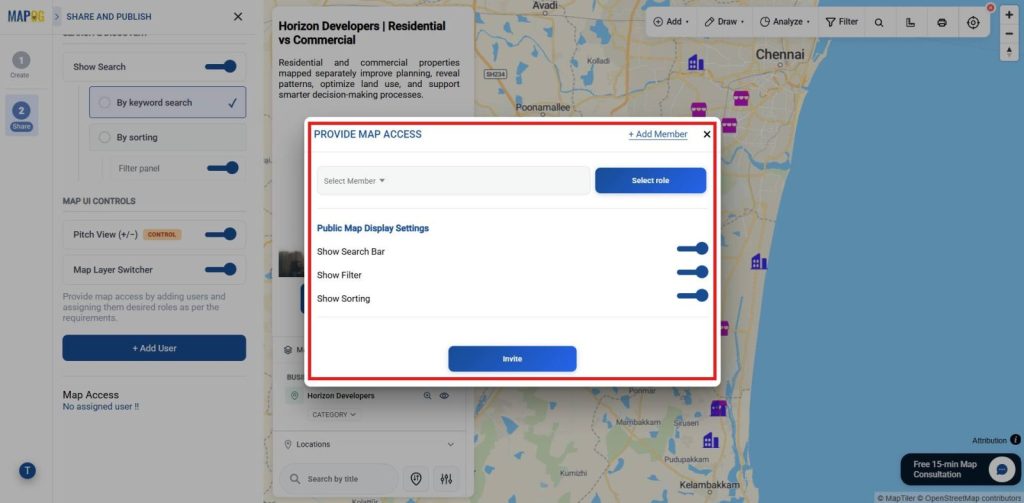
Moreover, Use +Add Users to invite members, assign view/edit permissions, and enable public map features like search, filters, sorting, and shared tools.
Industry Use Cases and Benefits
In addition, Map residential and commercial properties on separate layers to unify assets, analyze zoning, track availability, compare segments, and plan developments improving visibility, reducing confusion, and enabling faster, location‑based decisions.
Conclusion
In conclusion, MAPOG simplifies property management by turning mixed data into clear maps with separate layers, enabling better planning and smarter decisions.