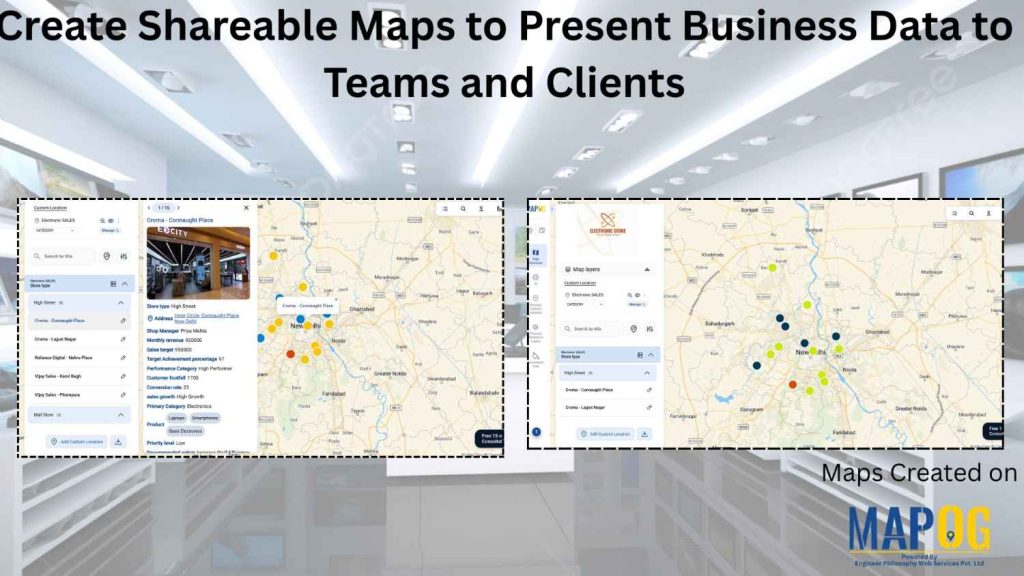
Managing business data across multiple store locations or sales territories often becomes challenging when teams rely on spreadsheets instead to Create Shareable Maps, emails, and scattered reports. As a result, it becomes difficult to track performance, identify trends, and communicate insights clearly to teams or clients. Moreover, static data lacks geographic context, making it harder to understand where exactly performance gaps exist.
However, by using map-based data visualization in the MAPOG, businesses can connect every data point to a precise location on an interactive map. Consequently, teams can Create Shareable Maps to visualize sales performance, customer distribution, and operational insights in real time. This not only improves clarity but also enables faster and more informed decision-making from a single platform.
Key Concepts to Create Shareable Maps
Map-based business data visualization focuses on linking structured data to geographic locations so it can be explored visually. Firstly, location-driven mapping allows businesses to understand how performance varies across regions or store locations. Additionally, categorized data helps group points into meaningful segments such as high-performing or underperforming stores.
Furthermore, attributes like revenue, targets, and customer footfall provide deeper insights when attached to map points. Real-time updates ensure that teams always work with the latest data, while filters and grouping options improve data exploration. Ultimately, centralized and visual data improves communication, strengthens analysis, and supports better business decisions.
Steps to Create Shareable Maps
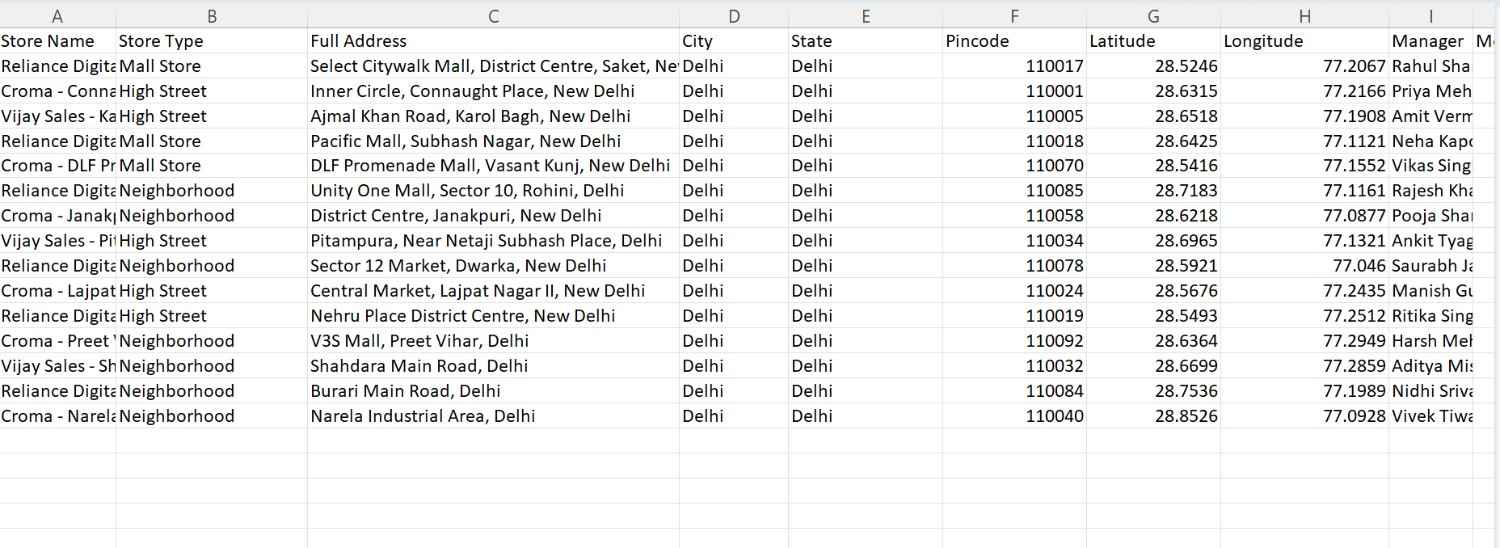
1: Create an Excel file
To begin with, store all site data in an Excel sheet. This file becomes the base for managing surveys without duplication.
2. Create a Map
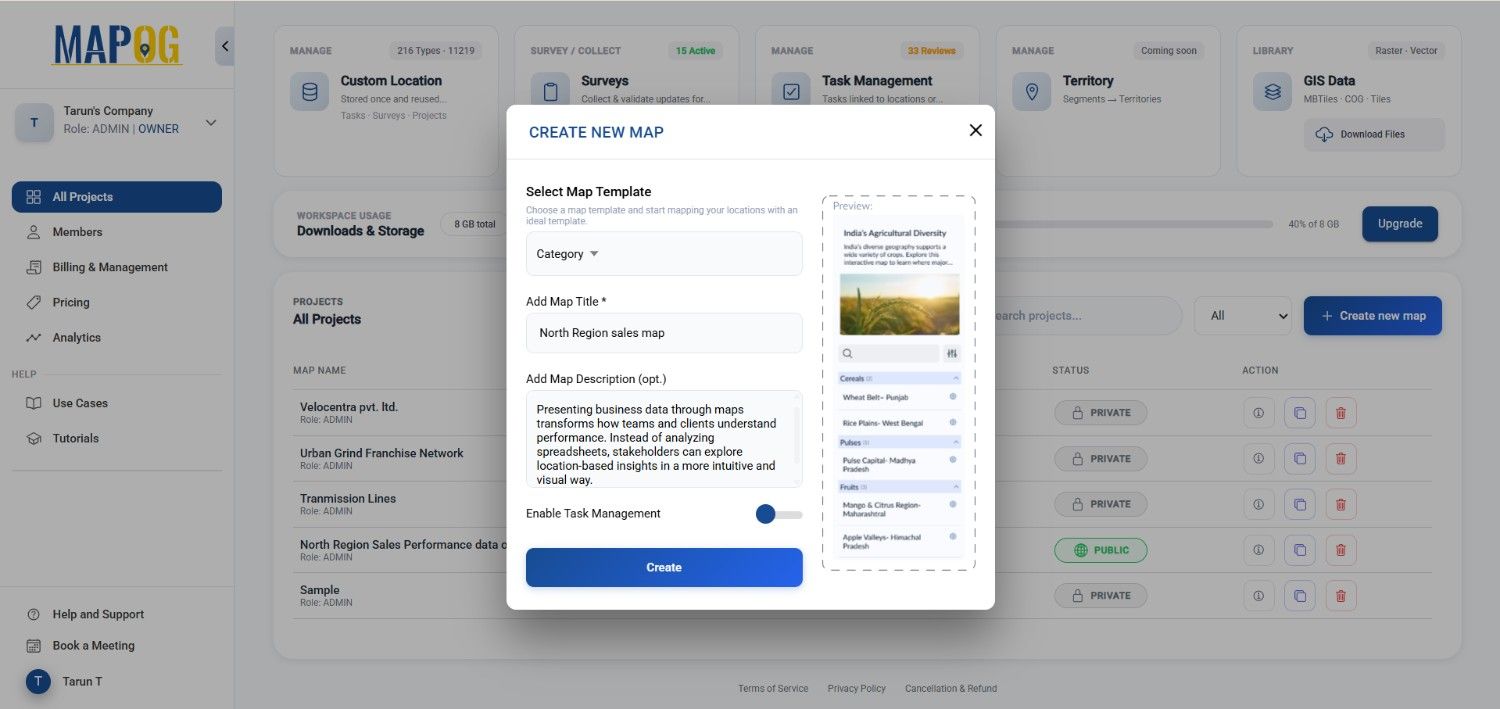
Go to the MAPOG Dashboard and click on Create New Map.
Select the template as Category, then provide a project title and description.
Enable required features and click Create to create your map.
2. Add Business Data Using Excel or CSV
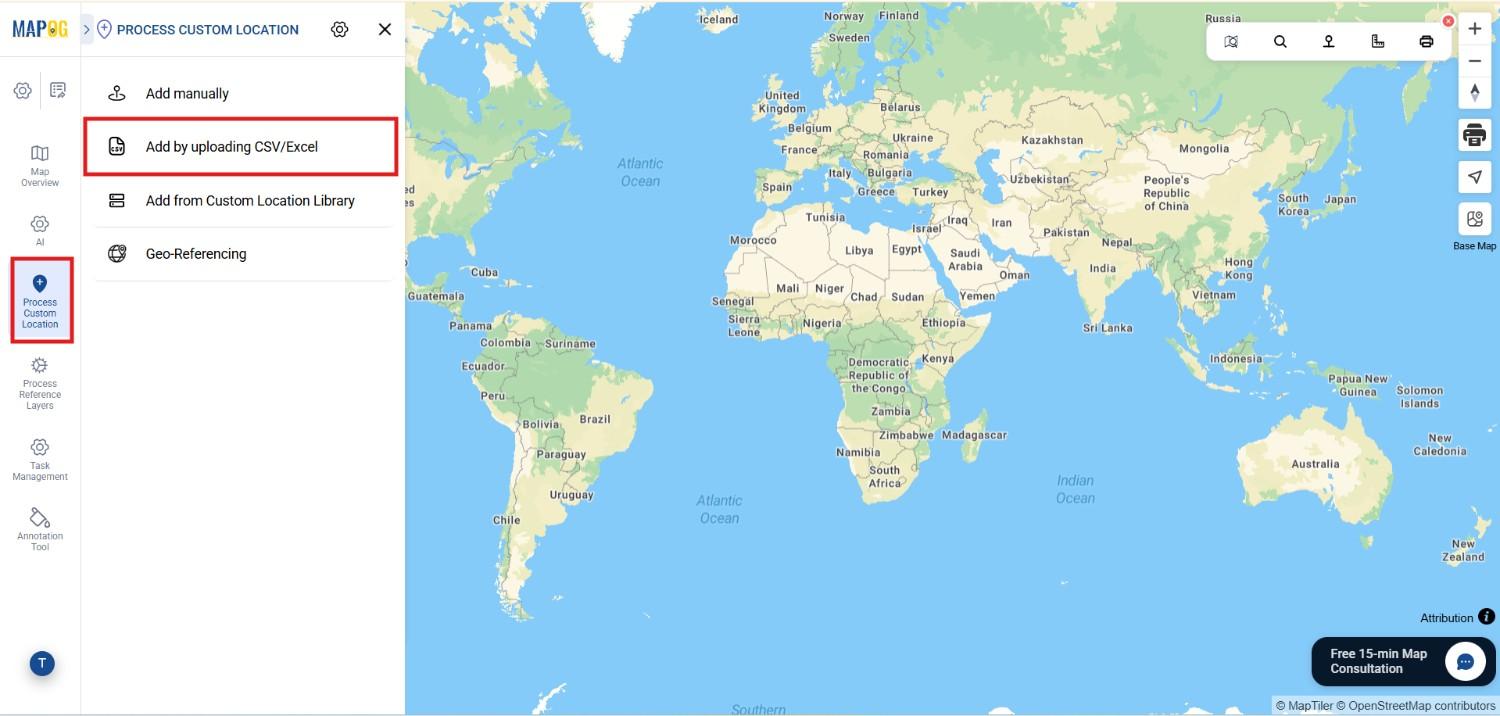
Go to Process Custom Location and select Add by uploading CSV/Excel.
This allows you to import structured business data such as store performance.
3. Create a Custom Location Template
Next, go to Custom Location Template Settings and click on Add More custom location Template.
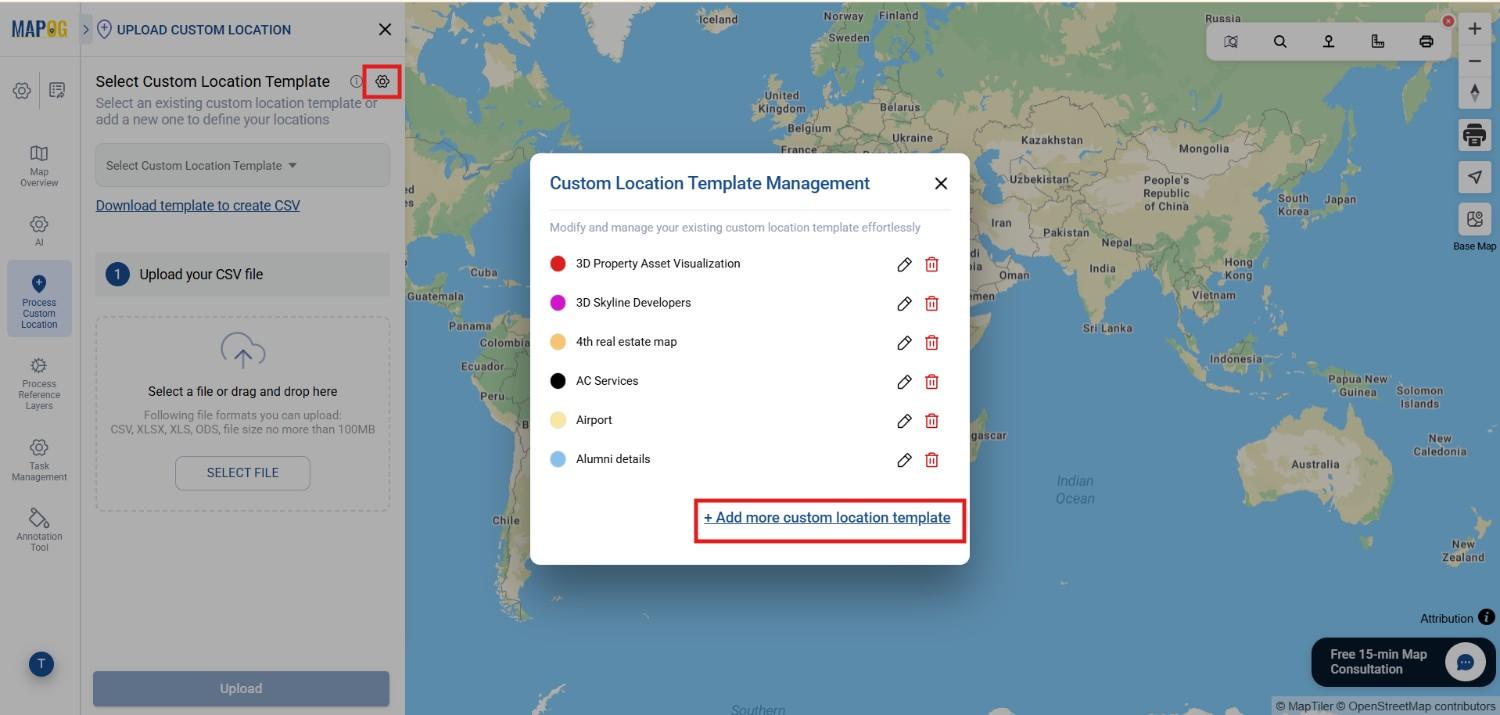
- Name your template (e.g., Retail Sales Performance)
- Select geometry type (Point for store locations)
- Add attributes such as:
- Store Name
- Revenue
- Sales Target
- Performance Category (Select)
- Product Mix (Multi-select)
Choosing the correct attribute types ensures better organization later. Additionally, you can enable contributors so store managers with assigned roles can update store information by themself. Lastly save the template.
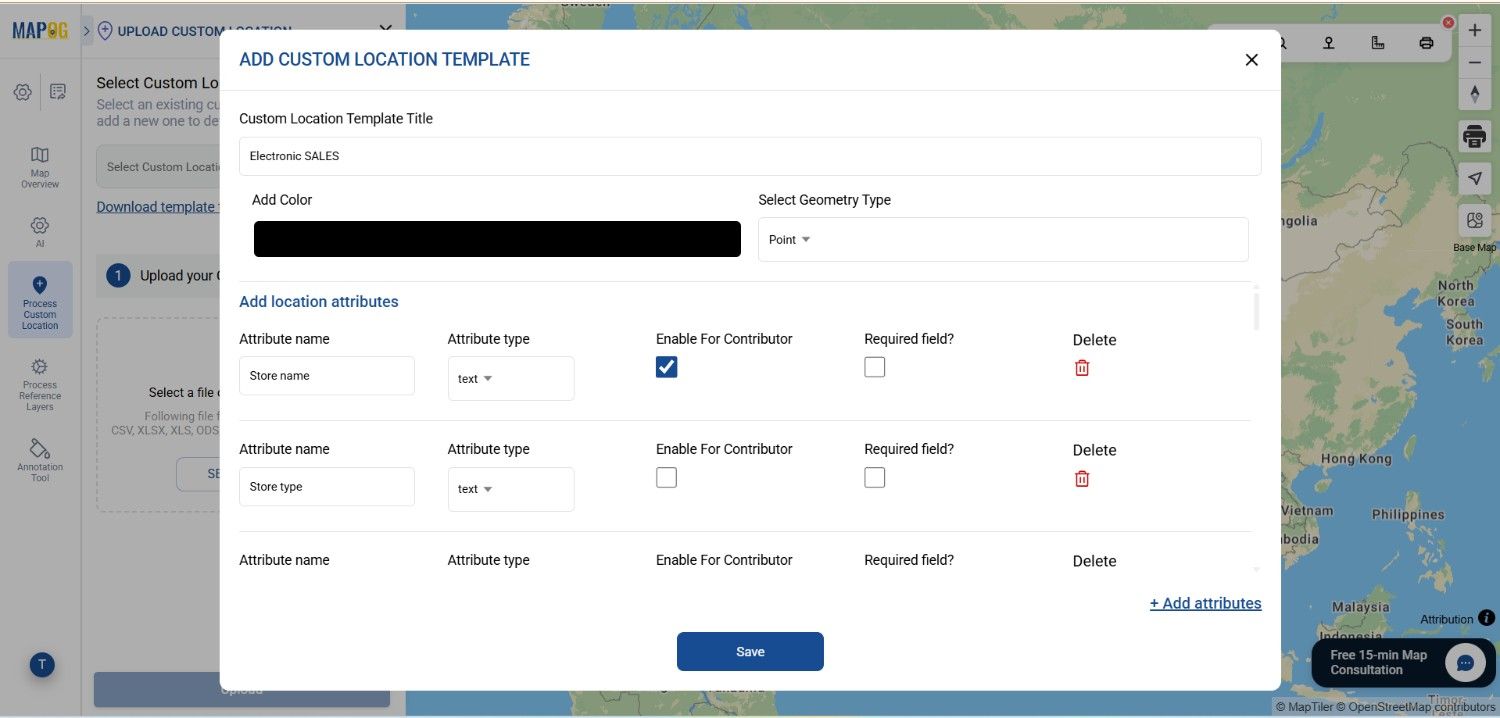
4. Upload and Map Your Data
Select the template you created and upload your Excel file.
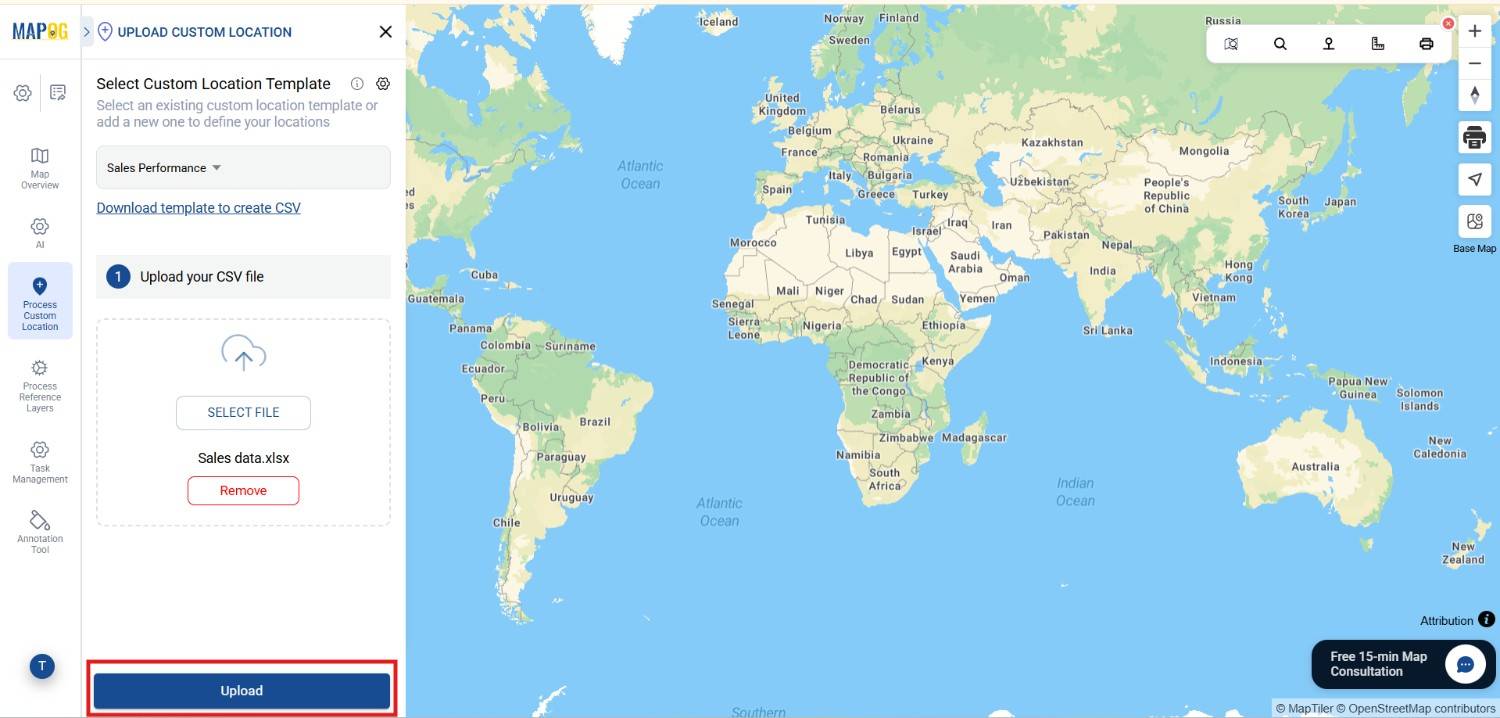
Select a unique ID for each location to avoid duplication of the points
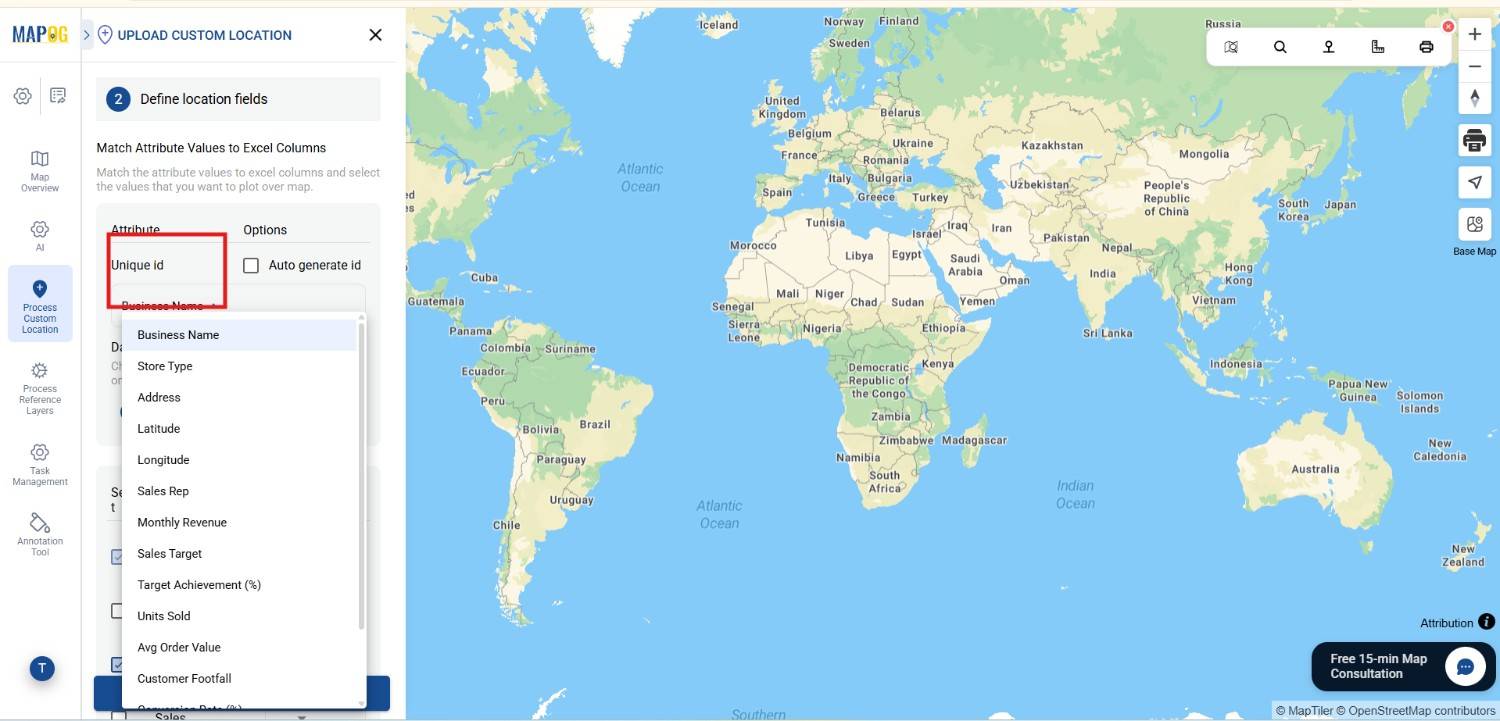
Match all attributes with columns and Assign Latitude and Longitude fields, then submit.
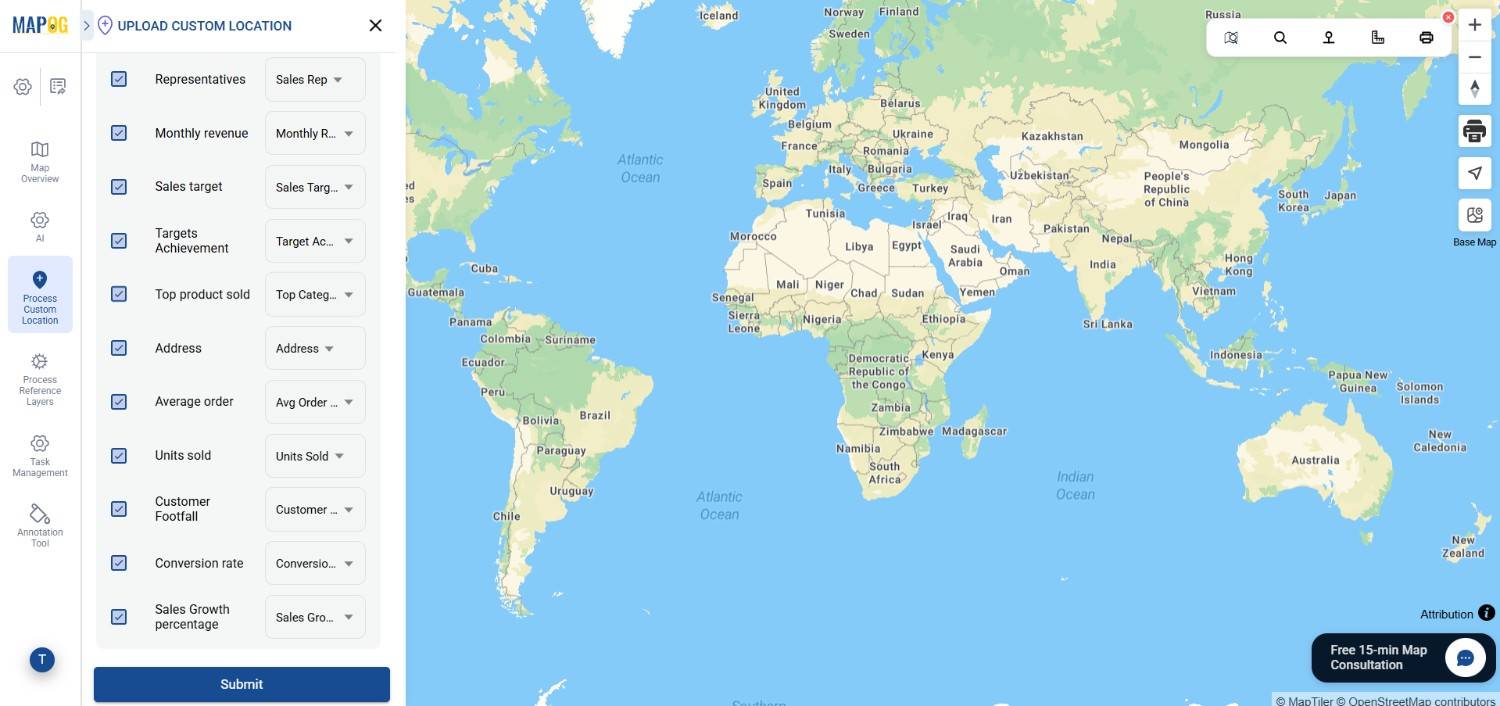
After submission, your data points will appear on the map.
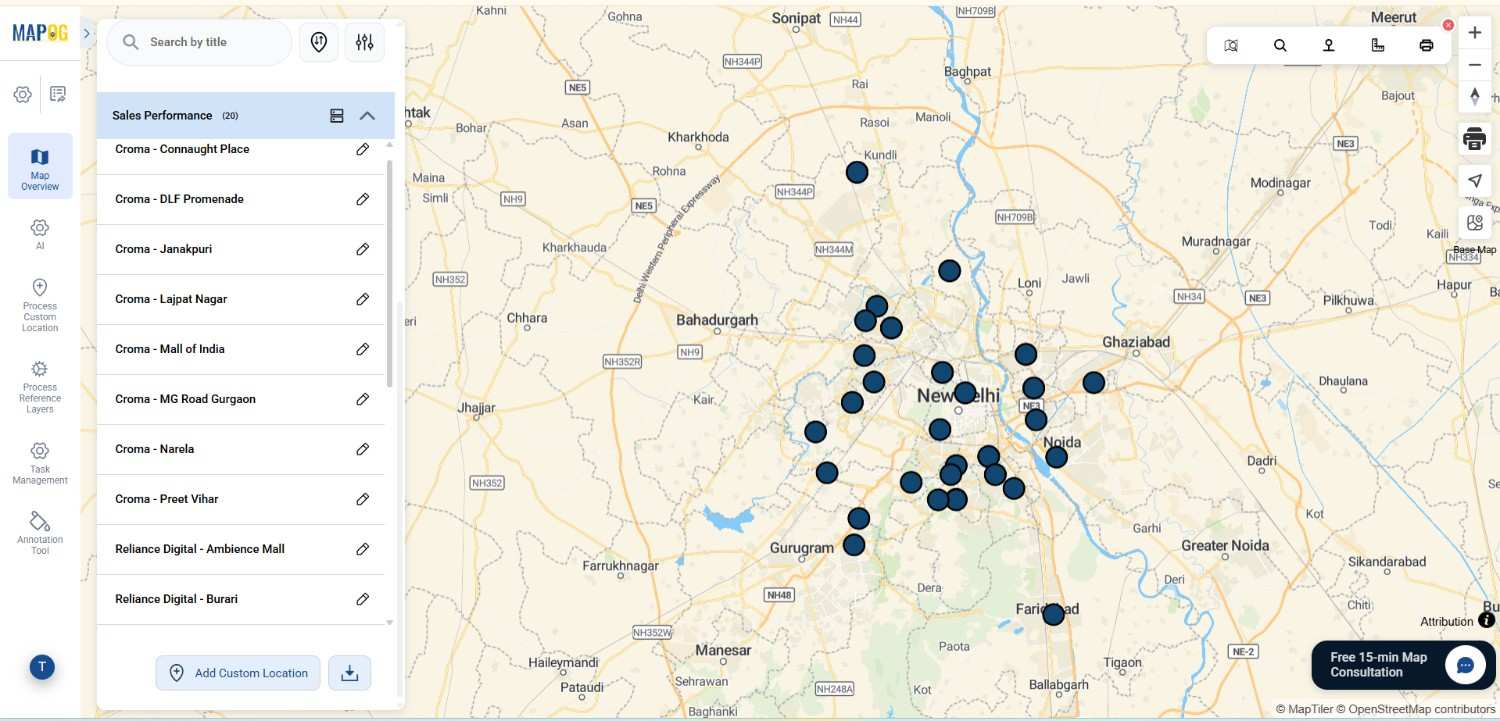
5. Edit and Enrich Map Points
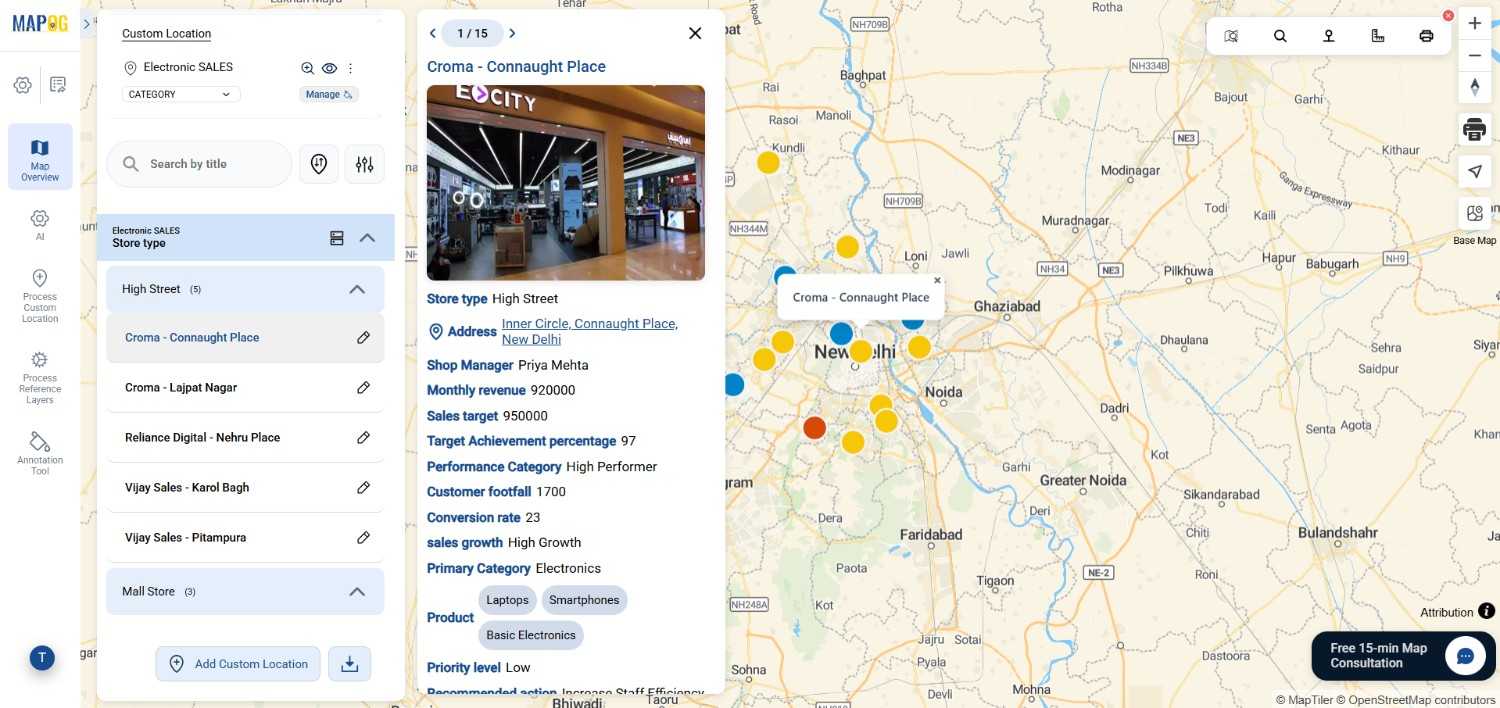
Click on any point and use the Edit (pencil icon) option to edit each location using edit custom location details.
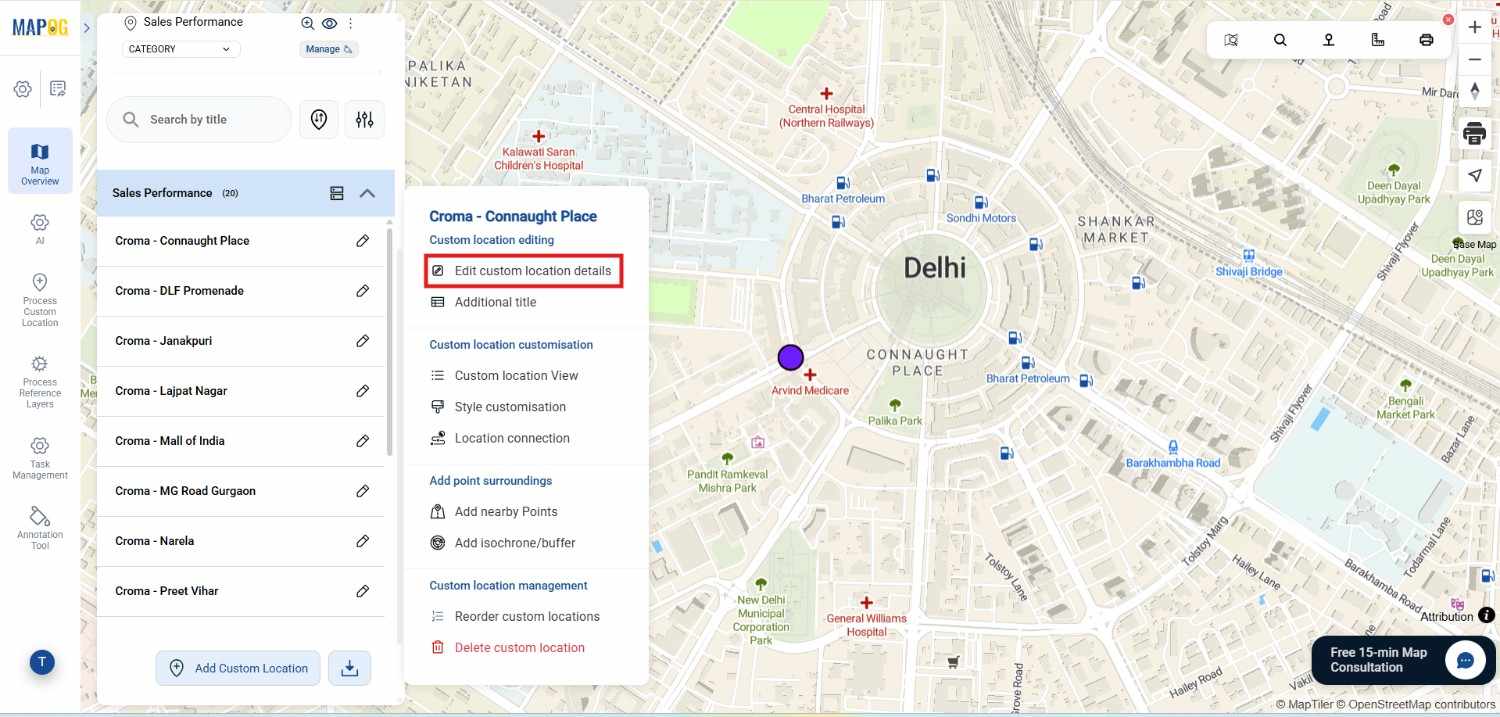
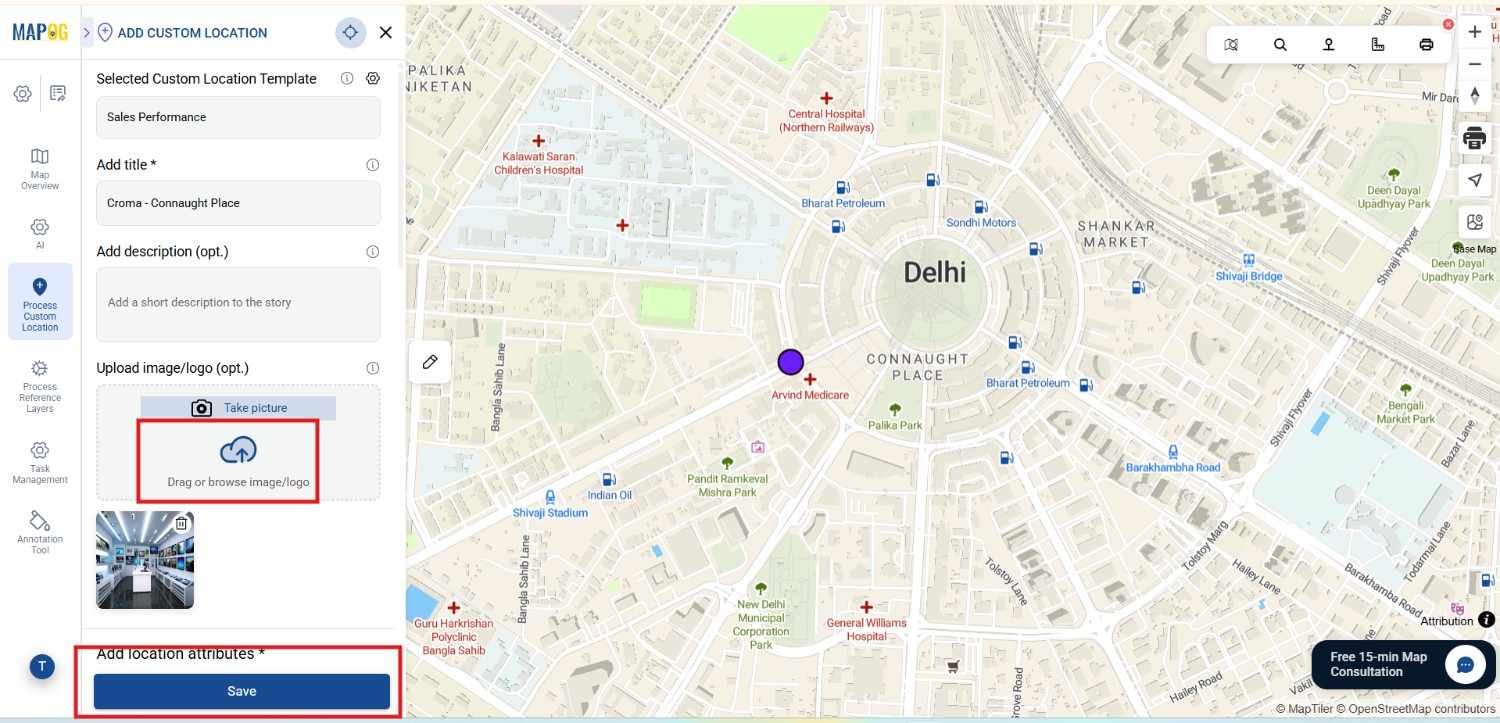
Add images (store photos, reports, etc.)
Update business details
Include additional insights
After required changes save the changes. This step helps make your map more informative and presentation-ready.
6. Style Map for Better Visualization
Click on Add Layer Style and select Category Style.
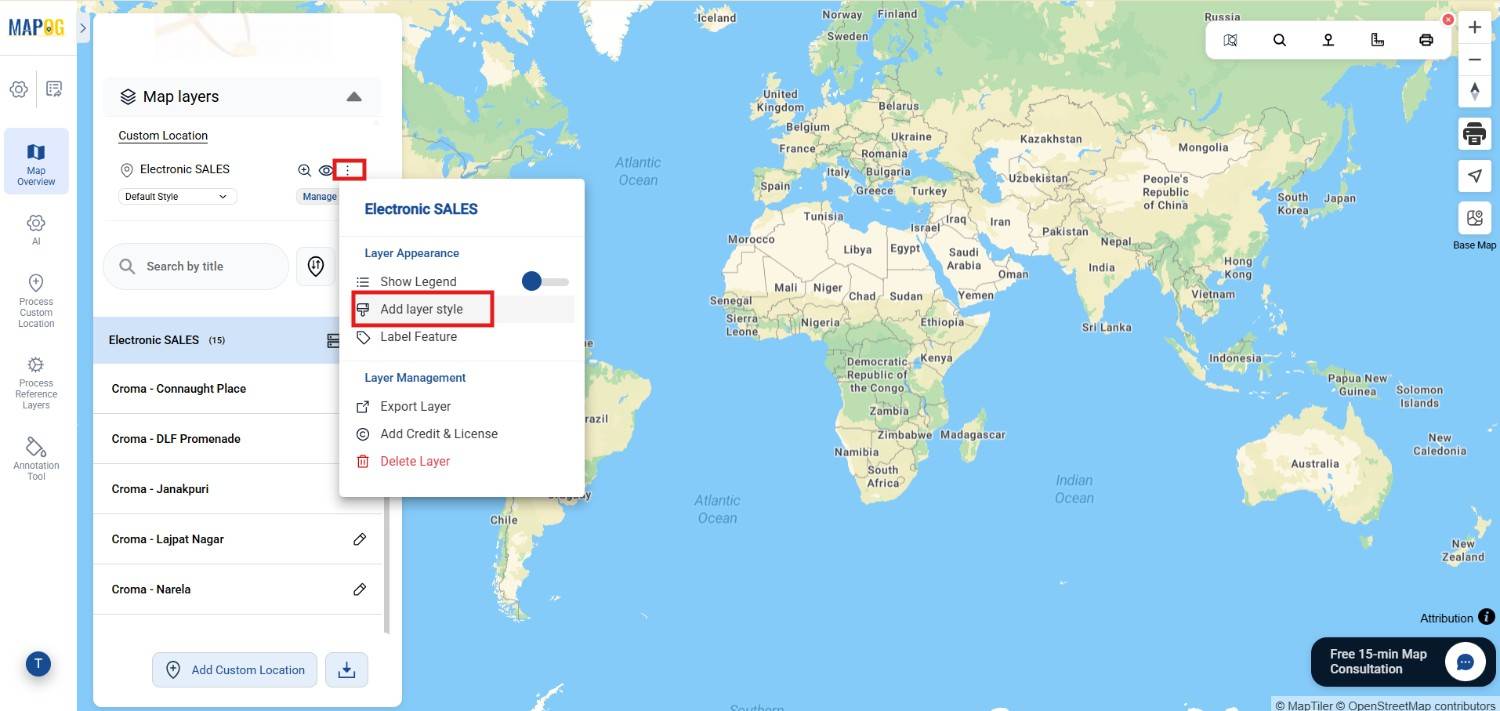
Choose an attribute like:
- Performance Category
- Sales Growth Category
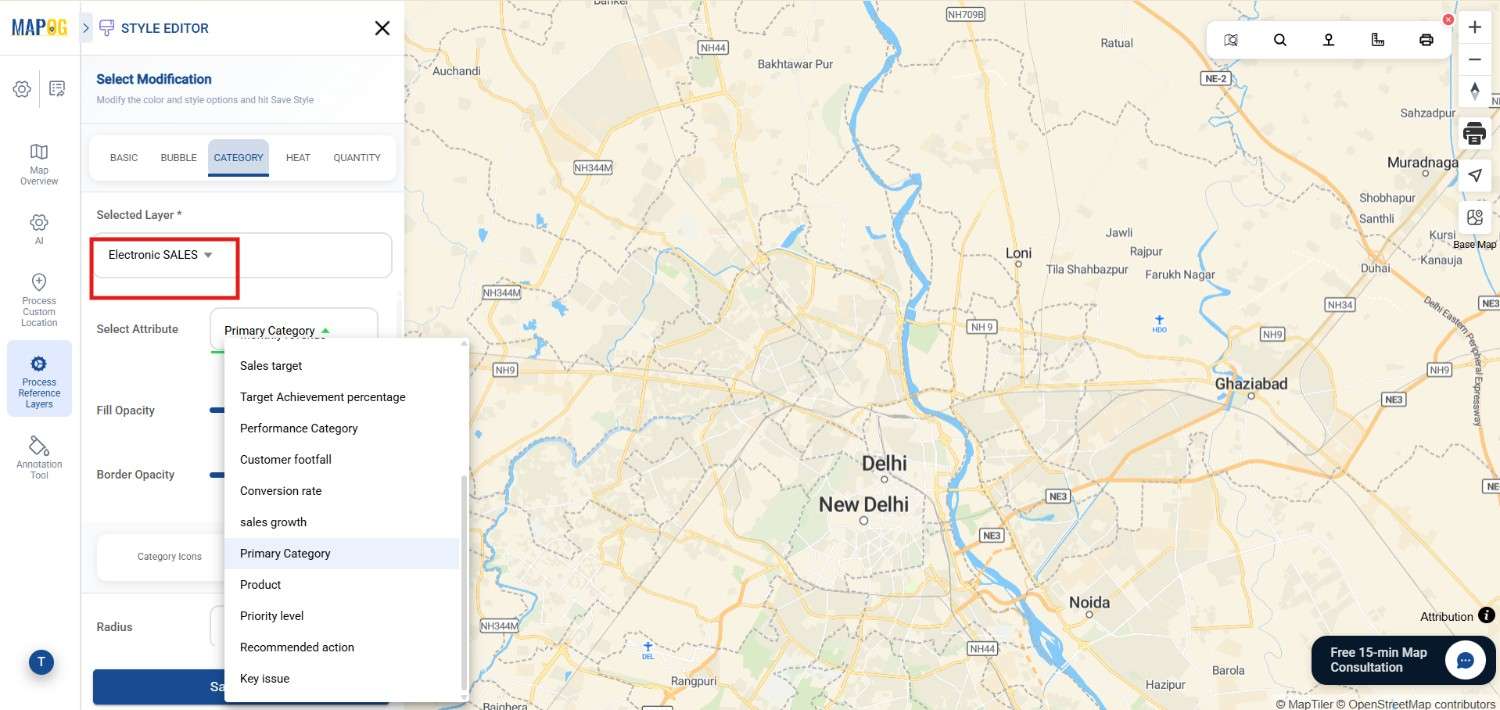
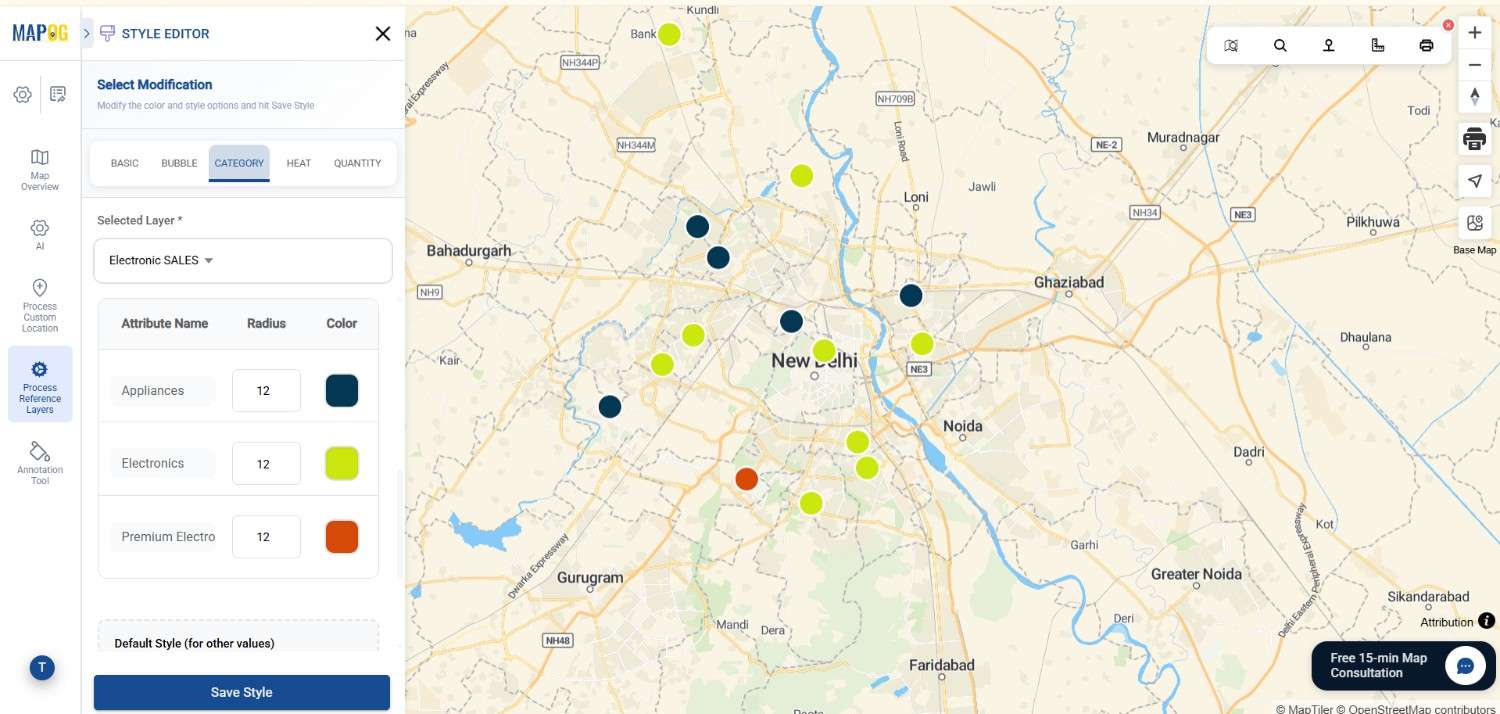
Then assign different colors and icons for each category. As a result, your map will visually highlight trends such as high-performing or underperforming locations.
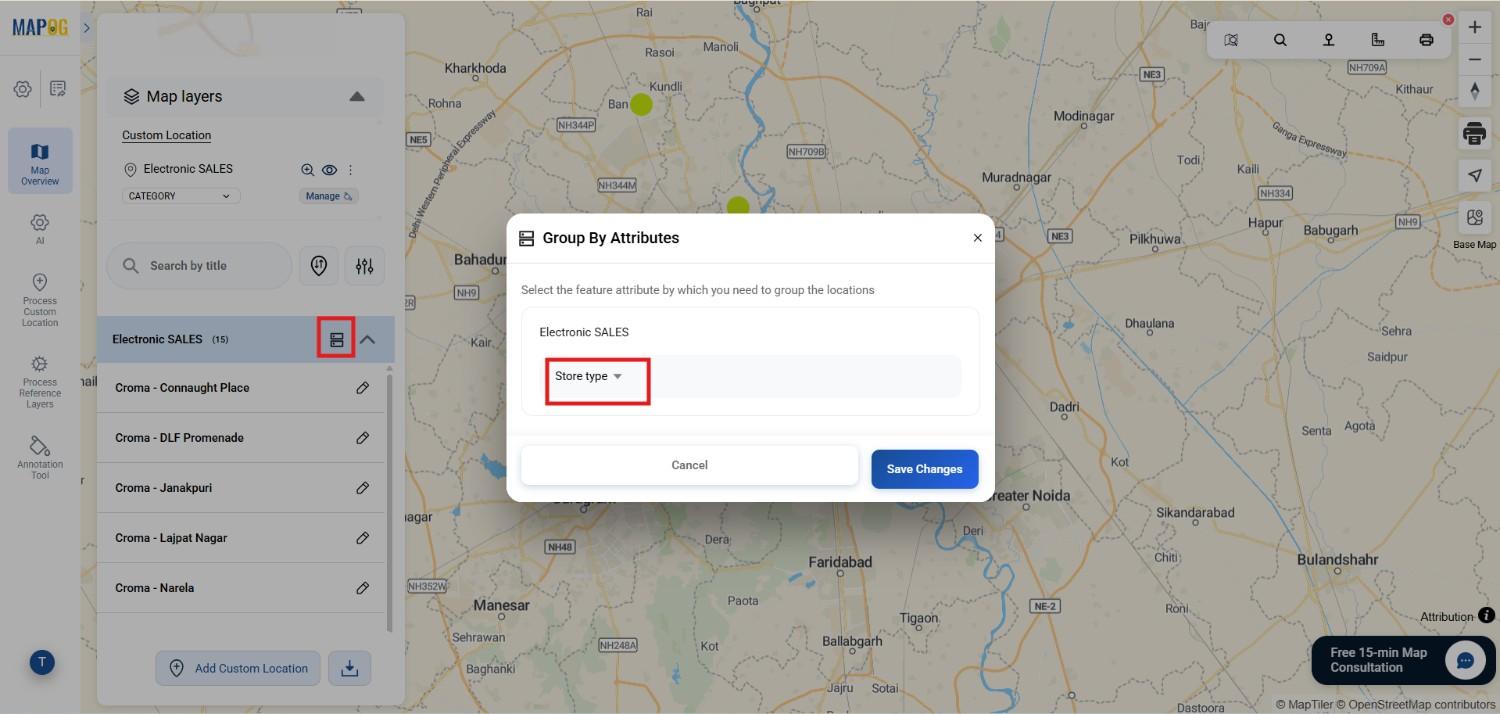
7: Group Data & Filter points
Use Group by Attributes to categorize points based on a selected attribute or field.
Additionally, apply filters Using Filter option such as
- Product Category
- Performance Level
This makes it easier to analyze specific segments and derive insights quickly.
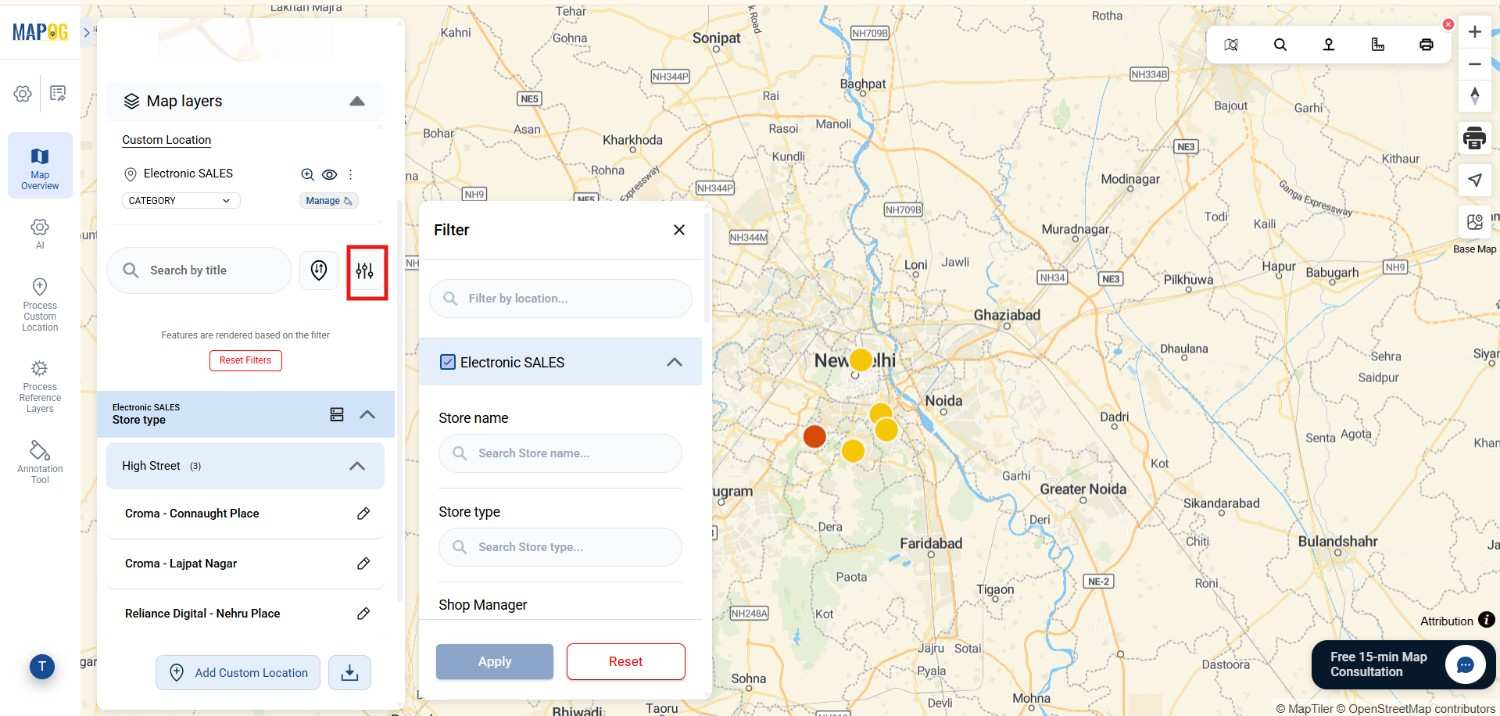
8. Preview and Share Your Map
Once your map is ready, use the Preview and Share option to review how the data appears.
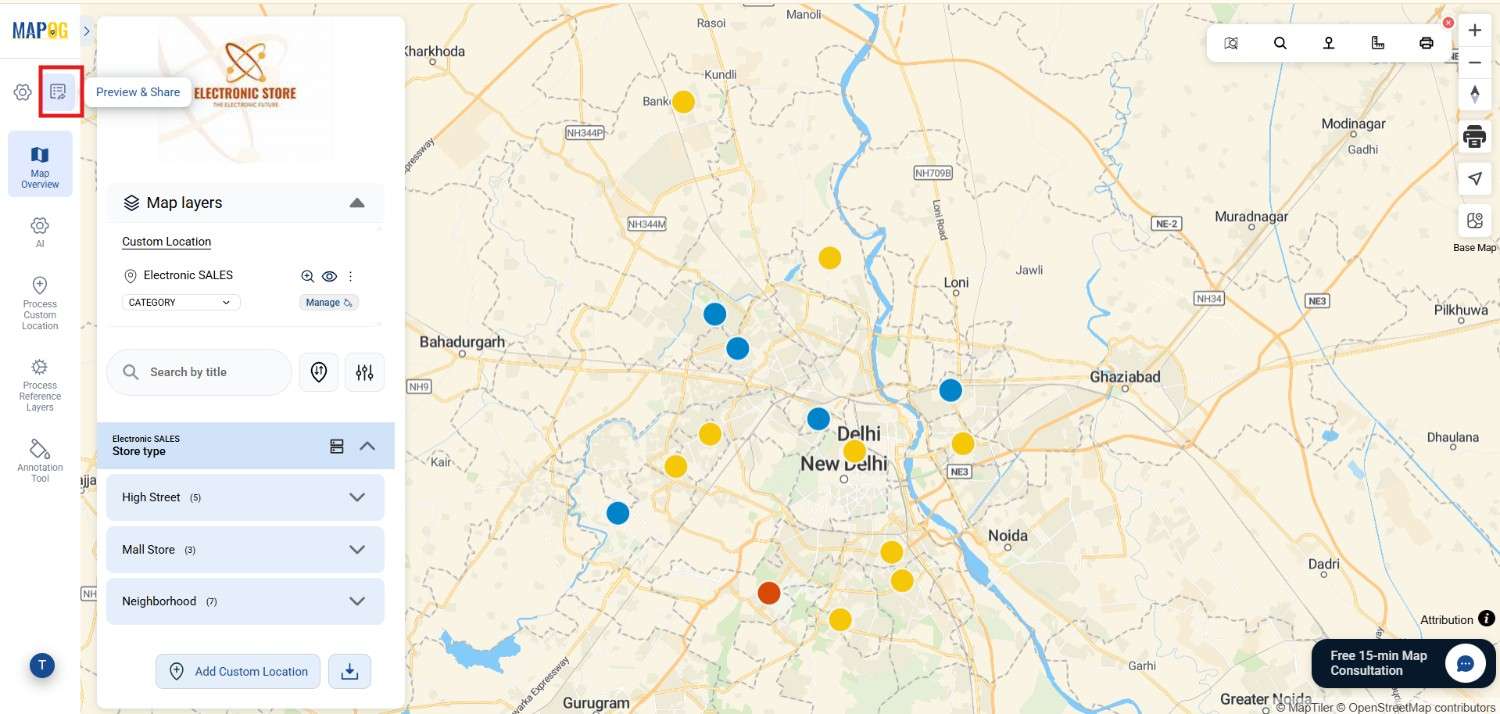
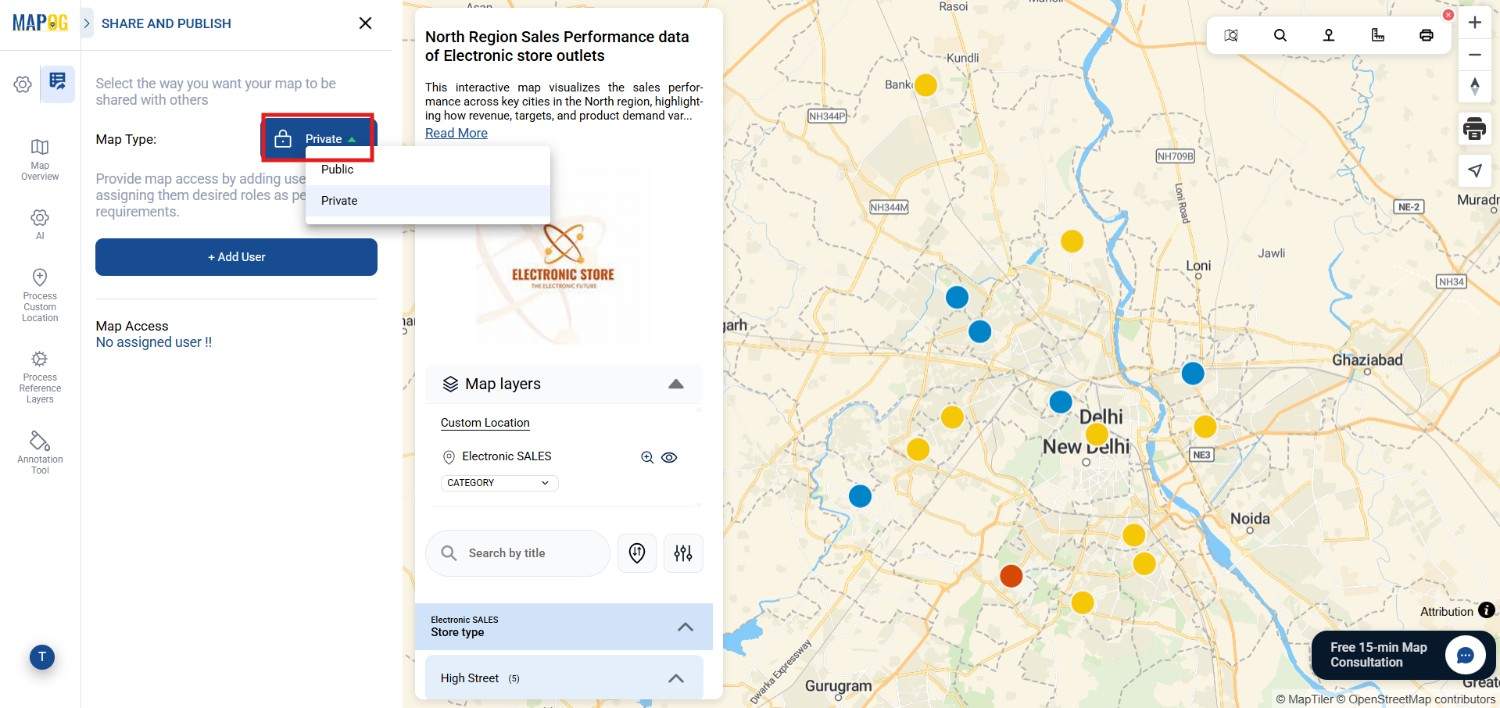
After that, choose Map type whether Private or Public
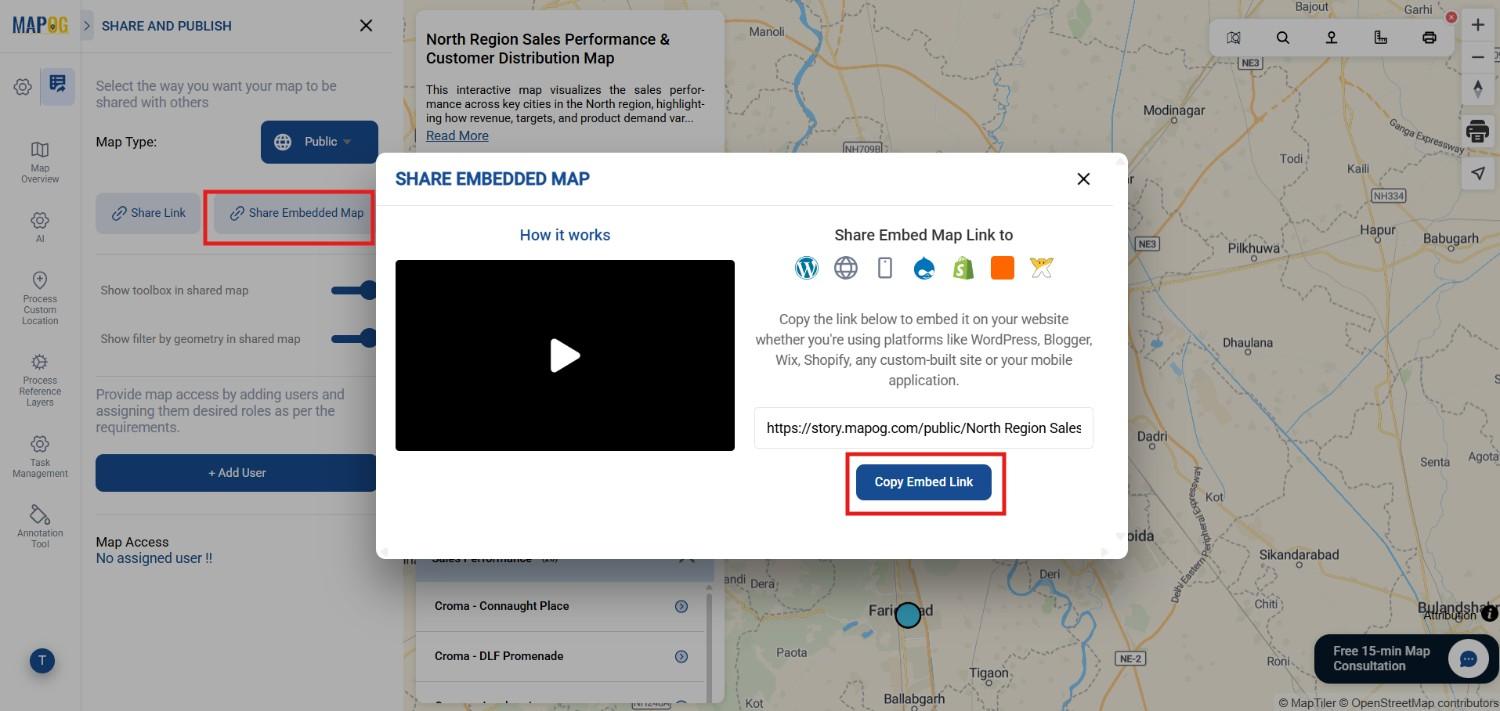
After making it public, Click Share link to share the map link by copying it.
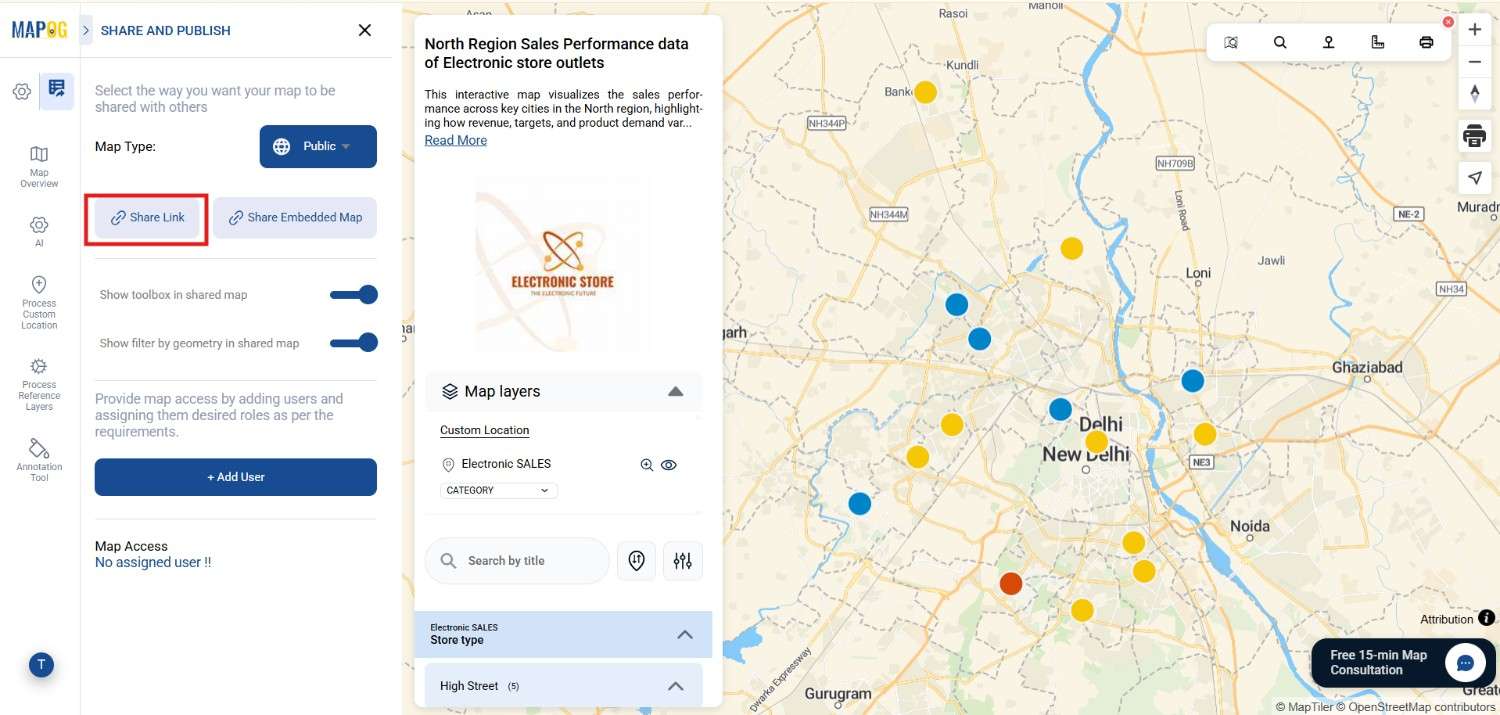
Use a shareable embedded map to display live, location-based business data directly on websites or dashboards, enabling teams and clients to view and interact with real-time insights without switching platforms.
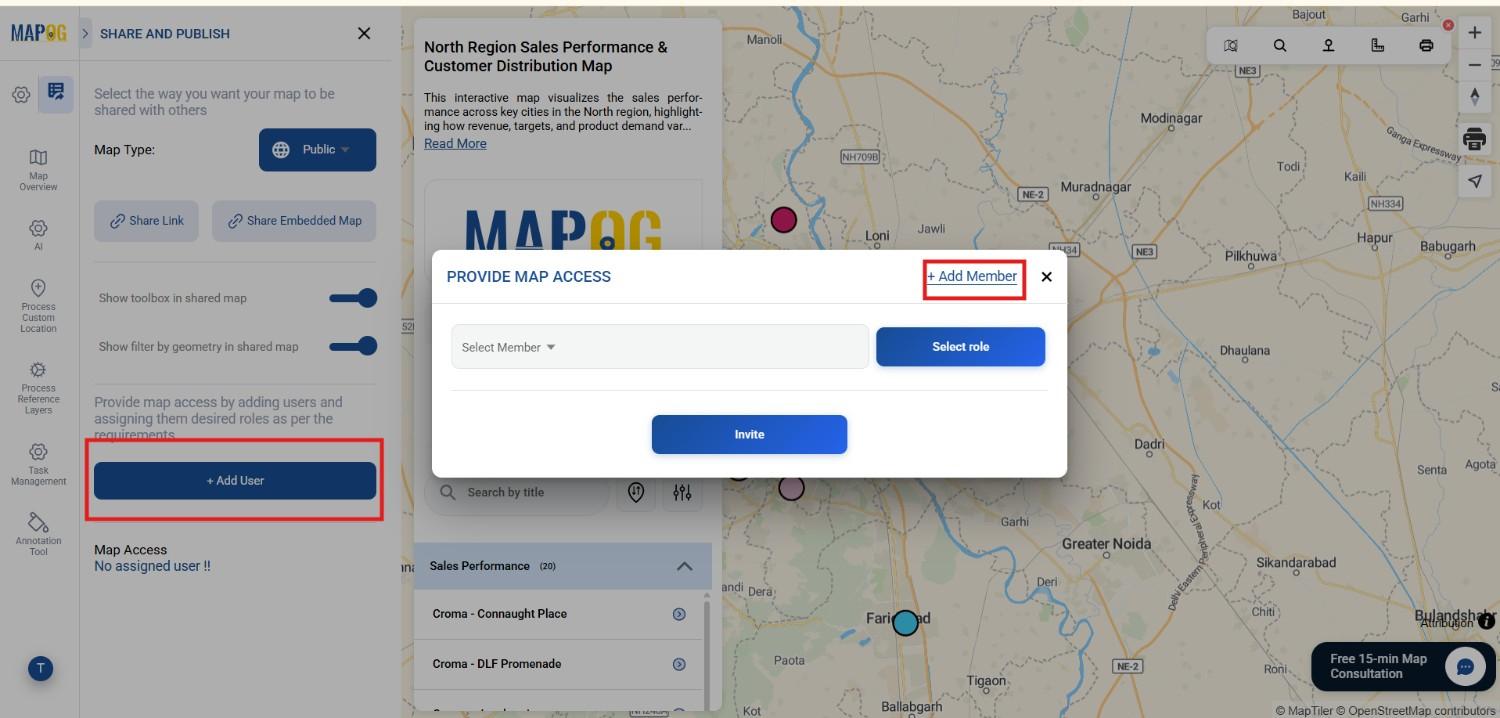
Click on Add user then add team members to add users to the map and work together.
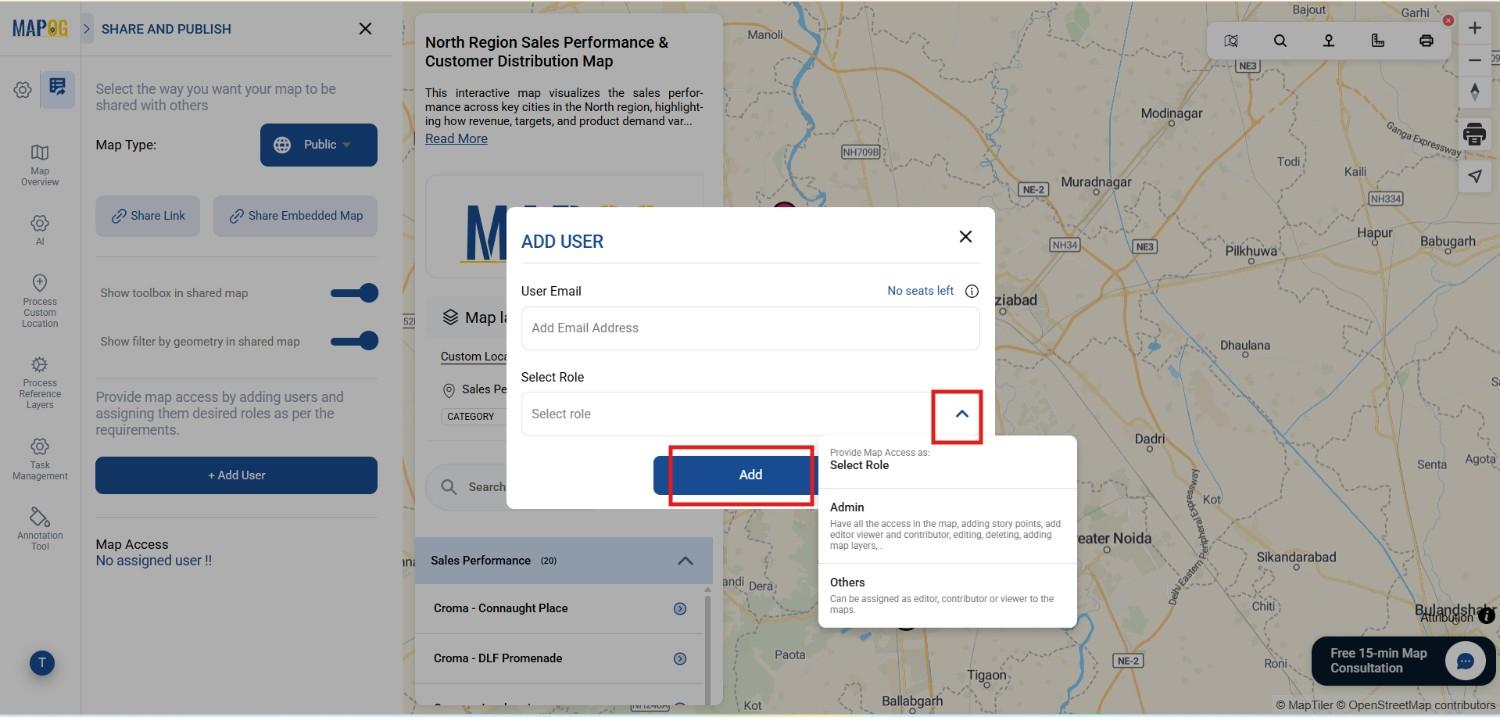
You can also add members to the map by their email id and assign them roles whether admin to have all access to map , editing or adding points etc and other options can either be editor , contributor or viewer to maps.
Now select the members from the dropdown select role whether editor or viewer and add them by clicking invite.
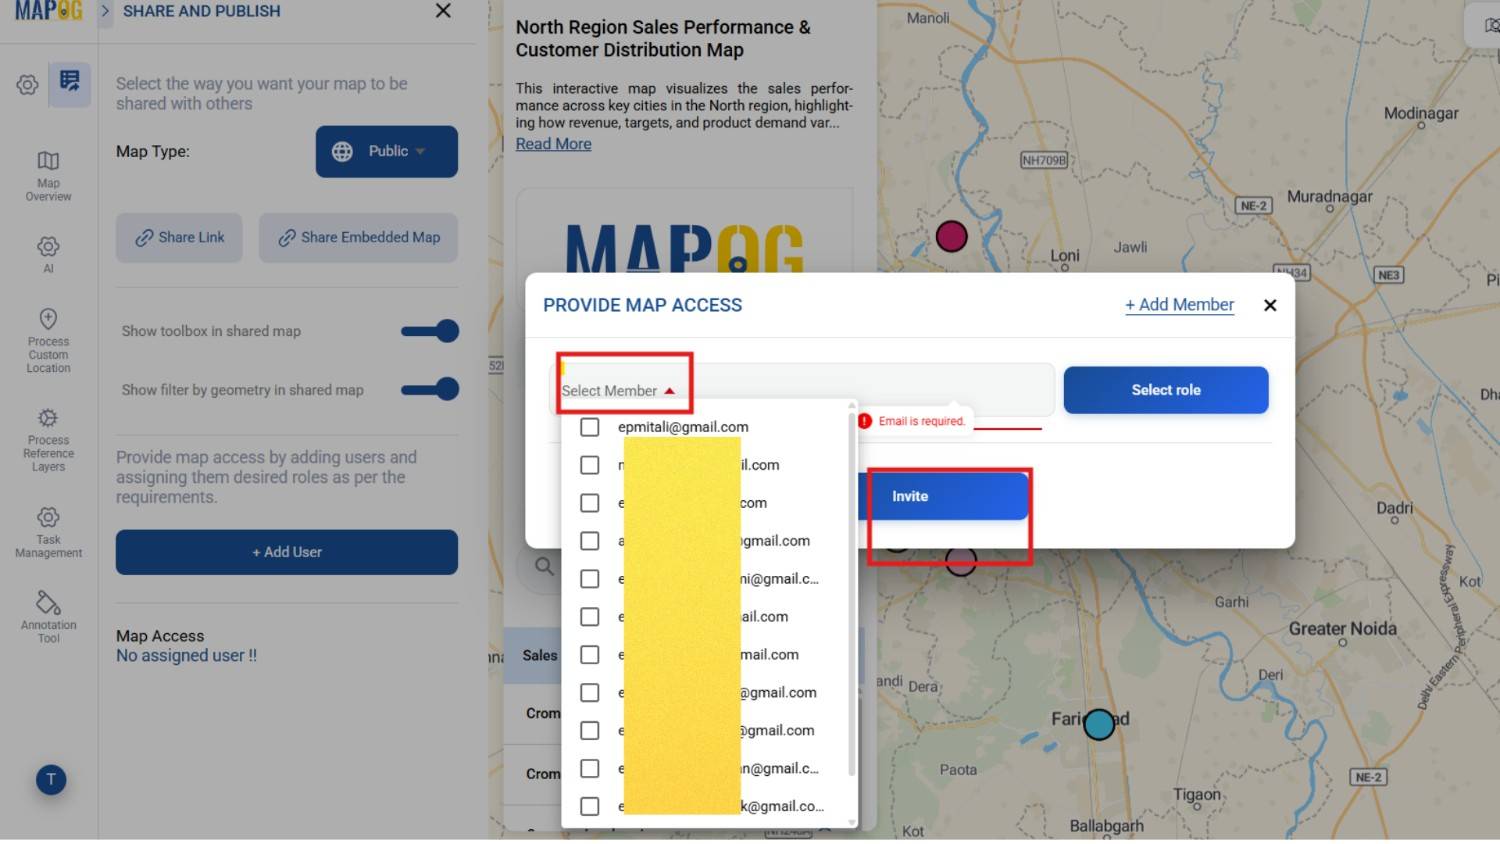
This ensures everyone can access the same real-time, interactive data without relying on static reports.
Conclusion
Presenting business data through maps transforms how teams and clients understand performance. Instead of analyzing spreadsheets, stakeholders can explore location-based insights in a more intuitive and visual way. Moreover, map-based visualization helps identify trends, improve coordination, and support faster decision-making.
By using MAPOG, businesses can turn their data into interactive, shareable maps that enhance both internal workflows and client communication.
Exploring Our Previous Blogs
- Role of GIS In Irrigation Planning and Water Resource Management
- How GIS and Smart Mapping Reduce Urban Heat Islands
- GIS in Infrastructure Development and Road Network Analysis