Track Task Progress visually instead of relying on scattered spreadsheets or delayed updates. Today, many infrastructure and field teams prefer map dashboards because teams can see completed vs pending tasks instantly. Moreover, when teams link task data to real locations, planning becomes faster and accountability improves. In this article, you’ll discover how to Track Task Progress using an interactive map dashboard, while also understanding how MAPOG simplifies this entire workflow using task management and CSV uploads.
Understanding the Key Concept: Track Task Progress on Maps
To Track Task Progress, location-based visualization plays a crucial role. Instead of reading long reports, teams view tasks directly on a map with clear status indicators. For example, teams map and monitor road maintenance activities such as pothole fixing, resurfacing, or marking updates in real time. As a result, decision-makers instantly identify pending work and completed tasks without confusion.
Step-by-Step Process to Track Task Progress on Maps
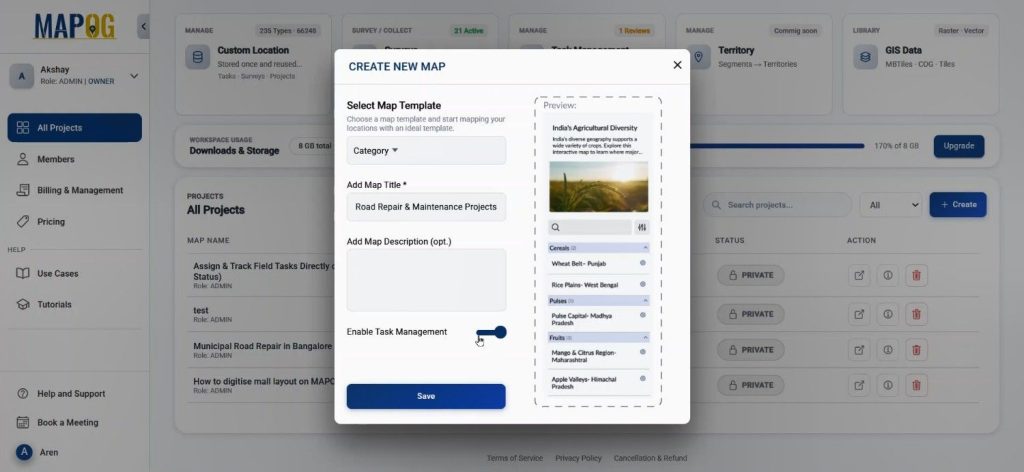
Step 1: Create a Project to Track Task Progress
First, open MAPOG and click on “Create.” Here, you add a clear title and description, while you enable the Task Management option before saving. Consequently, this setup prepares the dashboard to Track Task Progress efficiently from the start.
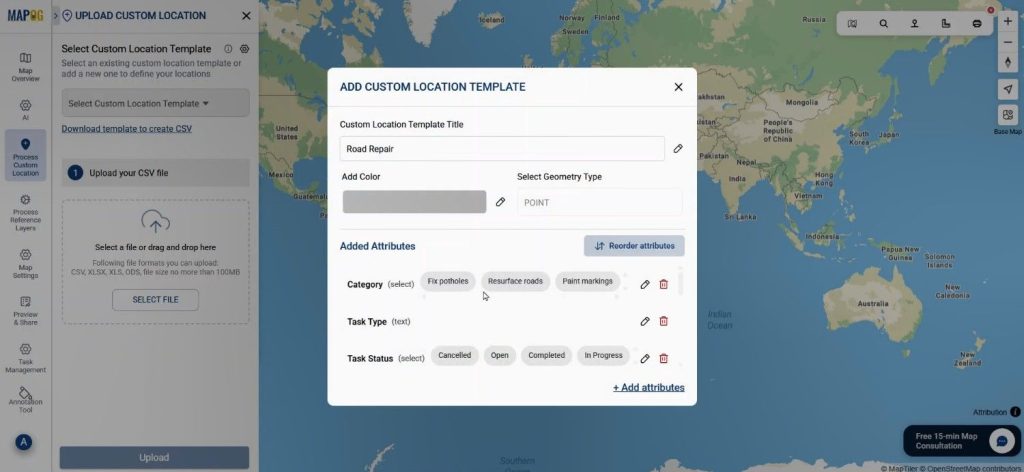
Step 2: Upload Location Data
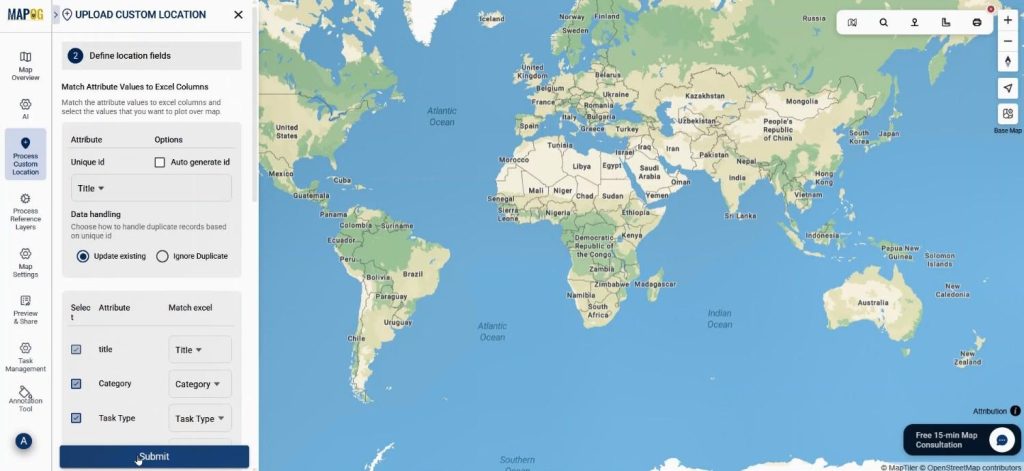
Next, move to the map interface. Using Process Custom Location, you select Add by uploading CSV/Excel in MAPOG. You then create a new custom field using the Select Custom Location Template, and you attach attributes.
Select the custom location you just created and upload the road maintenance file.
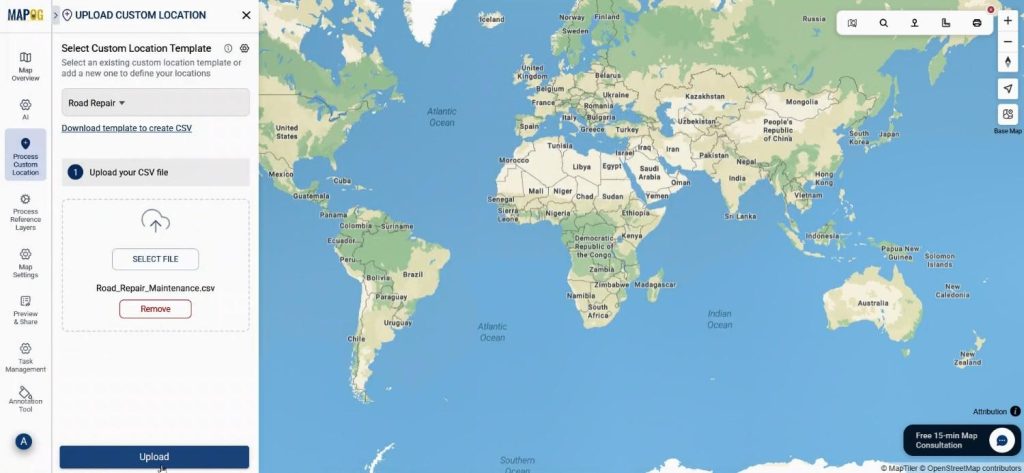
Meanwhile, the system matches columns with coordinates, and all task points auto-plot on the map, making Track Task Progress visually clear.
Step 3: Style Layers to Track Task Progress Clearly
After plotting, teams use category-based layer styling to color points by priority level. Therefore, high-priority pending tasks stand out instantly, helping teams Track Progress without manual filtering.
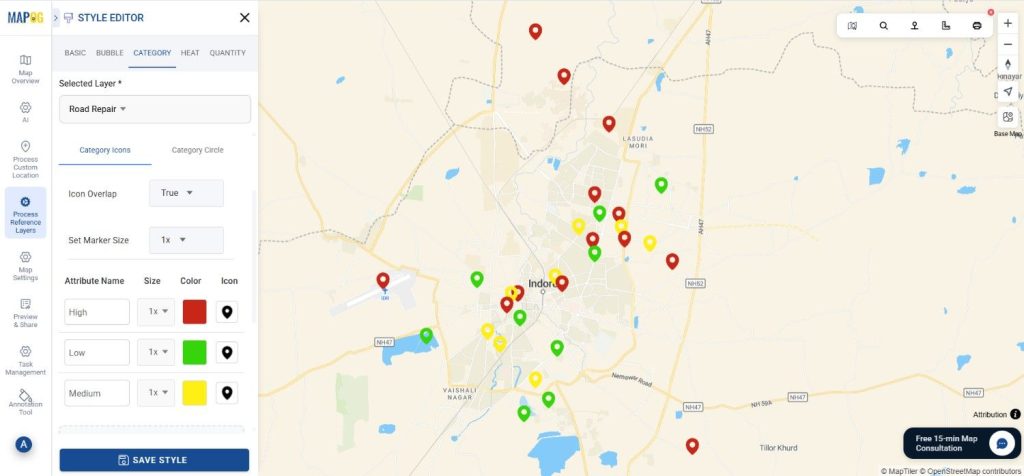
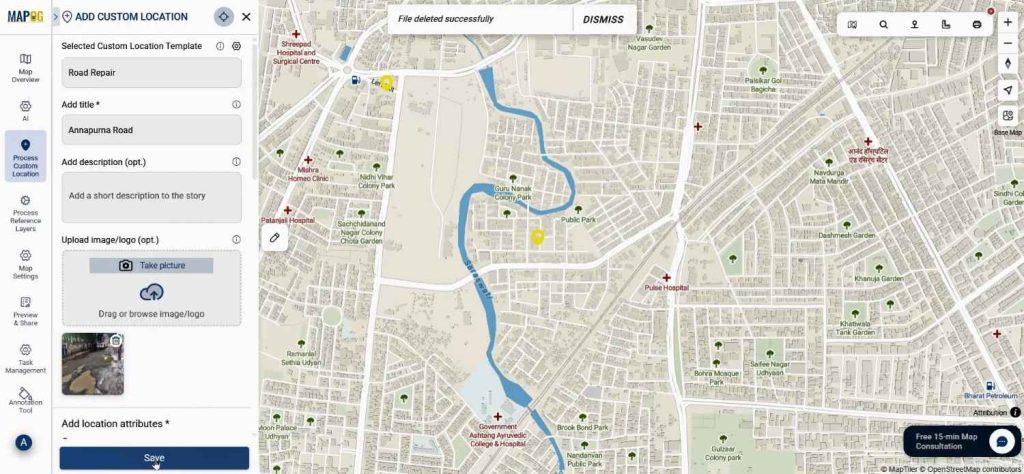
Then, users attach images directly by editing custom location details.
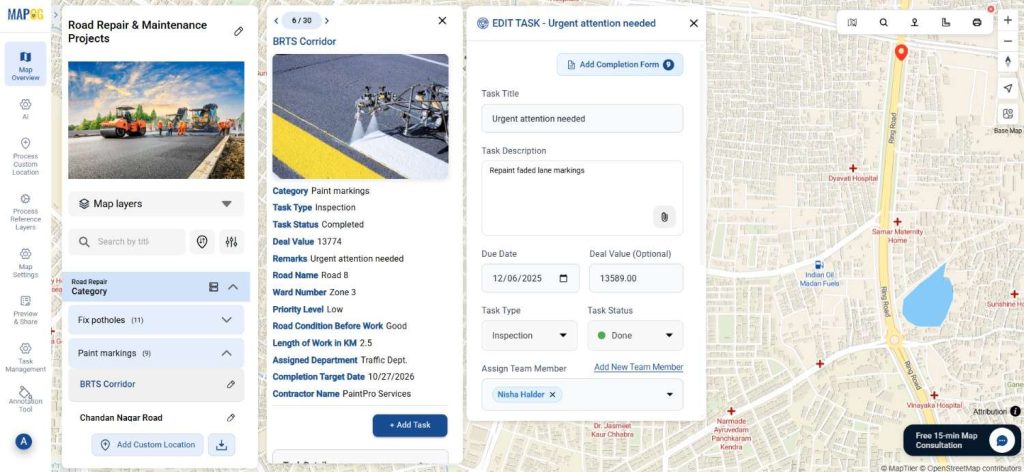
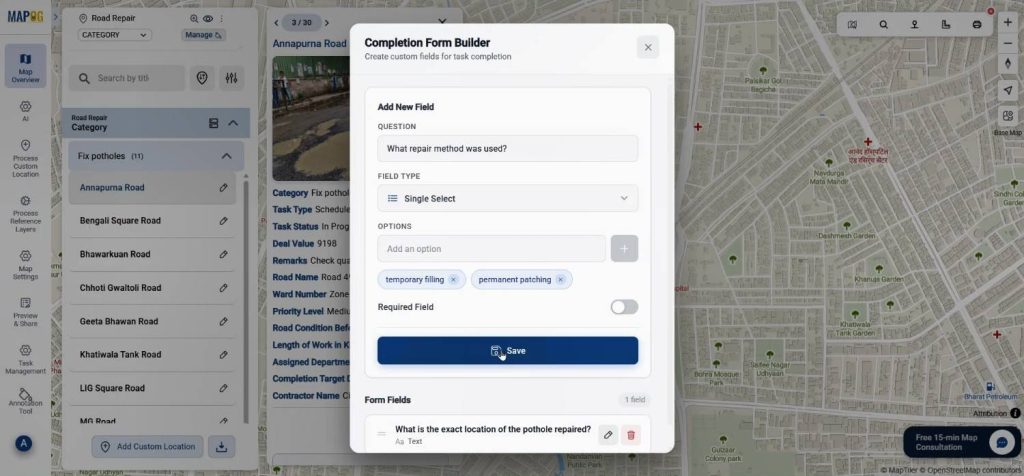
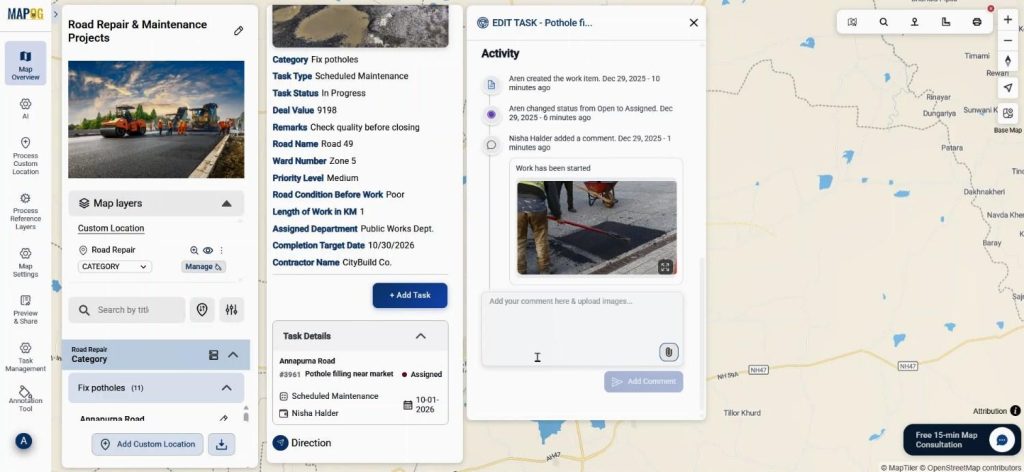
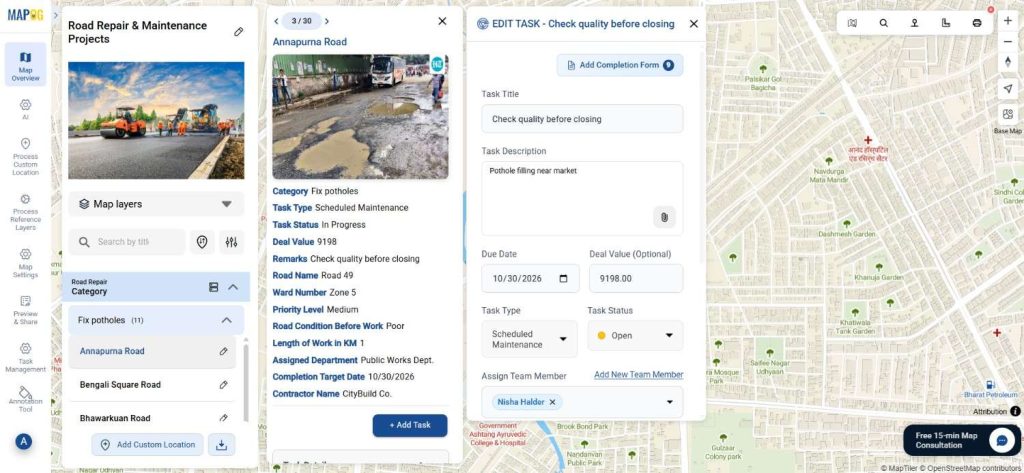
Step 4: Add Tasks and Completion Forms
Now, click “Add Task” and choose Add Completion Form in MAPOG.
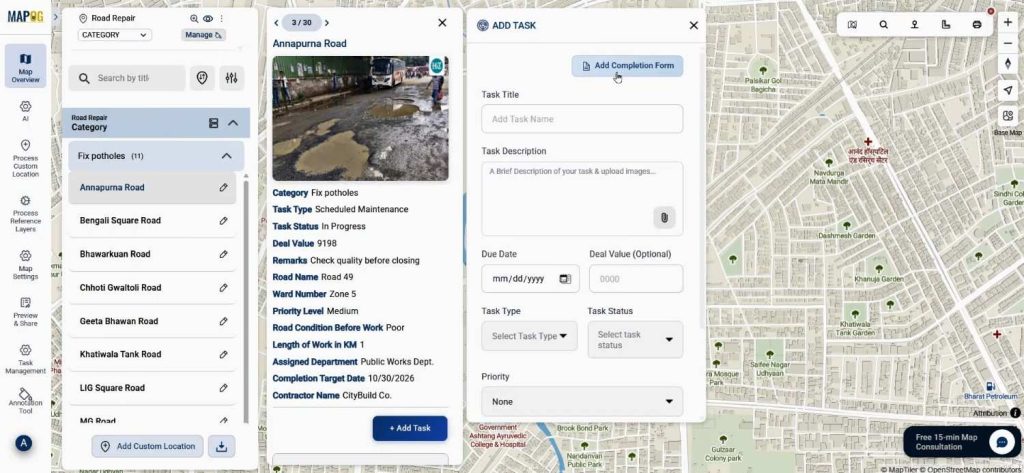
Relevant questions are added using selected field types.
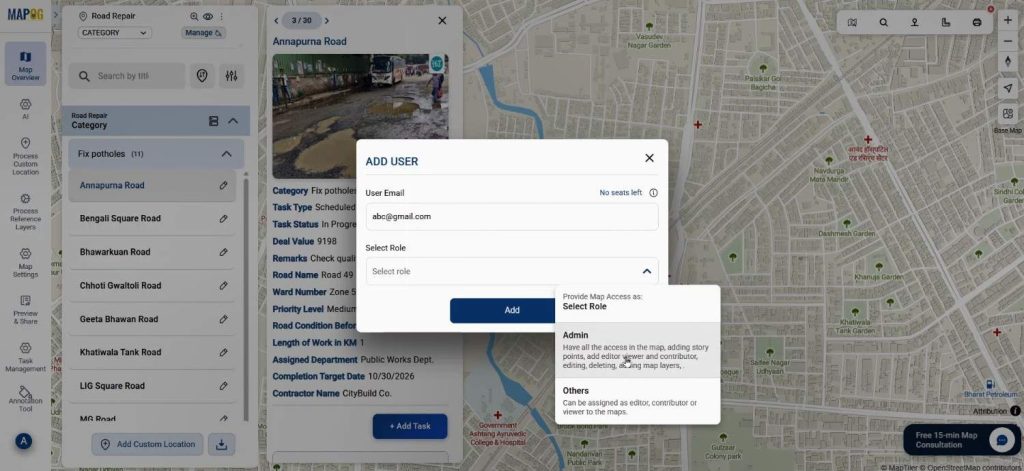
Using the add new team member option add assignee email address & select their role as admin or others & finally add them.
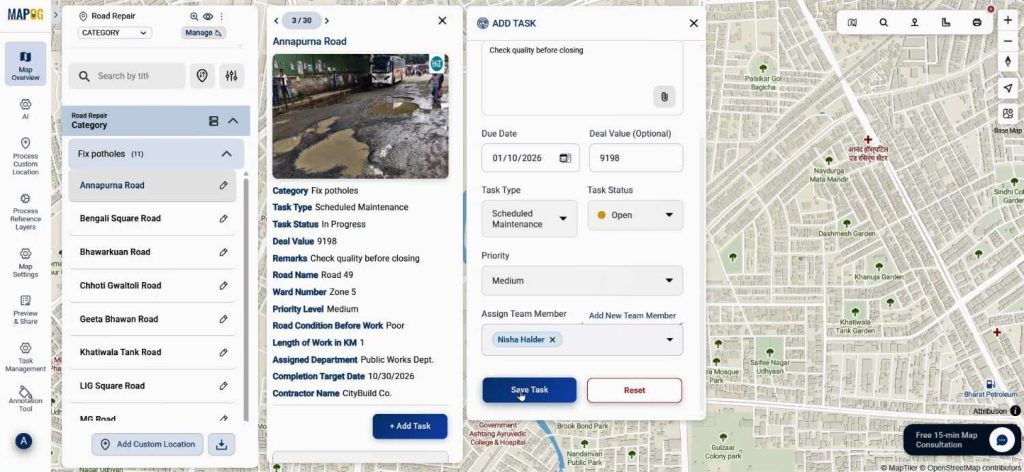
Teams add the task title, description, due date, deal value, task type, and status. Lastly, they assign a team member to the task and save it. Consequently, teams Track Progress through structured updates instead of informal messages.
Step 5: Assign Team Members
Once saved, assignees receive tasks in the MAPOG Contributor App, where they can comment, update status, complete the completion form and upload before-and-after images.
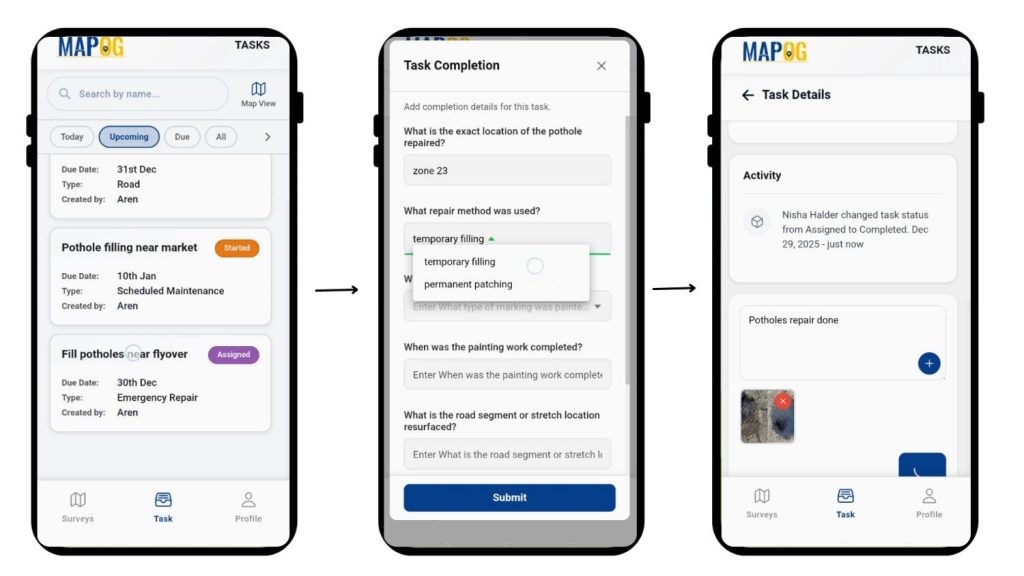
Meanwhile, progress is reflected live on the map dashboard, ensuring Track Task Progress happens in real time.
Industry Uses and Key Benefits
Municipal road maintenance teams, utility services, and field operations benefit greatly because this reduces delays, improves transparency, and enhances coordination. For example, supervisors can instantly verify completed resurfacing work while identifying pending pothole repairs without site visits.
Conclusion
In conclusion, Tracking Task Progress on a map dashboard transforms how field work is monitored. With MAPOG’s CSV upload, task creation, and real-time updates, completed and pending tasks stay visible, actionable, and well-organized. Explore how map-based task tracking can improve your workflow and decision-making today.
Download the contributor app from here:
Here are some other blogs you might be interested in