Discover geography and history by creating an interactive map of the 7 Wonders of the World—ideal for students, educators, and explorers. These iconic sites highlight human creativity, engineering, and cultural identity, each reflecting the unique legacy of its civilization. Using Geographic Information Systems (GIS), you can combine geography, history, and travel planning into an engaging and dynamic learning experience. Visual storytelling in today’s digital age makes it easy to plot, share, and explore these Wonders, transforming how educational and cultural content is experienced. This project inspires curiosity, deepens understanding, and connects learners to our shared global heritage.
Key Concept: Why the Seven wonders of the world Matter
Understanding why the 7 Wonders are significant goes beyond their physical beauty. They embody the technological advances, belief systems, and societal structures of their time. Each structure represents a pinnacle of human achievement. These sites also serve as cultural touchstones, inspiring art, literature, and global tourism. By studying them interactively, learners can grasp the intersection of place, history, and culture, enriching their global perspective. Storytelling Maps provides a dynamic approach to learning that integrates visuals with storytelling, thereby making history both immersive and memorable.
Educational Importance and Uses of Mapping the Seven wonders of the world
Mapping the 7 Wonders using GIS technology brings multiple educational benefits that support a wide range of learning goals:
- Geographic Literacy: To begin with, this facilitates the identification of wonders on a world map, thereby imparting knowledge of continents, countries, terrains, and coordinates.
- Cultural Understanding: Furthermore, it provides an exploration of diverse cultures and belief systems, thereby fostering a comprehensive global awareness and cultural appreciation.
- Interactive Learning: In addition, it actively engages users through interactive elements such as clickable maps, images, and detailed descriptions, thus enhancing depth of understanding.
- Digital Skills Development: Moreover, it cultivates essential technical competencies in digital mapping and spatial analysis.
- Tourism Awareness: Lastly, it underscores the critical role that wonders play in cultural heritage, tourism, and the economic vitality of local communities.
Methodology: Creating a 7 Wonders Interactive Map Using GIS
This step-by-step guide, titled “Learn geography and history by creating an interactive map that highlights the 7 Wonders of the World,” will walk you through the process of creating a dynamic, interactive map using MAPOG. To make the tutorial both practical and engaging, we’ll use the 7 Wonders of the World as our example—demonstrating how to add each monument with images and detailed information, and how to easily share the finished map across platforms or embed it into a blog or webpage.
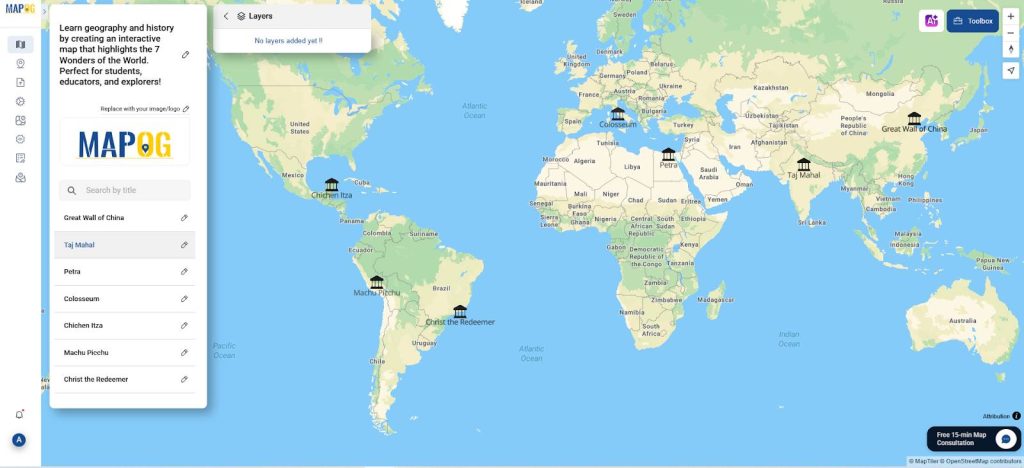
1. Selection of the 7 Wonders
- To start, compile a list of the New 7 Wonders of the World, chosen in a global campaign and widely recognized for their beauty and historical impact:
- Great Wall of China – China
- Petra – Jordan
- Christ the Redeemer – Brazil
- Machu Picchu – Peru
- Chichen Itza – Mexico
- Roman Colosseum – Italy
- Taj Mahal – India
- Each of these sites was selected for its architectural grandeur, engineering significance, and enduring cultural legacy.
- Including a brief historical overview of each Wonder enhances the educational value of the map.
2. Gathering Geographic Coordinates
- Once the sites are selected, the next step is to collect accurate latitude and longitude coordinates for each Wonder. This can be done using trusted sources such as UNESCO’s World Heritage database, reputable academic references, or official tourism websites.
- These precise coordinates are crucial, as they ensure each site is accurately positioned on the map—an essential factor for maintaining both spatial accuracy and educational credibility.
- For ease of use, you can store these coordinates in a spreadsheet, allowing for quick import or manual entry into our mapping tool, depending on your preferred workflow.
3. Adding Points Using MAPOG
Now it’s time to bring the map to life:
- Navigate to “Create new map” in MAPOG and select “Default” as your story type to create an educational journey.
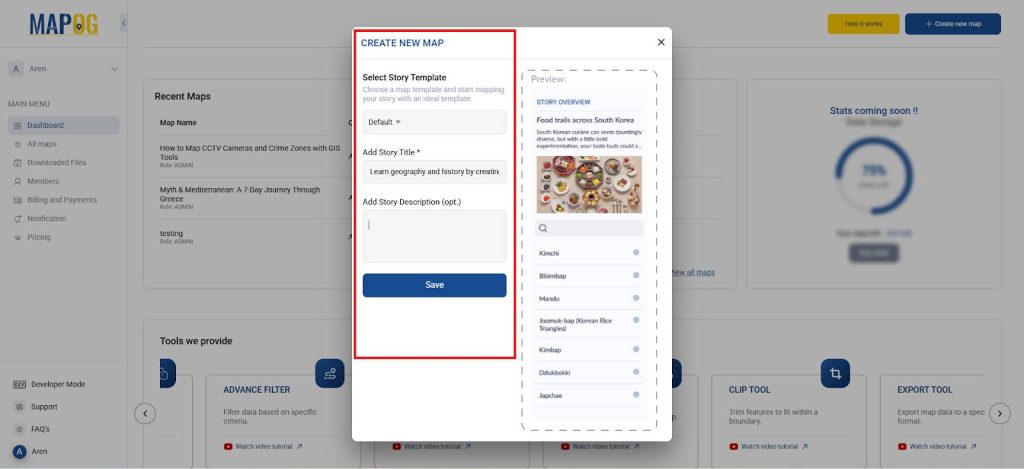
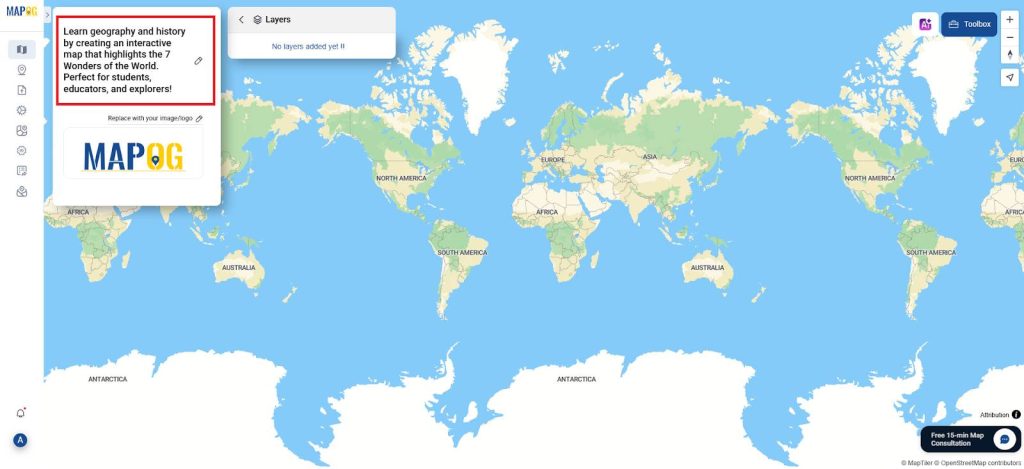
- Sure! Here’s the story title as you requested: Learn geography and history by creating an interactive map that highlights the 7 Wonders of the World. Perfect for students, educators, and explorers!
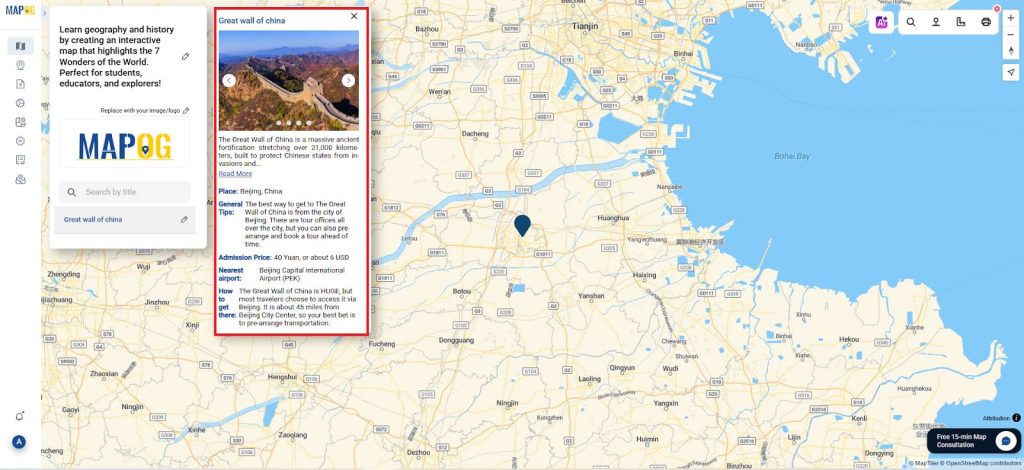
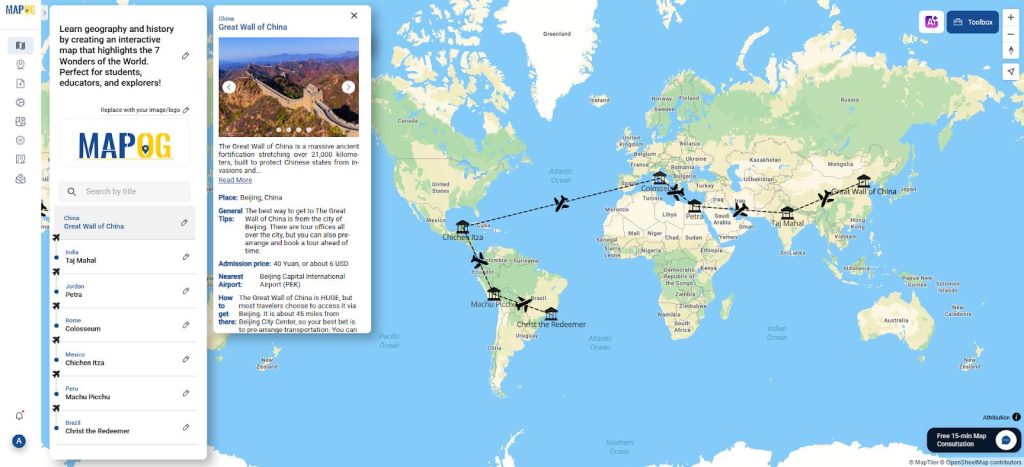
- For each Wonder, add a point manually by selecting “Add story“. Go to the “Select Point Type” and create a new category called “World Wonder”.

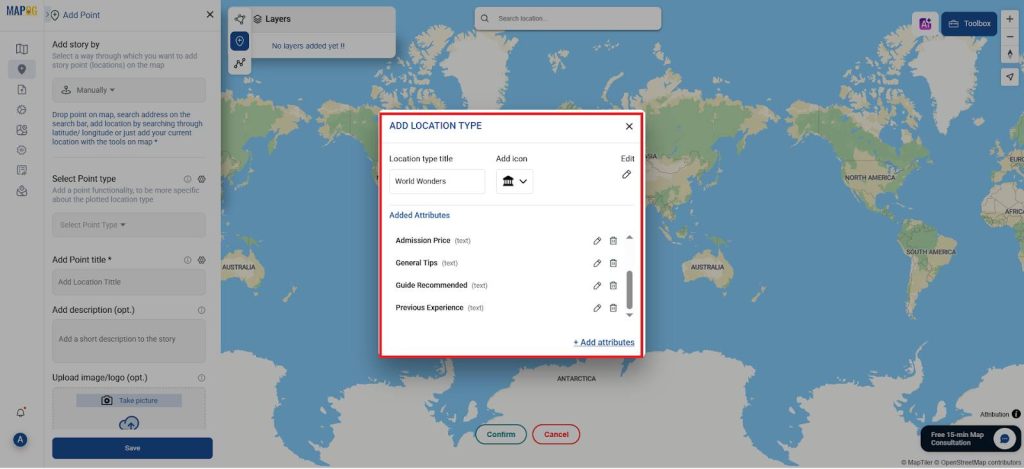
- Add custom attributes such as Place, Nearest Airport, How to Get There, Admission Price, General Tips, Guide Recommended, and Previous Experience as text.
- Subsequently, enter the details manually for all the wonders as demonstrated below
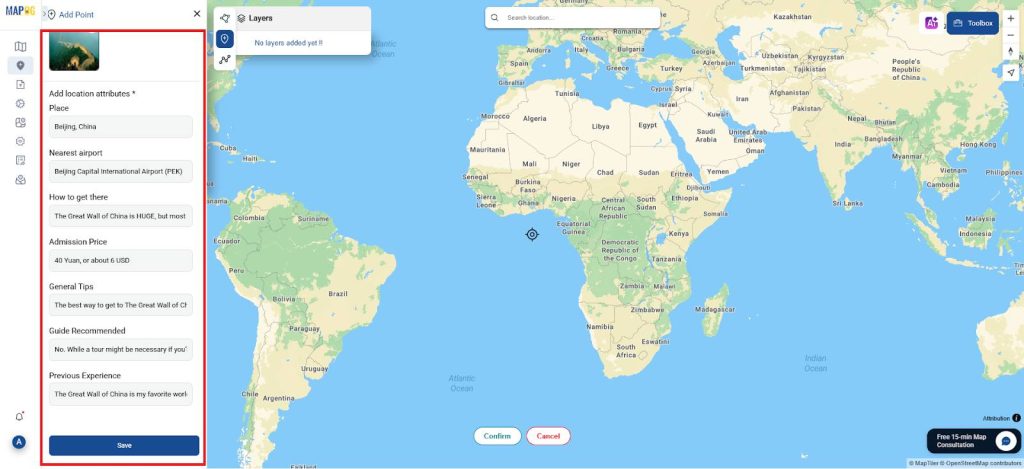
- Use the toolbox icon to enter the exact latitude and longitude of each Wonder and confirm the point.
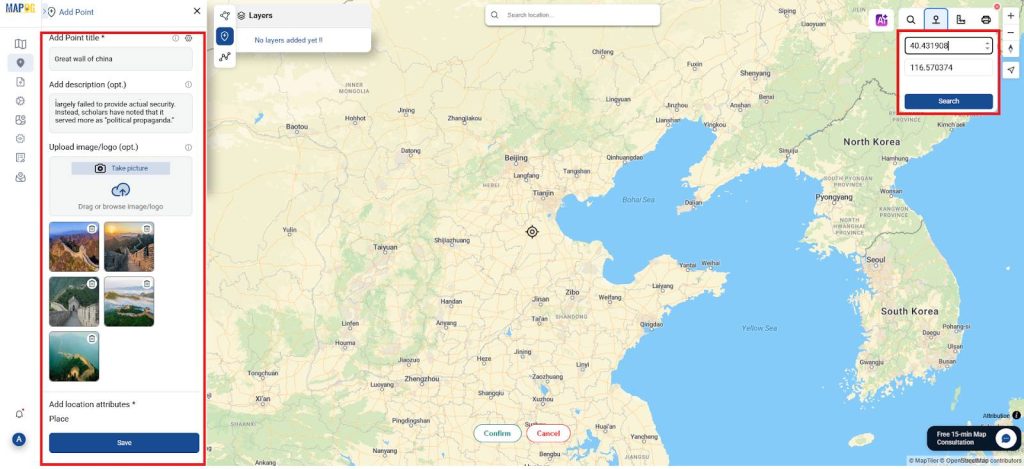
- Label the point with the name of the Wonder, provide a detailed description, upload a relevant image, and save the point.
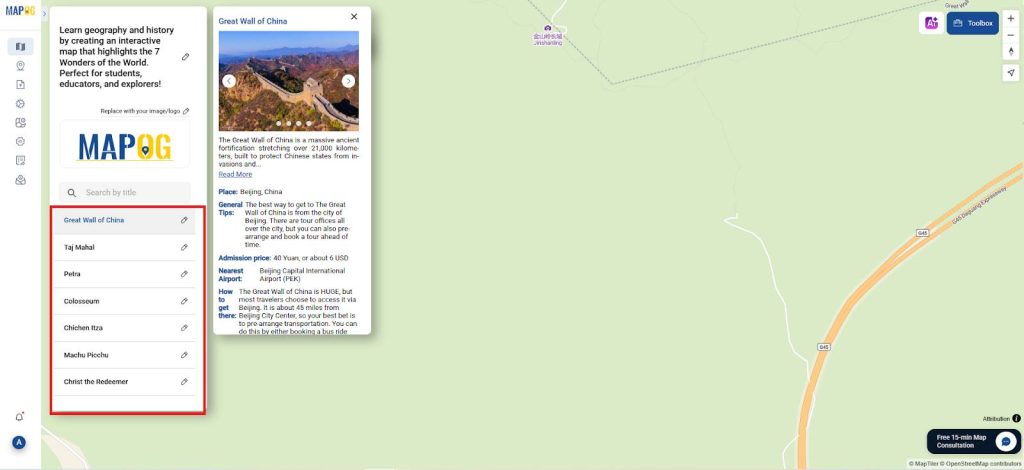
- Repeat this step for all 7 Wonders.
- You now have an educational map ready to be explored!
4. Styling and Visualization
- To make your map visually engaging and informative:
- Style each point using colors or icons that reflect the site’s architecture or geographic location.
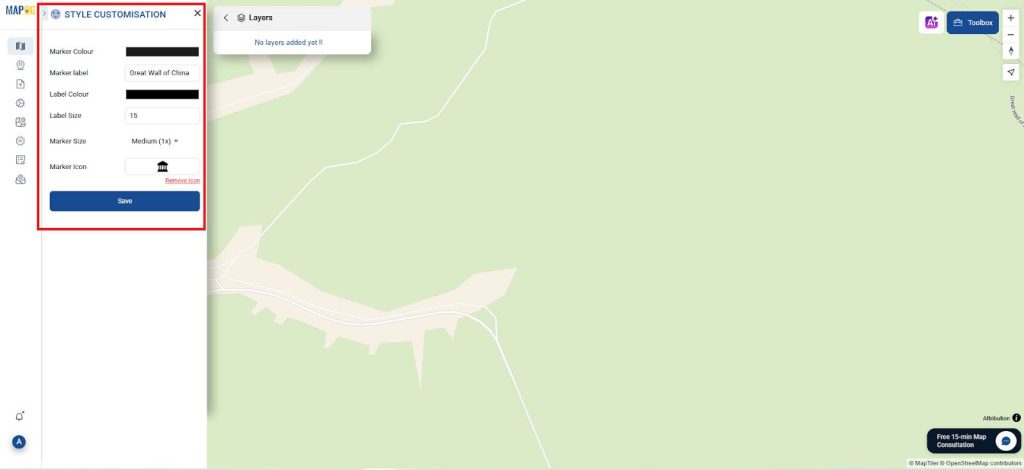
- You can use ancient temple icons or culturally themed markers to distinguish each site.
- These visual elements ensure the map is not only educational but also enjoyable to interact with, helping users absorb more information intuitively.
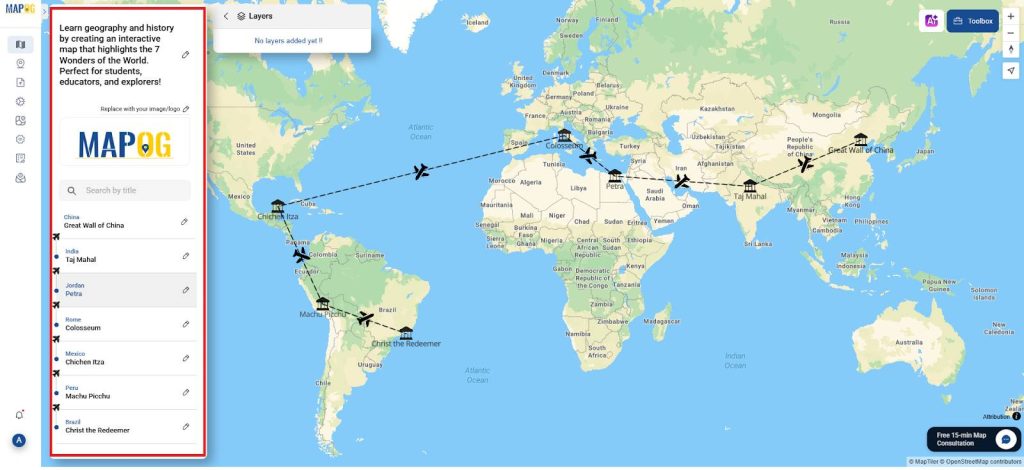
5. Location connection
- To establish a local connection to all the world wonders
- Select the location connection and select as the straight line and we can travel through the flights over various countries. So, Select the Icon as an Airplane.
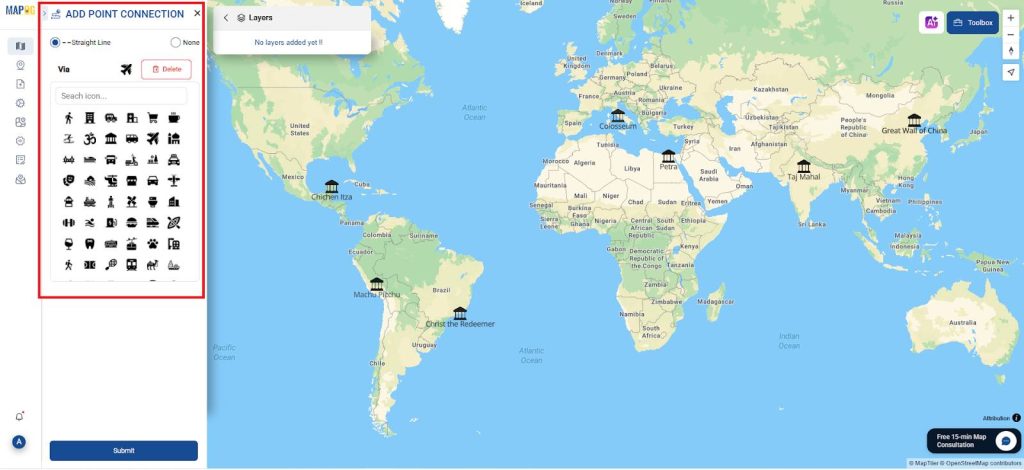
- This is the final connection made for all the locations so that we can make it easier in short-distance mapping across various locations by providing navigation, accurate geolocation, and route optimization.
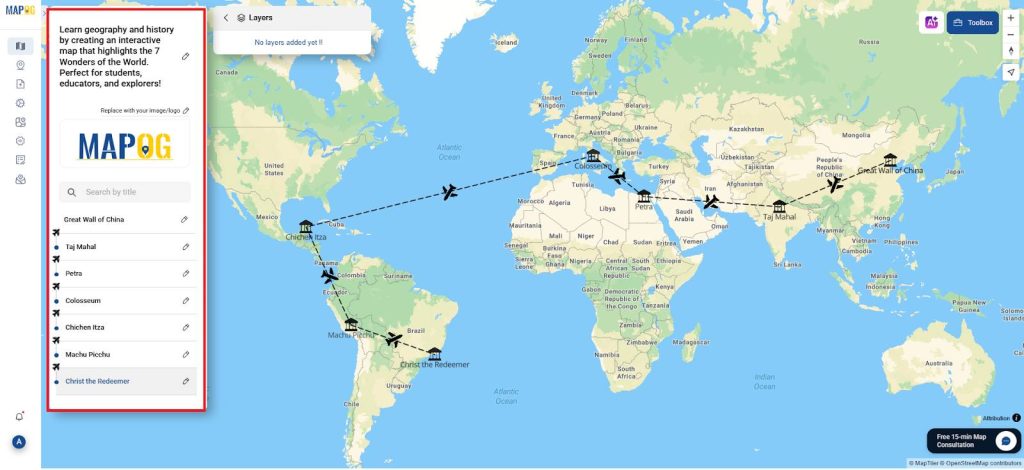
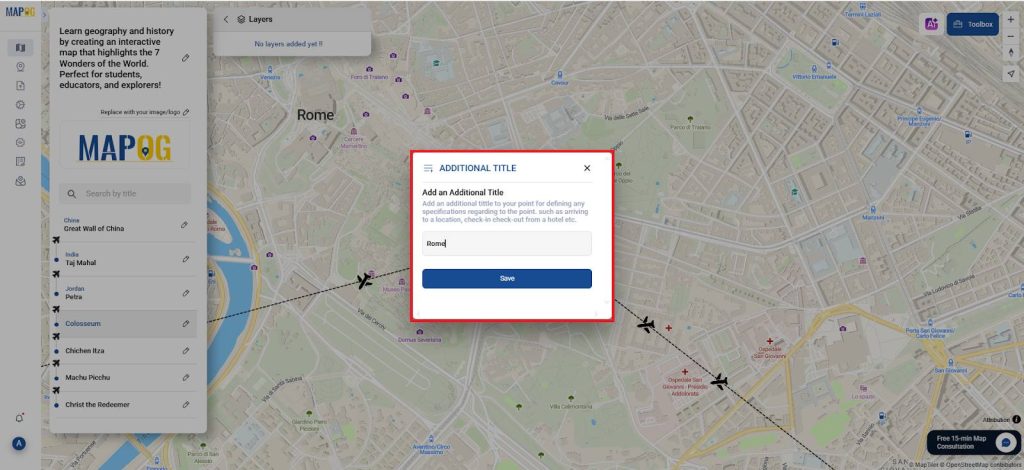
- Additionally you can add the additional title for the each location,
- and give the country name for better visualization as shown below
- Similarly add for all the World wonders.
6. Presentation and Sharing
Once your map is complete:
- Use the “Publish & Share” function in MAPOG to create a public URL or embed it in a webpage or blog post.
- This enables educators to seamlessly integrate the map into online lessons, allows students to showcase their projects, and gives travelers a way to preview destinations
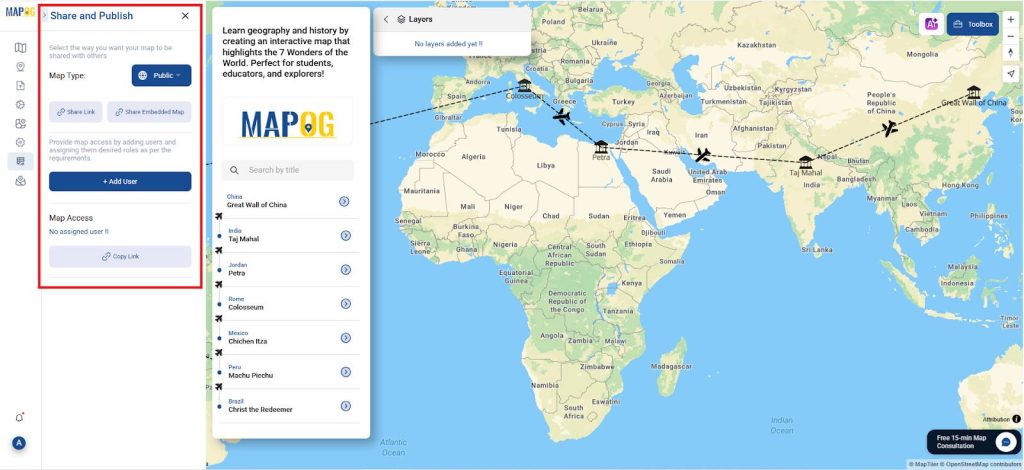
- The interactive design fosters storytelling, exploration, and reflection, making it well-suited for both classroom environments and informal learning settings.
- It invites users to engage deeply with the content, whether as part of a guided lesson or through self-directed discovery.
- Moreover, the map functions as a gateway to independent inquiry, actively encouraging users to delve further into each location’s unique history, architectural significance, and cultural context.
- his approach not only enriches the learning experience but also inspires curiosity and critical thinking beyond the digital interface.
Principal Results of Mapping the 7 Wonders
The end result is a dynamic and informative storytelling map that presents the 7 Wonders with rich context, clear visuals, and engaging interactivity. More than simply showing where these Wonders are located, the map delves into why they matter, how we can visit them, and what valuable lessons they offer. Through this digital experience, students and viewers alike can explore the global distribution of ancient civilizations, analyze and compare architectural styles across cultures, and even design hypothetical journeys to these iconic sites. In doing so, the project significantly enhances global awareness, strengthens spatial reasoning, and deepens cultural understanding—all within an accessible and user-friendly digital format.
Industry and Domain
- Industry: This innovative initiative spans across multiple sectors, including Education Technology (EdTech), Geospatial Technology, and Cultural Tourism. By blending cutting-edge technology with dynamic educational strategies. It creates engaging digital content that not only supports exploration but also enhances learning experiences in meaningful ways.
- Domain: The initiative intersects with several key domains, such as Historical Geography, World History, Cultural Studies, and Digital Humanities. As a result. It offers valuable insights for a wide range of users—including educators, researchers, and heritage enthusiasts—who can all benefit from the interactive and informative capabilities this mapping tool provides.
Conclusion
The GIS-based mapping of the 7 Wonders is more than just a digital activity—it is. In fact, an immersive and interactive storytelling learning journey. It seamlessly combines historical insight with geographic precision, effectively transforming static facts into a dynamic and compelling visual experience. By exploring these wonders on a digital map. Learners not only deepen their understanding of the world but also develop essential skills in critical thinking, research, and spatial analysis. Moreover, this powerful educational tool empowers users to meaningfully connect past achievements with present-day. Learning, all within a format that is both highly informative and genuinely inspiring.
So, are you ready to discover the world’s greatest Wonders? Start building your own map today and journey through history like never before—with the power of GIS and MAPOG guiding your way!
MAPOG was utilized across multiple studies referenced in this context.
- Role of GIS In Irrigation Planning and Water Resource Management
- How GIS and Smart Mapping Reduce Urban Heat Islands
- GIS in Infrastructure Development and Road Network Analysis
- Flood Risk Mapping with Interactive Web Maps: SaaS Approach
- Optimizing Warehouse Location Selection with GIS for Supply Chain Efficiency