Finding the right property can be frustrating with scattered listings, unclear locations, limited visuals, and incomplete details often leave buyers confused and overwhelmed. A smarter solution is to upload property listings on a map with images and full details using MAPOG. By combining precise location pins with high-quality visuals, pricing, descriptions, and key features, real estate searches become more transparent, efficient, and location-driven—helping agents show properties more efficiently and for users to make faster and more confident decisions.
Key concept of the map
The key concept of the map is to upload property listings on a map and transform property data into a visual, location-based experience. Each property appears as a point on an interactive map with images, pricing, area details, and notes which allows users to explore, manage, and present properties directly through their real-world location, making it easier to understand at a glance.
Step-by-step method of creating map
Step 1: Create a new map
Go to MAPOG, click on ‘Create new map’. Choose the map template as ‘Category’, add title, description and click ‘Create’.
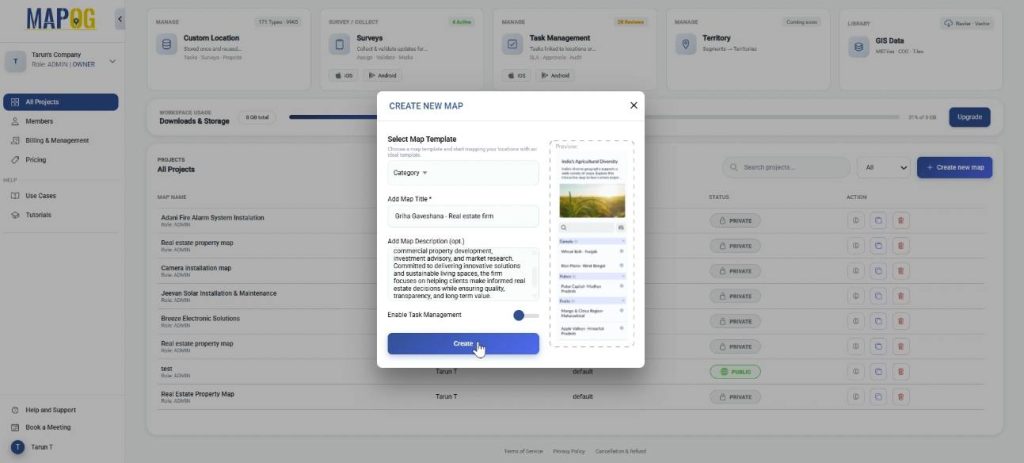
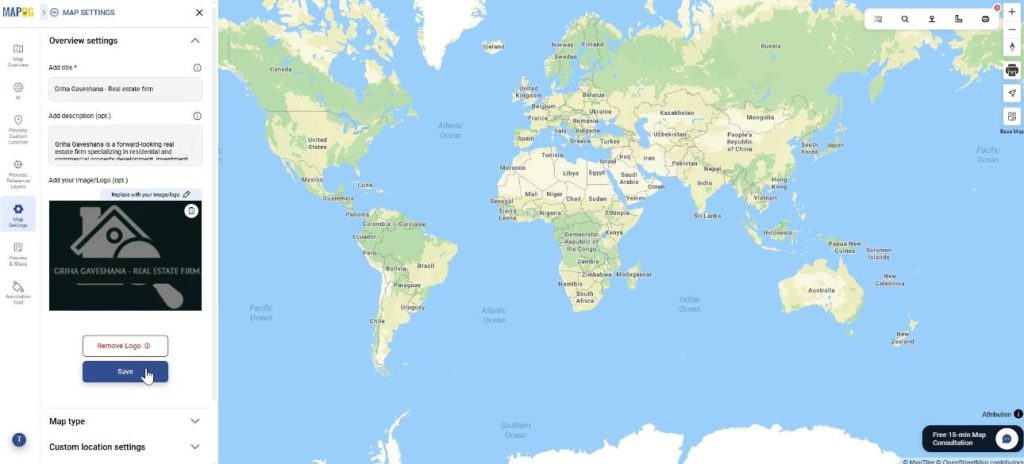
Go to Map settings and using replace option add the company logo and save.
Step 2: Create an excel sheet for attributes
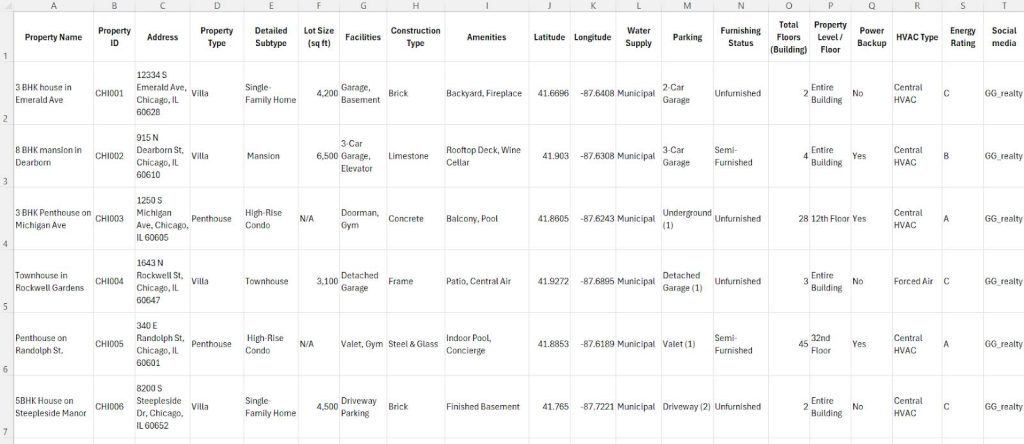
Create an Excel sheet with your property details, so you can upload them to the map.
Step 3: Create new custom location template
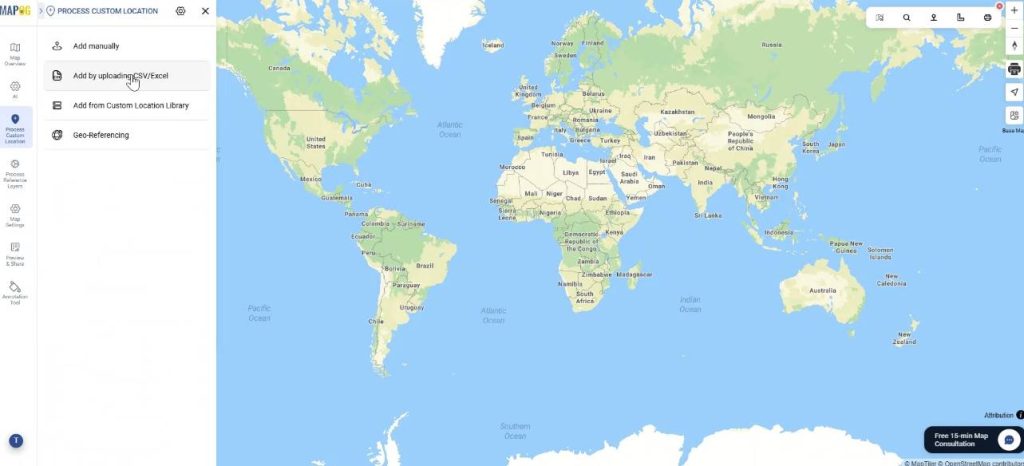
Next, go to Process Custom location and ‘add by uploading CSV/Excel’, so that you can add all your details from the spreadsheet to the map.
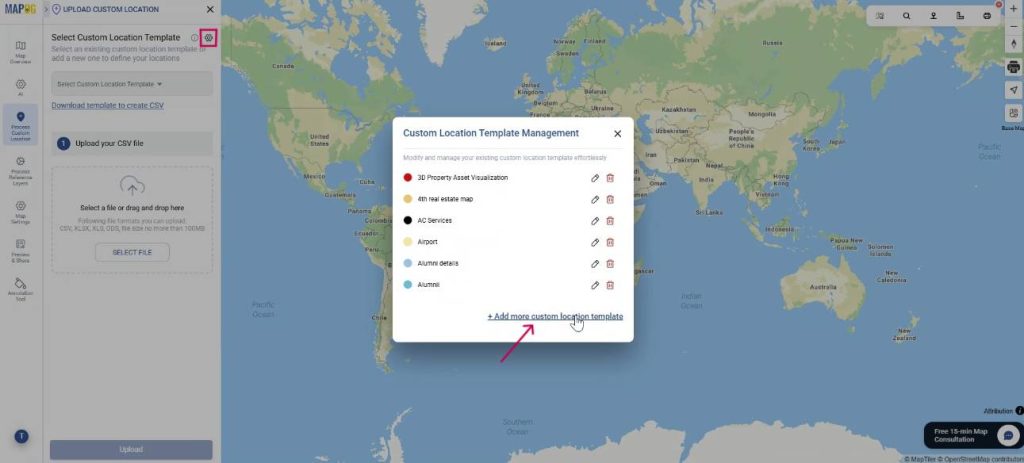
Now, to create your custom location template in order to add all the different attributes from excel, go to custom location template settings and click on ‘+Add more custom location template’.
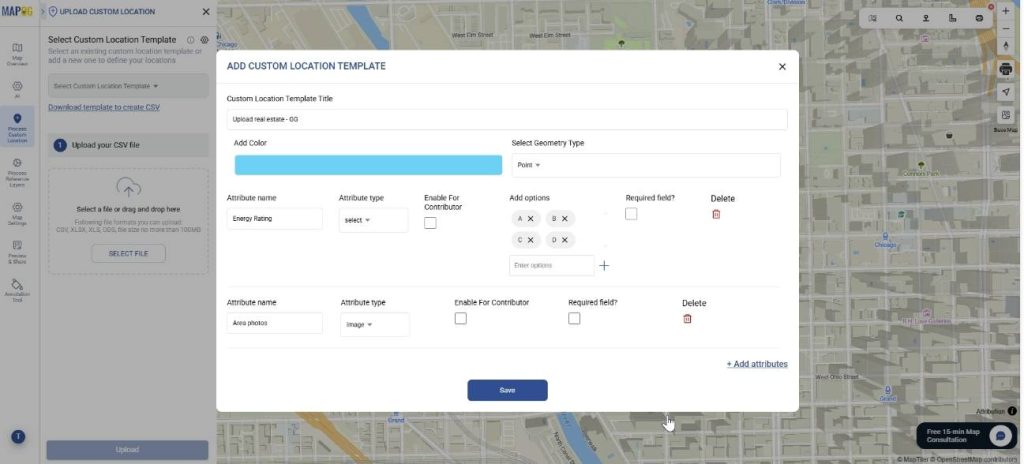
Further, add title, color and select geometry as a point. Then add all your attributes such as location name, address, property type, area photos, etc. with attribute type such as select, multiselect or photo & save them.
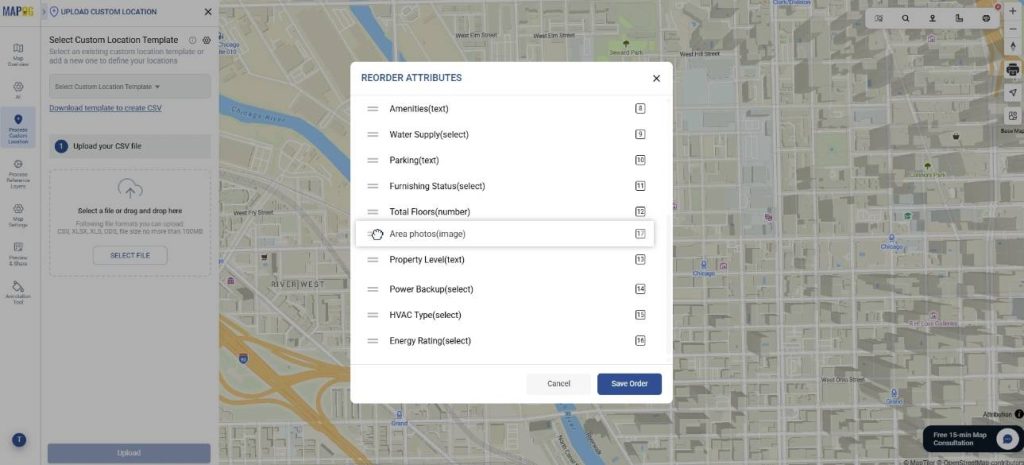
Further you can even reorder your attributes according to the priority in which they should appear by dragging them upward or downward, then save the order.
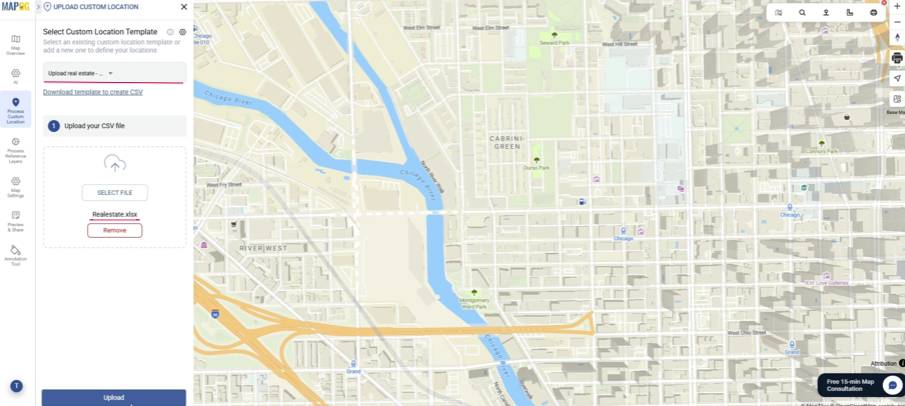
Now, select your custom location template from the dropdown and upload your excel file. Finally, click upload.
Step 4: Define location fields
Firstly, assign each point with a unique ID. This can be auto generated as well as assigned using an excel column. This is important for keeping track of locations and avoiding duplicates. .
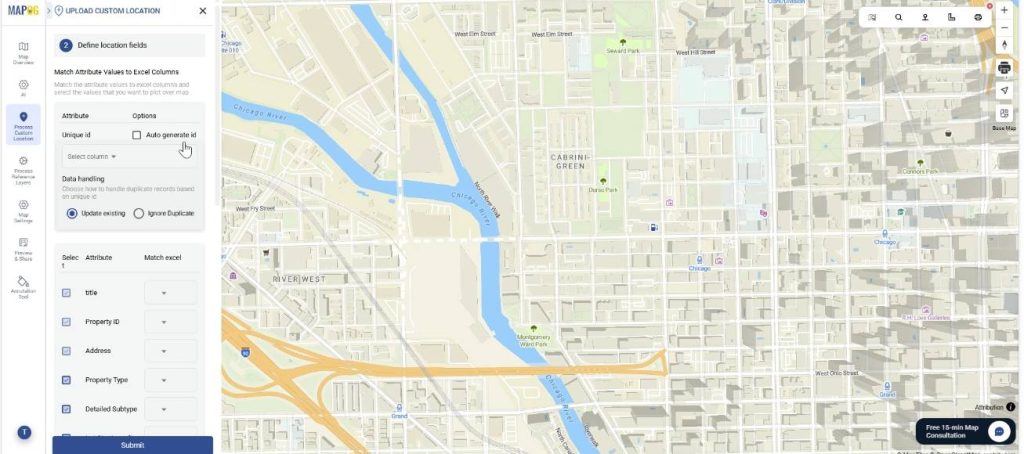
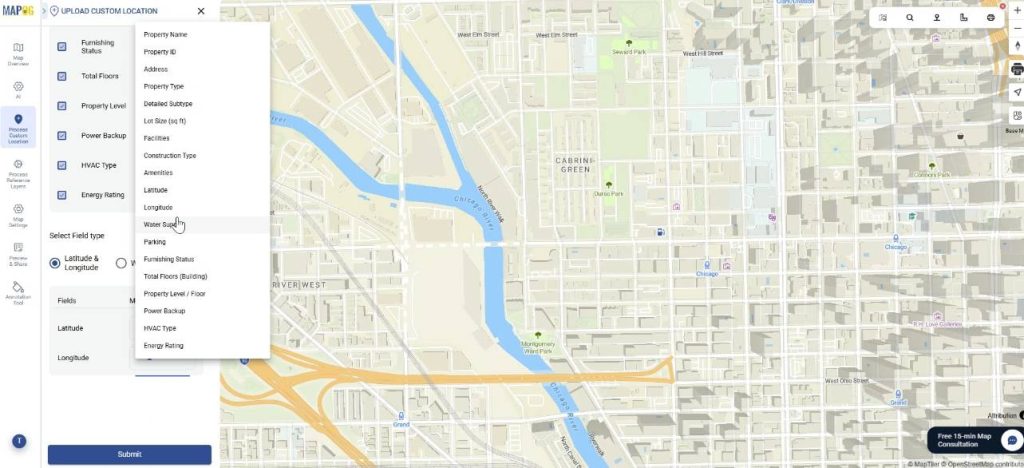
First, match each custom attribute to its corresponding excel data column to upload the data easily. Lastly, select the field type and match your Latitude and Longitude column & submit. Your points will be auto-plotted on the map.
Step 5: Edit custom location details
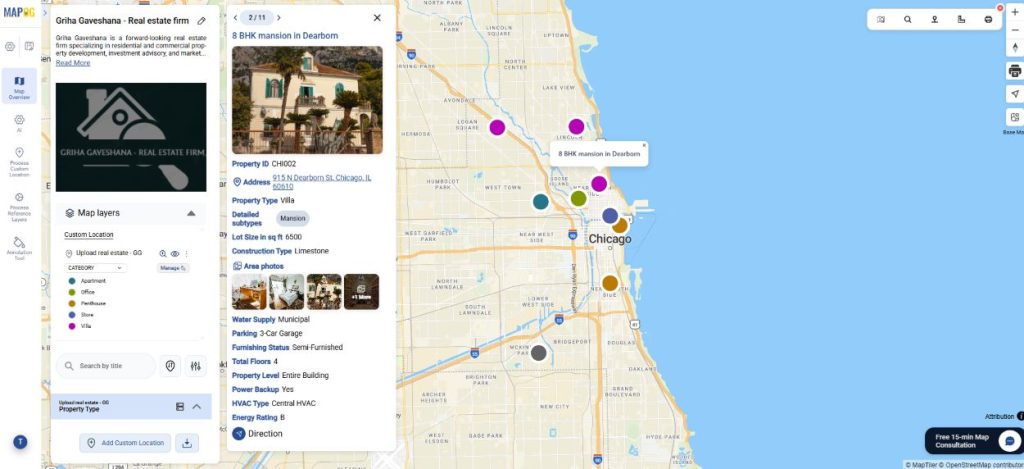
Optionally, you can choose to edit custom location details for each point. Go to edit custom location details.
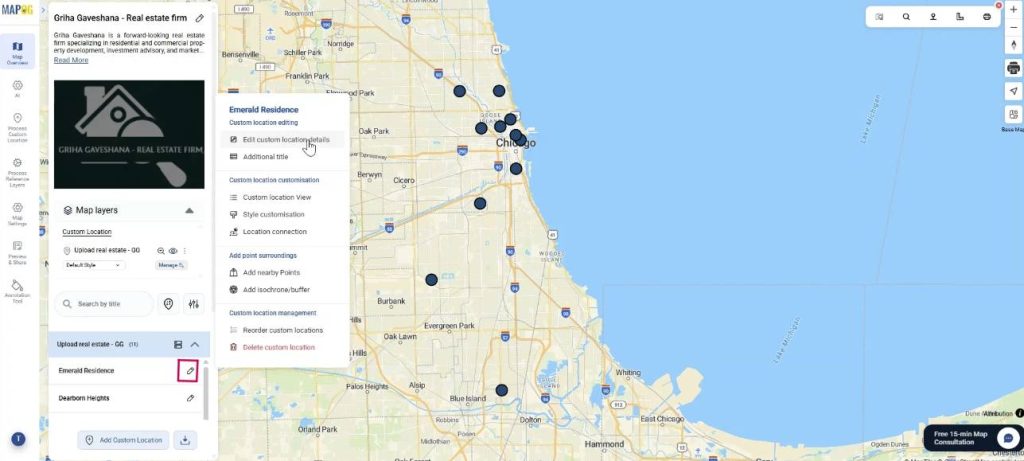
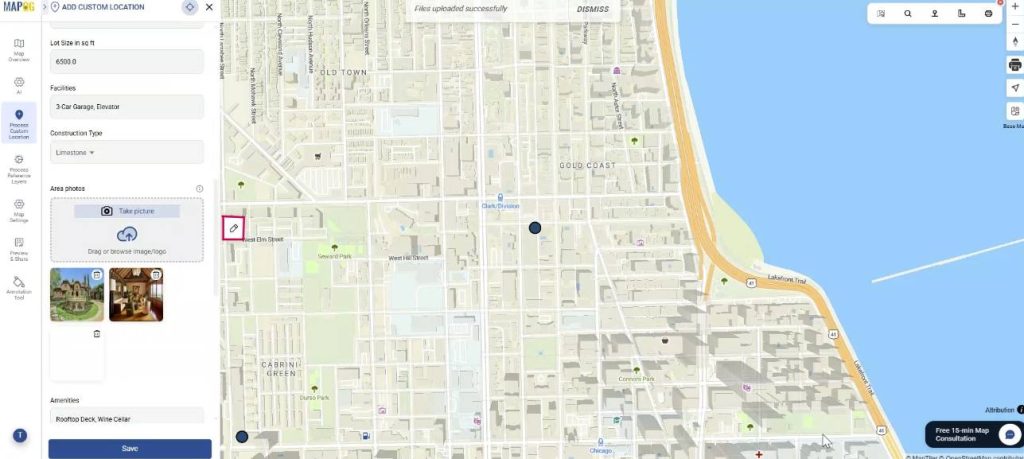
Add property images, social media links, other details or edit the location itself and save.
Step 6: Style icons for the map
Next, go to add layer style to style the icons according to their size and shape.
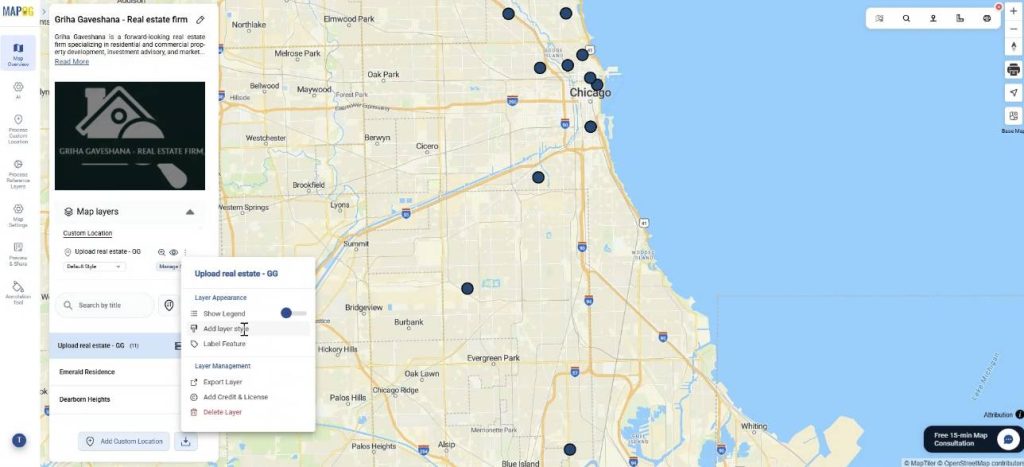
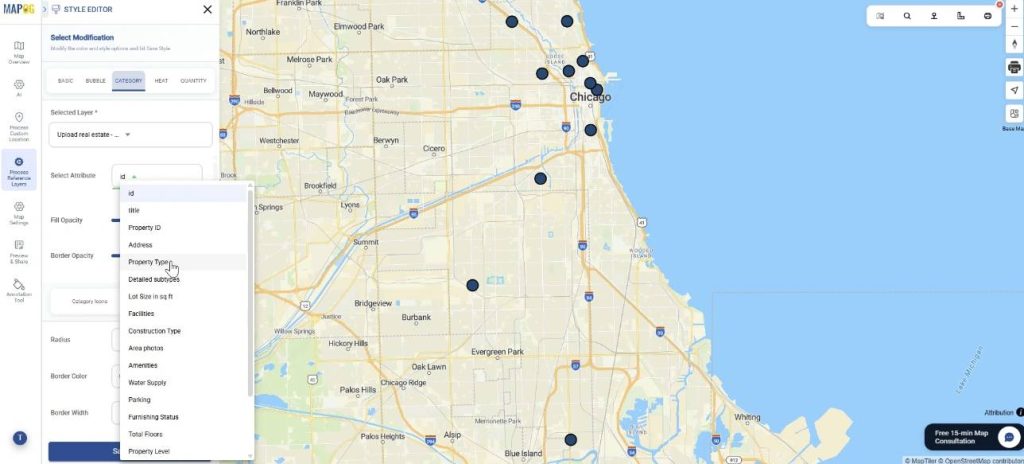
Go to Category style and select any attribute (e.g property type) to differently style the points.
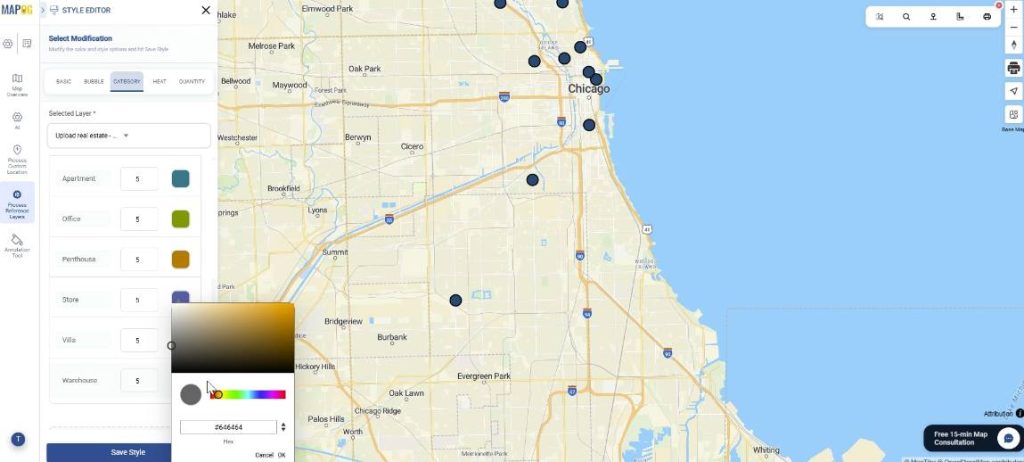
Further, choose a suitable colour and size for the attributes and save.
Step 7: Group By, Filter and Sort your locations
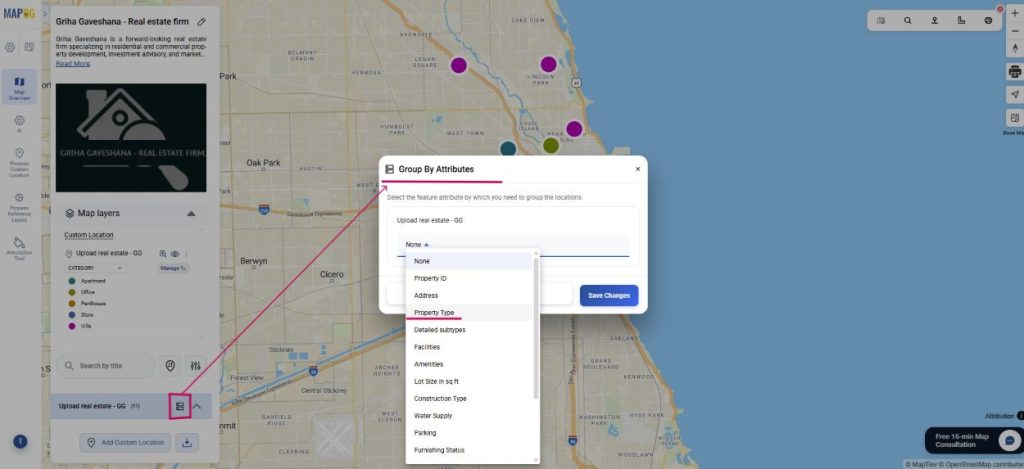
Next, organize your custom locations using “Group by Attributes”. Choose the attribute you want to cluster your data by, such as Property type. Your data will therefore be grouped based on type such as villa or penthouse.
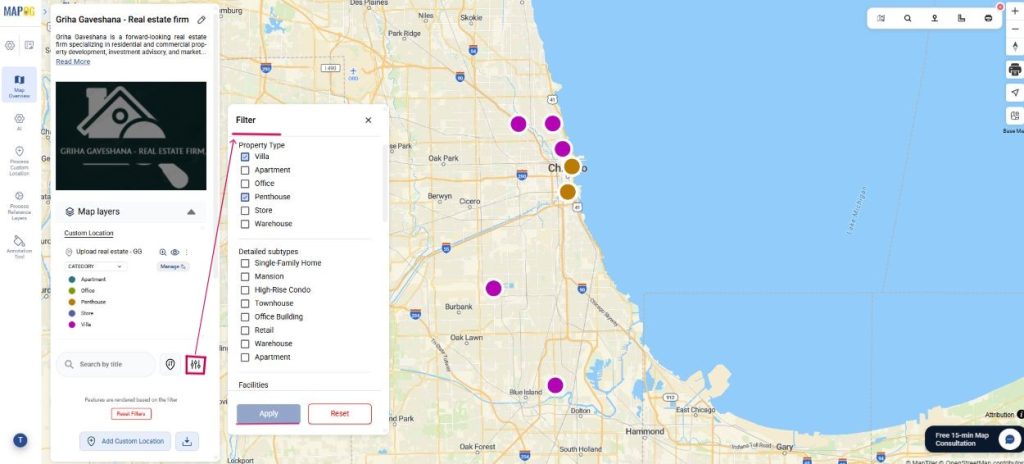
Use the Filter option to selectively view locations based on attribute types. Go to Filter and you will only be able to view the properties you personally select on the map.
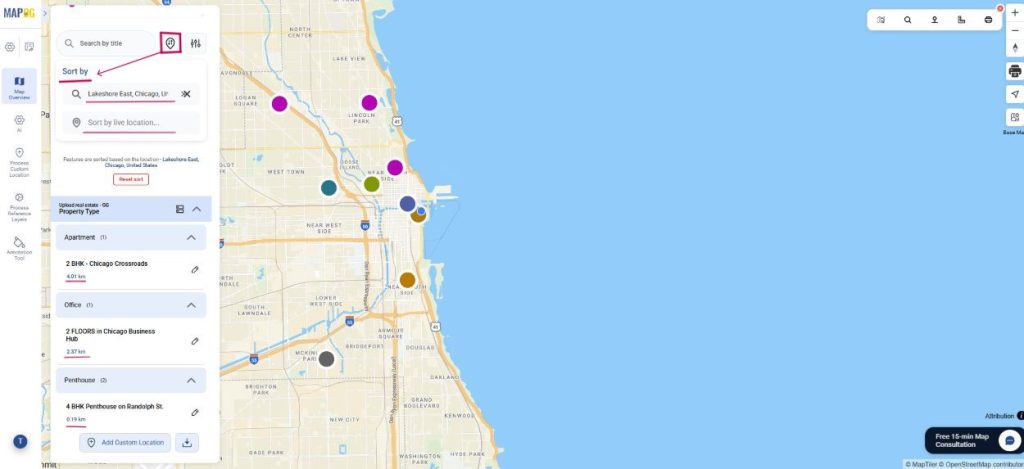
Finally, you can use ‘Sort by’ and view locations by live distance or by a certain location. Type any location and the locations will be arranged as per proximity to the searched location, you’ll be able to view the distance from the property.
Step 8: Preview & Share
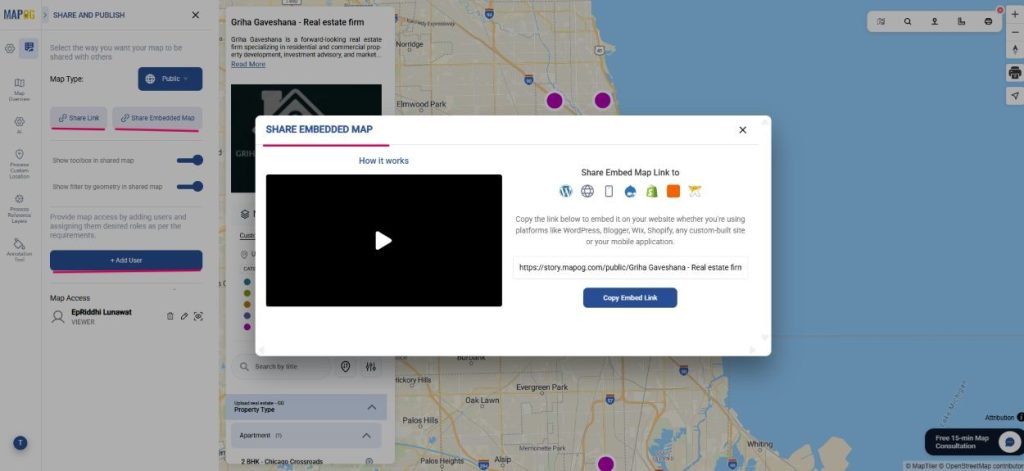
Finally, click on ‘Preview and share’. You can choose map type as private or public. If you select public, you can share map link or share embed map link to any website or platform. Additionally, you can share map access to users and assign roles for each user.
Industrial use and benefits
Location-based mapping makes real estate smarter and more transparent. Listings with images, pricing, and details on an interactive map help buyers explore, compare, and decide quickly, while sellers gain better visibility. This approach also benefits industries like hospitality and industrial logistics, where mapping assets improves planning, operations, and customer experience.
Conclusion
In conclusion, upload property listings on a map with images and full details transforms how properties are presented and explored, making searches more intuitive, decisions faster, and transactions more transparent thereby benefiting both buyers and sellers while demonstrating the power of location-based mapping across industries.