Tracking everyday projects on spreadsheets often turns messy, especially when tasks spread across different teams and locations. Instead of flipping through endless reports, a smarter way is to track task progress visually on a map dashboard. This approach gives you an instant view of what’s done and what’s pending while also keeping everything more organized. Moreover, MAPOG makes this process easier by combining map views with category filters and story filters, so managers gain a clear, real-time overview of projects.
Key Concept of Track Task Progress
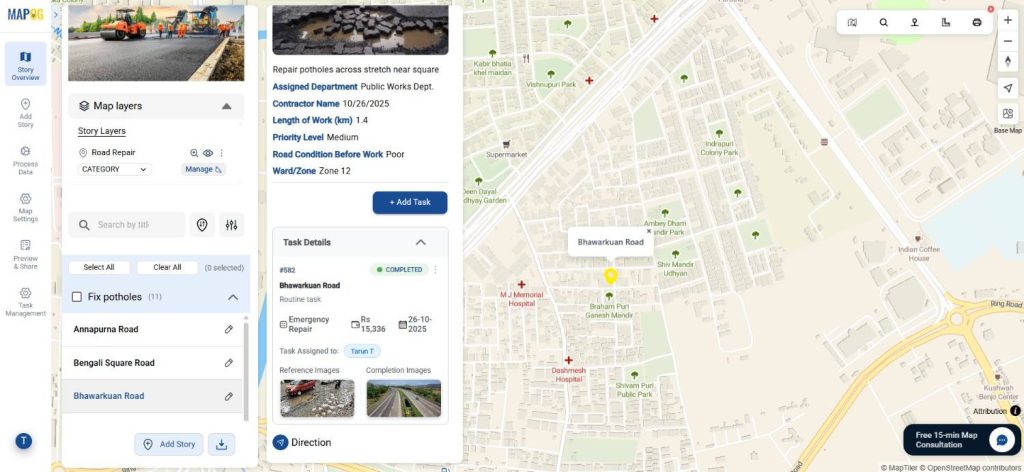
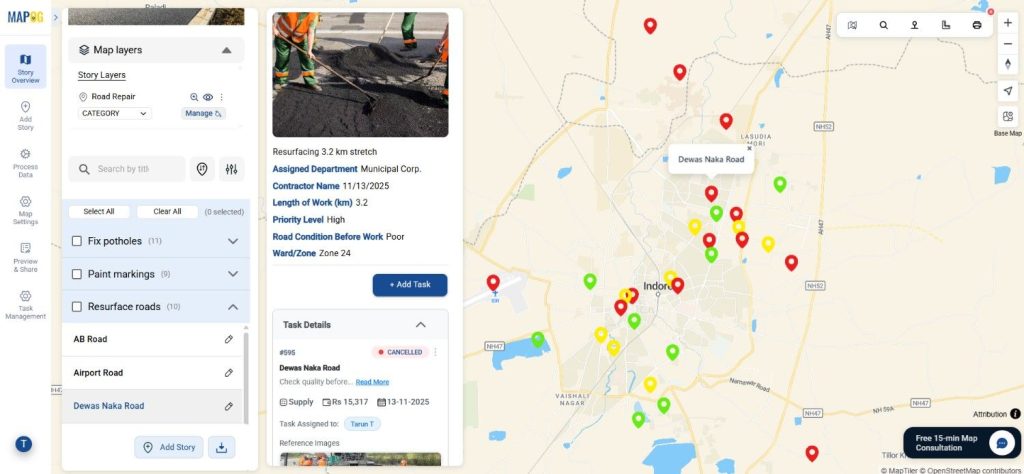
The main idea behind using a map dashboard is to connect tasks directly to specific locations. For example, if you are handling road repair and maintenance projects, you can attach tasks such as fixing potholes, resurfacing roads, and repainting markings directly to their points on the map. As a result, completed versus pending work doesn’t just appear in a list; instead, it links to its actual site. Furthermore, with MAPOG, you can filter these points based on task type, status, or even deal value, which streamlines project monitoring even further.
Road Repair & Maintenance Projects Example
In addition, MAPOG’s track task progress features allow cities to upload a list of road repairs, with each pin representing a task. Consequently, the filter separates projects by due date, task type, and status—whether completed or pending—thus enhancing accountability and time efficiency.
Process of Track Task Progress on a Map
First, visit MAPOG and create a road maintenance map. Now, let’s move into the actual process of task management. Everything begins with adding a task on the map.
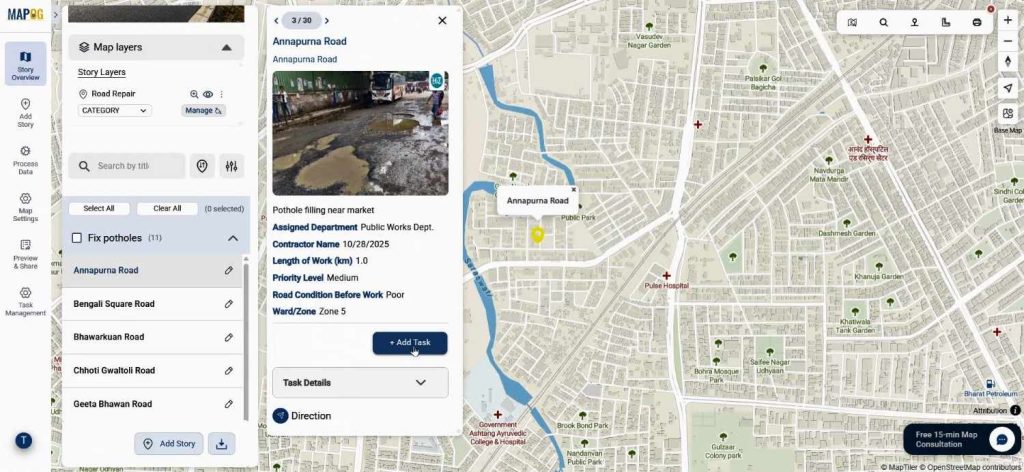
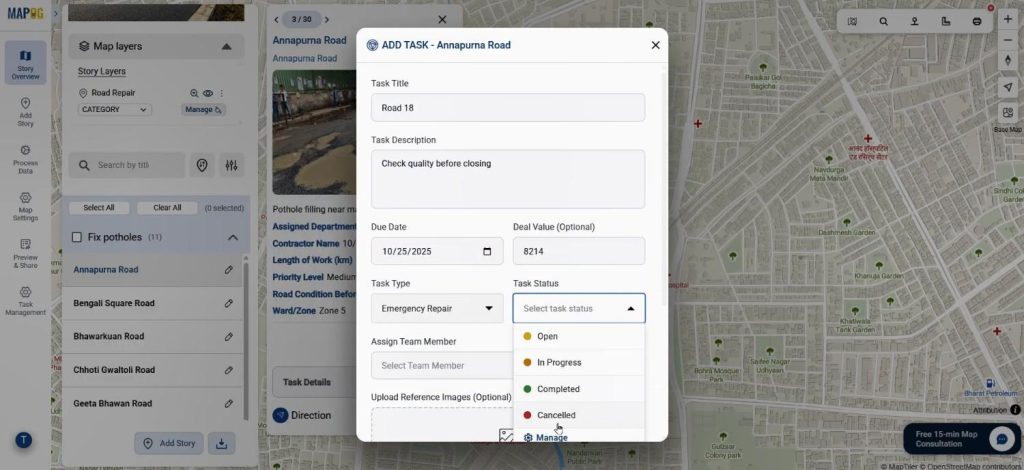
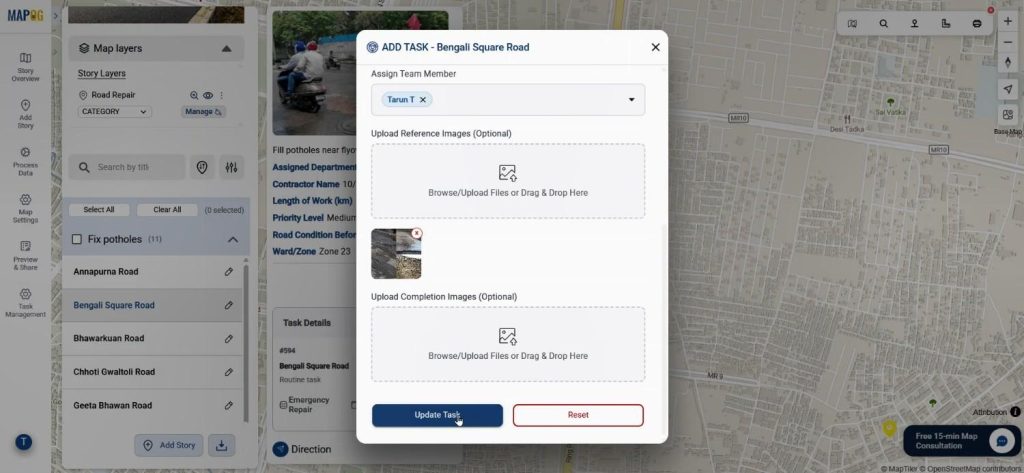
By clicking on a Add task, you can assign a title, description, task type, deal value, due date, and even photos. While this manual method works, it can be time-consuming for larger projects.
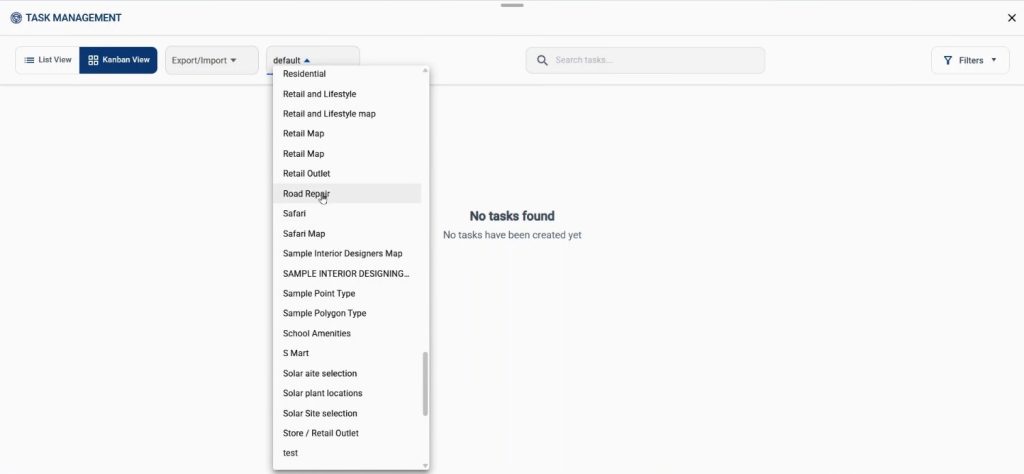
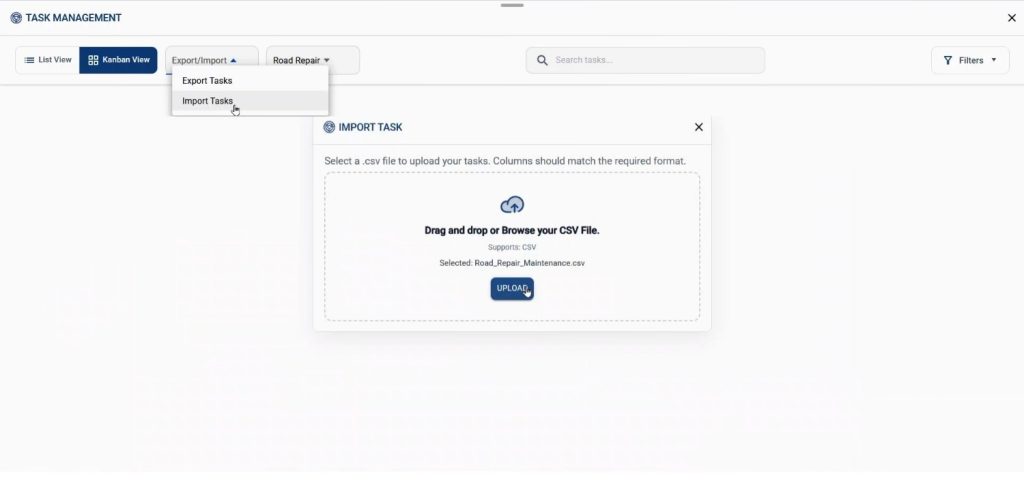
Instead, MAPOG allows you to upload multiple tasks at once. Using the task management toolbar, you can do it in instant. After coming to task management section select the feature type you created for his map.
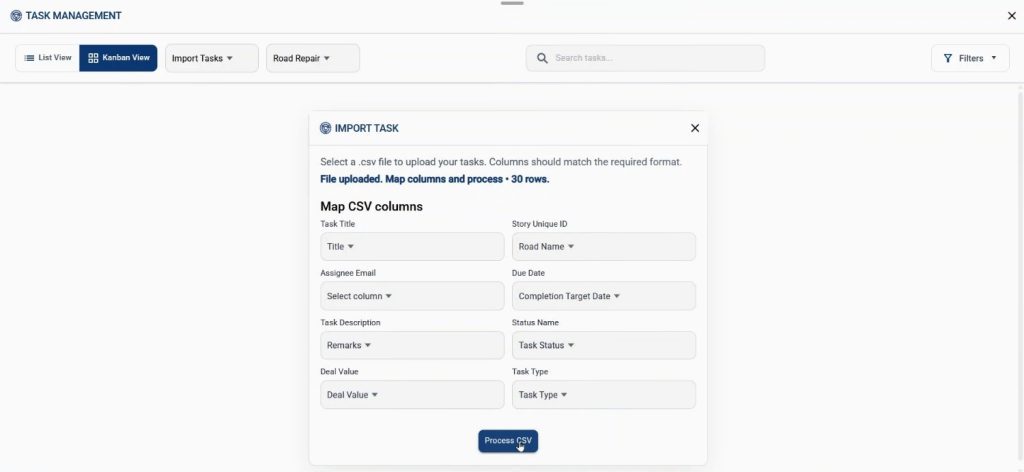
you can upload a CSV file containing details like task ID, description, status, assignee’s email, and deal value using “Impost Task”.
After uploading, you simply match attributes with map fields, and all the pins get populated instantly.
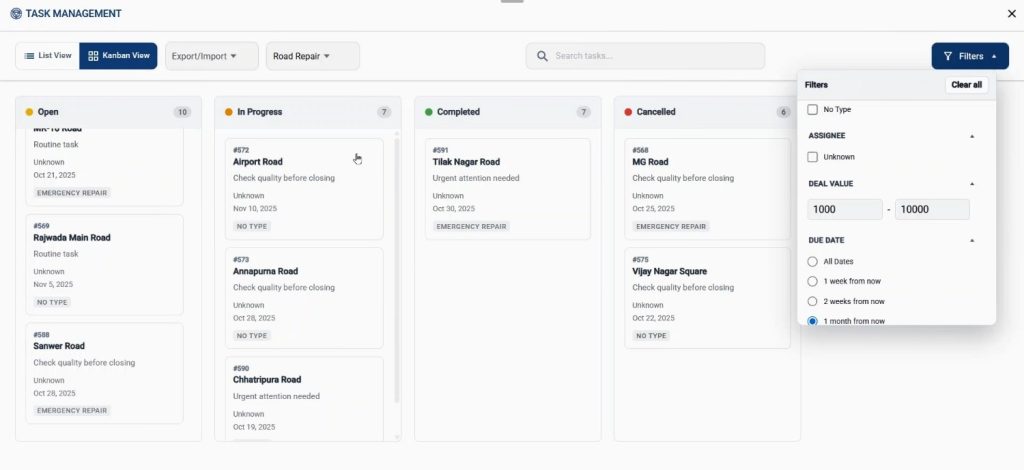
Once the tasks are uploaded, the real advantage of a map dashboard comes into play. By switching between list view or Kanban view, managers can see how work is progressing.
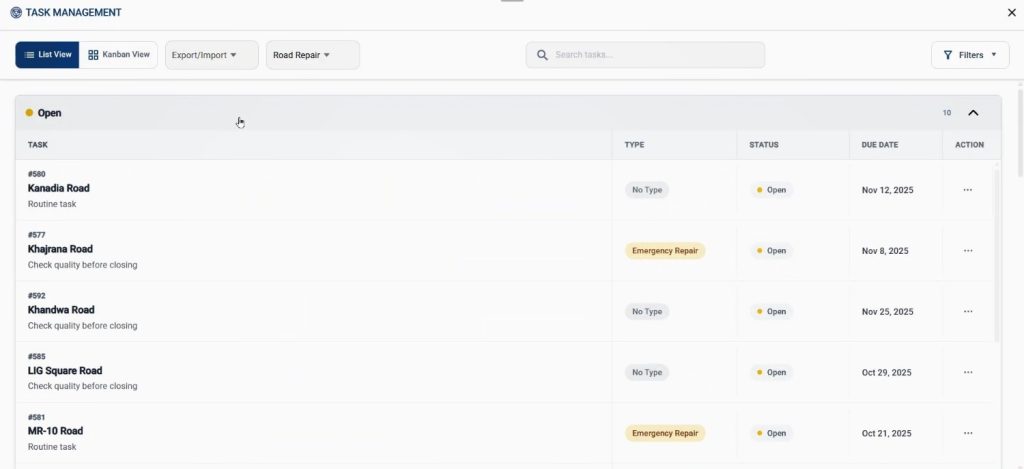
Next, you can filter the task as you like based on task status to see which projects are still open or in progress or got can cancelled.
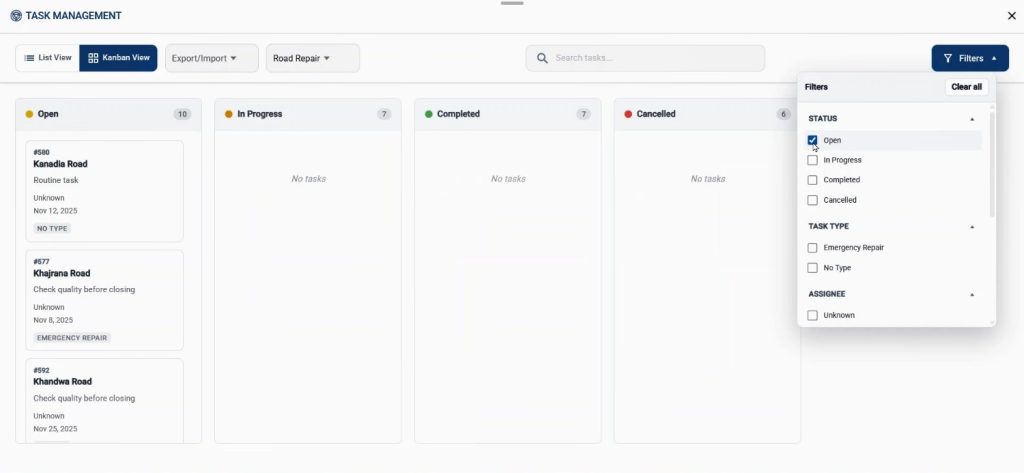
Otherwise, you can filter the projects based on the deal value, due date & task type etc.
In addition, each task pin can be edited later—photos can be attached, statuses updated, or members reassigned. This flexibility ensures that the map is always a live reflection of reality rather than outdated static data.
Industry Applications & Benefits
The value of tracking progress on a map dashboard extends beyond road repair projects. Industries like construction, facility management, utility services, and event planning all rely on accurate task tracking. Visualizing tasks geographically makes resource allocation smarter and communication faster.
For city governments, it can mean safer roads. For businesses, it can mean smoother operations. And with MAPOG offering advanced story filters and category filters, the customization is powerful yet simple.
Conclusion
In today’s fast-paced environment, managing projects through spreadsheets or emails alone can slow teams down. With MAPOG, you not only upload tasks in bulk but also filter them through categories and stories for faster insights. Whether it’s road repair projects or large-scale corporate tasks, this approach helps everyone stay aligned.
Do you want to see the step-by-step process to create such a beautiful live interactive map?
Check out some other blogs