Quantity style

Population Density Map by Districts

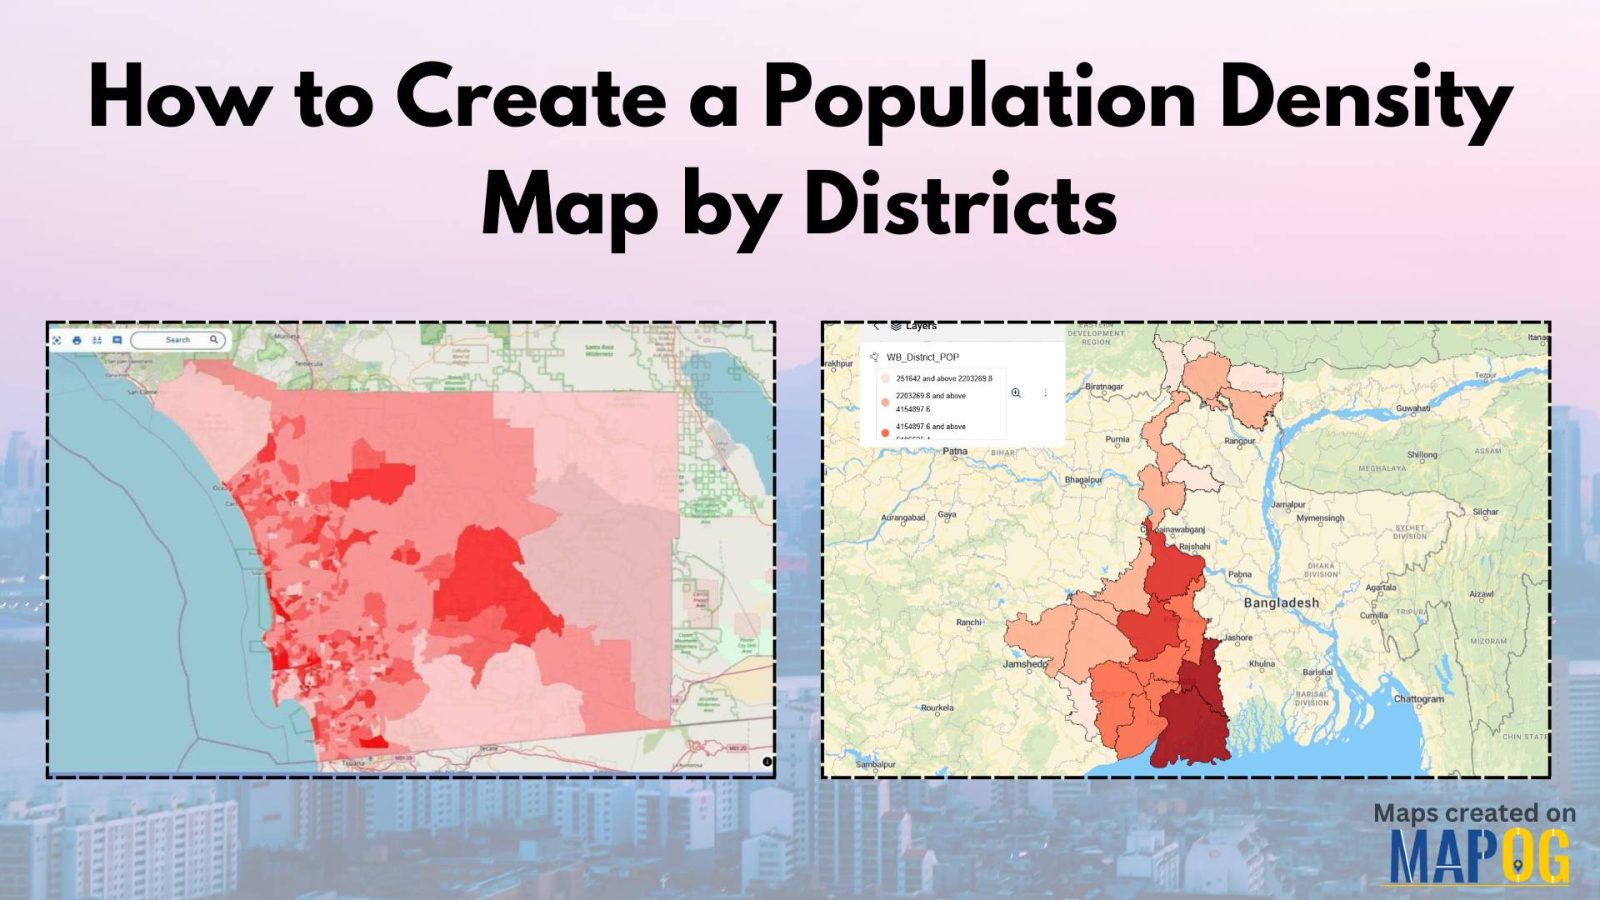
How To Create Population Density Map by Districts

Visualizing population density map by districts helps uncover patterns in urban growth, resource distribution, and planning needs. Whether you’re working on development plans, healthcare access, or disaster preparedness, mapping this data by district brings clarity that raw tables cannot. Thanks to MAPOG, users can create, style, and share interactive maps easily—no advanced GIS degree needed. … Read more

How to Style Maps by Categories or Quantities in MAPOG?

Interactive maps are powerful tools for visualizing data in a way that’s easy to understand and engaging. Style Maps by Categories or Quantities in MAPOG allows you to highlight trends, differences, and relationships effectively. Whether you’re mapping demographic data, business insights, or geographical patterns, the ability to customize styles is crucial for making your data … Read more