DistrictWiseInsights

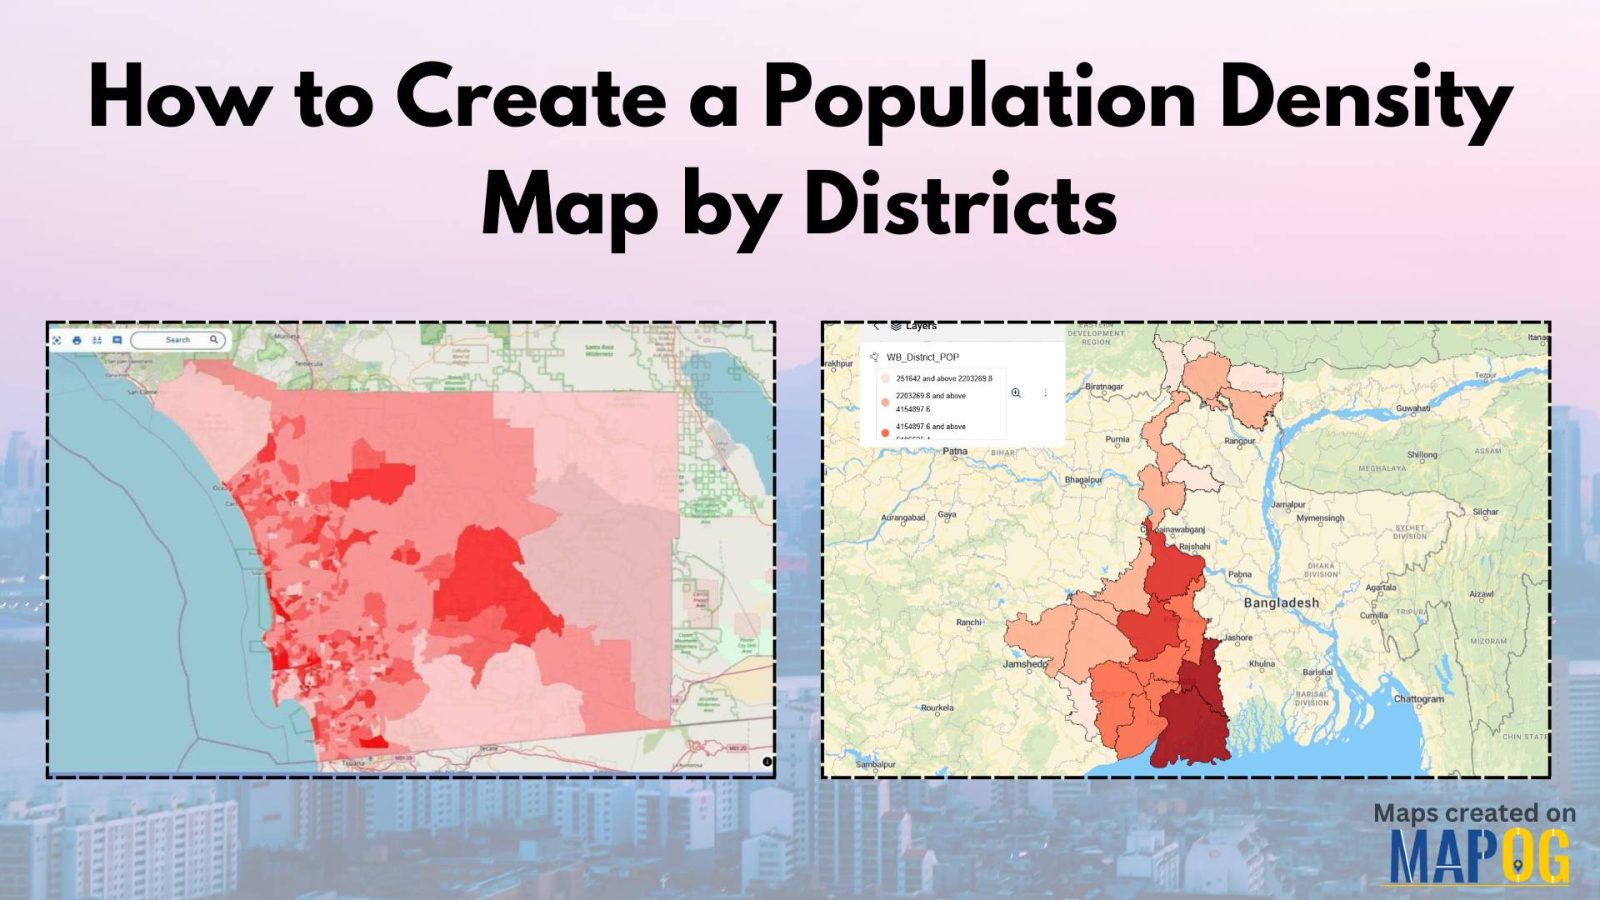
Population Density Map by Districts

How To Create Population Density Map by Districts

Visualizing population density map by districts helps uncover patterns in urban growth, resource distribution, and planning needs. Whether you’re working on development plans, healthcare access, or disaster preparedness, mapping this data by district brings clarity that raw tables cannot. Thanks to MAPOG, users can create, style, and share interactive maps easily—no advanced GIS degree needed. … Read more
District-Wise Disability Population Analysis Using Heat Maps Easy Insights & Mapping

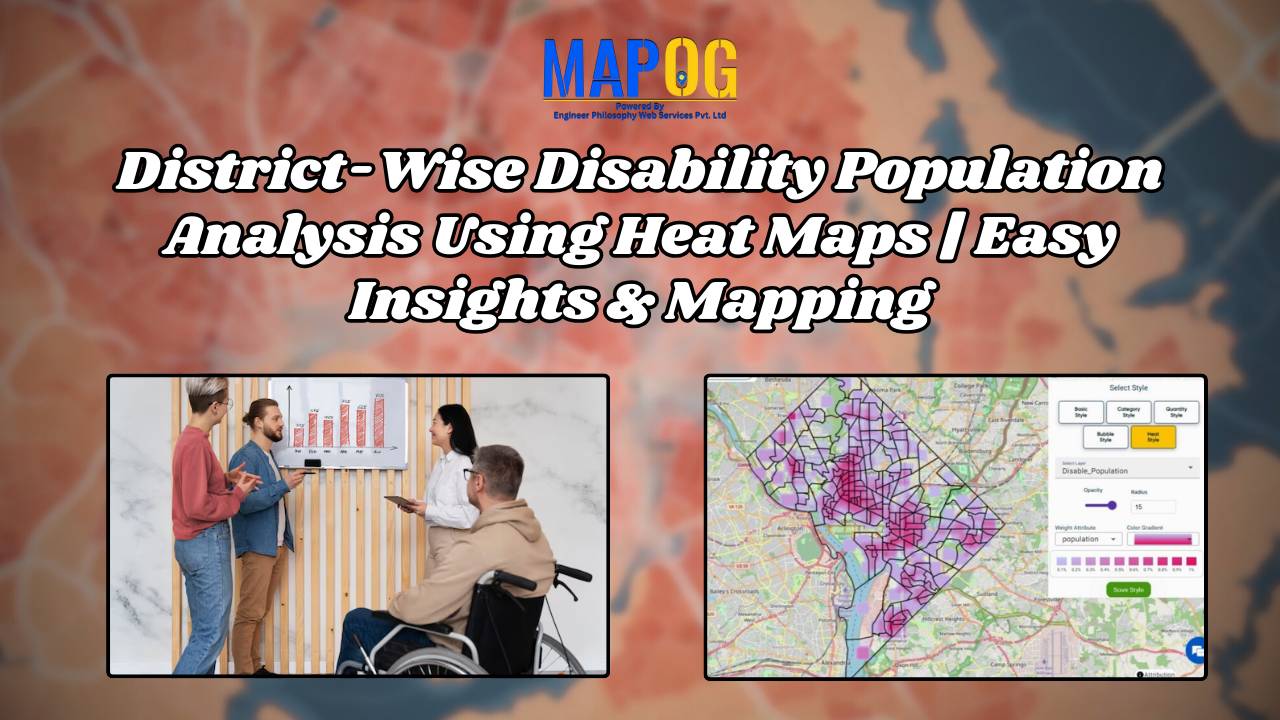
District-Wise Disability Population Analysis Using Heat Maps | Easy Insights & Mapping

Dive into the world of Disability Population Heat Map Analysis, where advanced mapping techniques provide district-wise insights with ease. By leveraging heat maps, we simplify complex data interpretation, offering a clear visual representation of disability distribution. This approach empowers policymakers, urban planners, and organizations to make informed decisions for improved accessibility and resource allocation. Explore … Read more