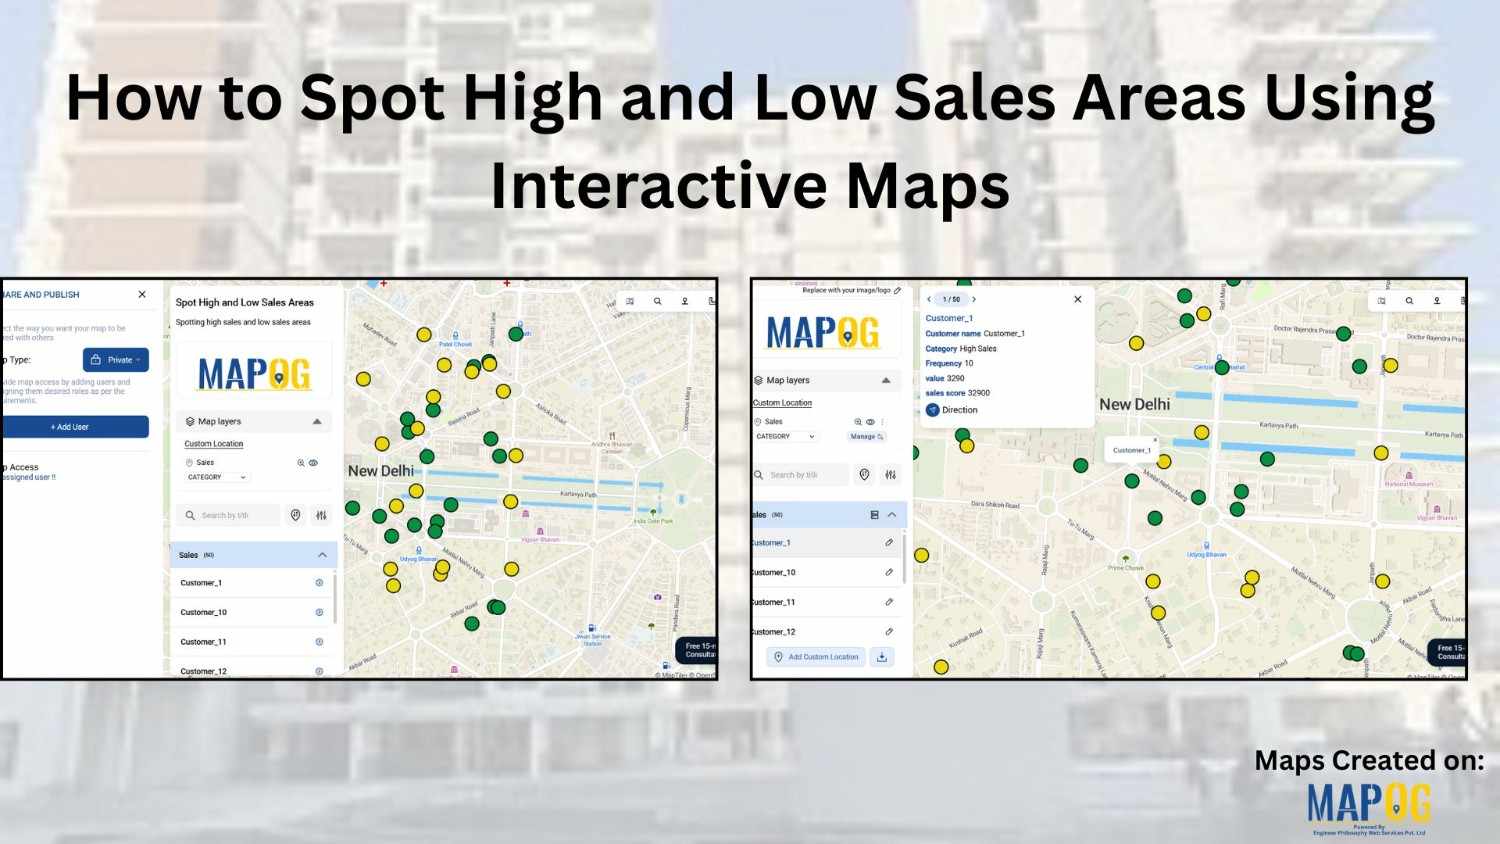
Category Style

Mapping Waste Disposal Sites with GIS for Clean Cities

In fast-growing cities, mapping waste disposal sites with GIS is becoming essential to public health and sustainability. As waste volumes rise, understanding where and how it’s managed is key to building cleaner, more efficient cities. This project uses MAPOG, a cloud-based spatial mapping platform, to visualize key waste disposal sites—ranging from major landfills to Refuse … Read more

How to Style Maps by Categories or Quantities in MAPOG?

Interactive maps are powerful tools for visualizing data in a way that’s easy to understand and engaging. Style Maps by Categories or Quantities in MAPOG allows you to highlight trends, differences, and relationships effectively. Whether you’re mapping demographic data, business insights, or geographical patterns, the ability to customize styles is crucial for making your data … Read more