Mapping Public Amenities to transform your city into a granted transparent, inclusive, and well-planned urban space with GIS-powered public amenity mapping. This modern approach enables governments, planners, and communities to visualize essential services such as schools, hospitals, parks, libraries, and more on a single interactive map. By identifying underserved areas as much as cities can make such data-driven decisions for future growth and equitable development.
Key Concept: Interactive Public Amenities Mapping
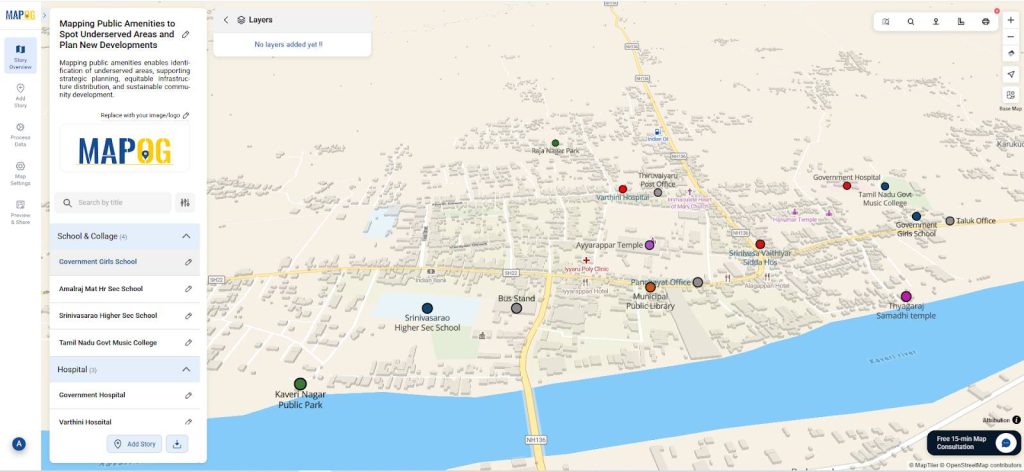
- If map existing public amenities (education, healthcare, parks, libraries, community centers).
- Then, add layers for capacity, services, and accessibility features.
- So highlight gaps to guide new infrastructure development.
Identifies
- Educational facilities: schools, colleges, training centers.
- Healthcare: hospitals, clinics, health centers.
- Parks, gardens, and recreation areas.
- Libraries, cultural halls, and community centers.
Why Use Public Amenities Mapping?
- Transparency: Shows citizens what services exist and where.
- Guided Planning: Identifies underserved zones for development.
- Equity: Promotes fair distribution of resources.
Uses of Public Amenities Mapping with GIS
- Provides interactive references for NGOs and local communities.
- Helps urban planners prioritize funding and projects.
- Assists governments in tracking and upgrading public facilities.
Methodology: Mapping Public Amenities Using MAPOG
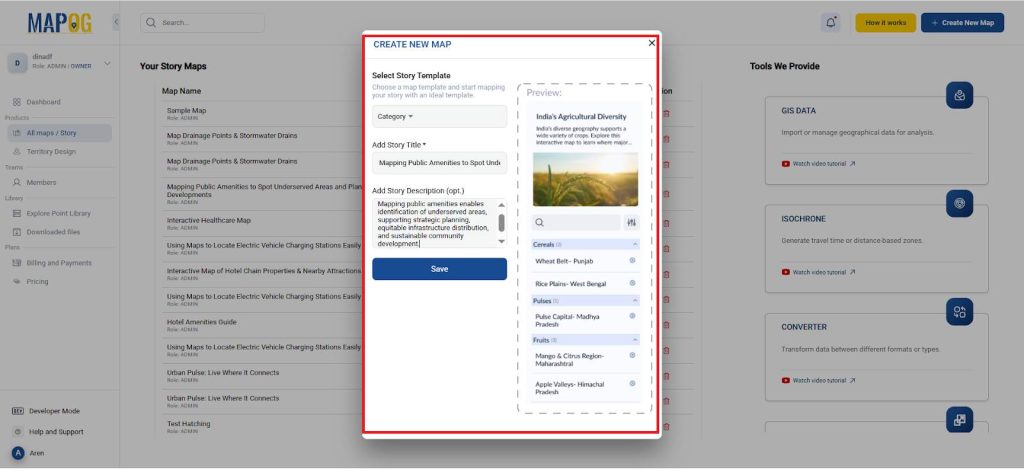
1. Start a New Project
- Firstly, open MAPOG and click “Create New Map.”
- Correspondingly, name your project and add a brief description & set the story template as “category”.
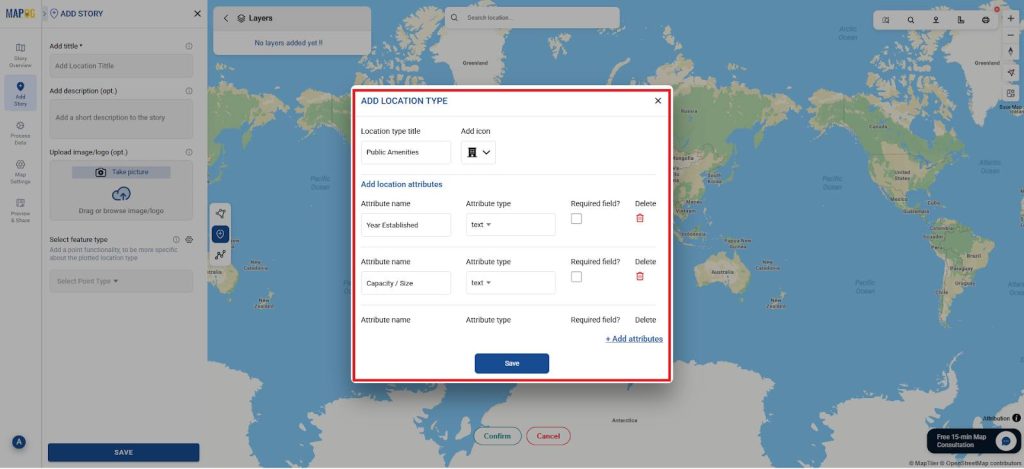
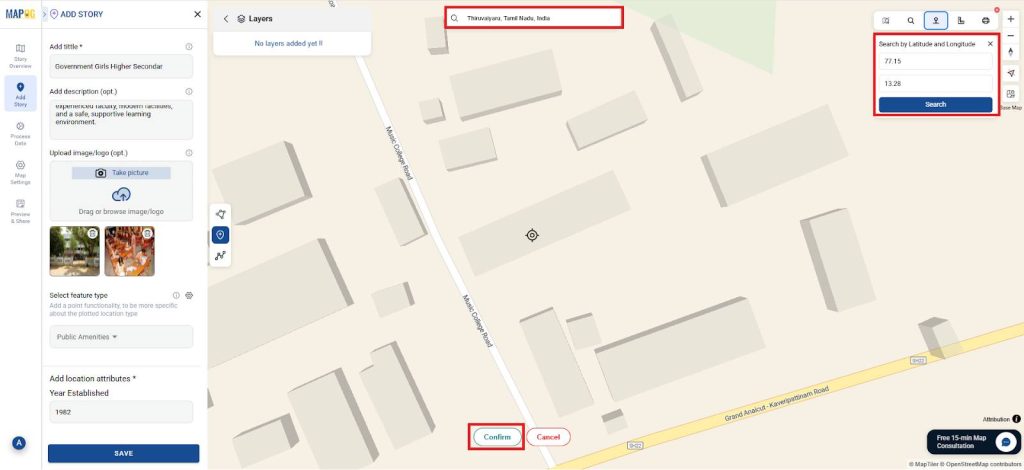
2. Add Public Amenities Locations
- Similarly, Go to Add Story → and select Add Manually.
- Choose select feature type settings option & add new location type such as public amenities and add the attributes as mentioned.
- Year Established – Text
- Capacity / Size – Text
- Operating Hours – Text
- Accessibility – Text
- Services Offered – Text
- Ownership / Authority – Text
- Contact Info – Text
- Special Features – Text
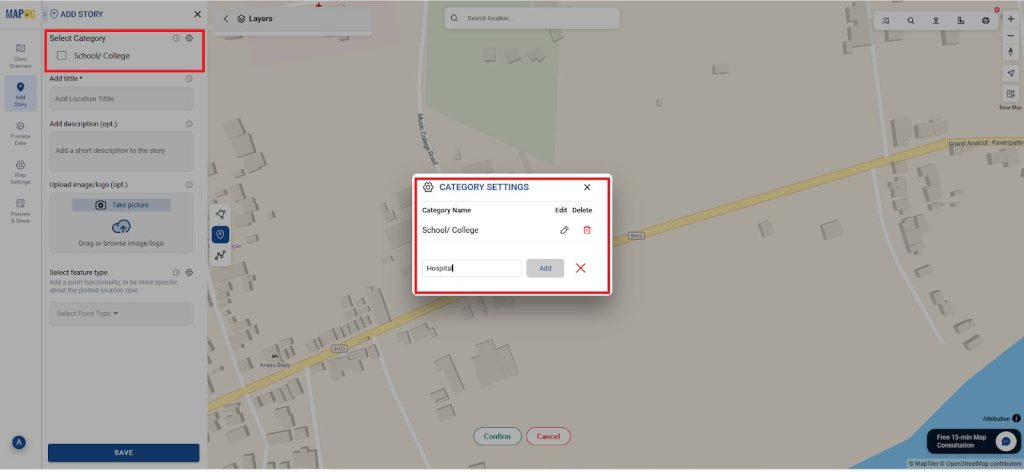
- Additionally, add the different categories using the setting in Select category and add all the list as mentioned as School/College, Hospital, Parks and recreations, Library and knowledge park, Community and Civic service and Utility & Safety.
- Add suitable category from the check list then give the title, short Description image and in select the feature type as the Public Amenities which we create and update all the data.
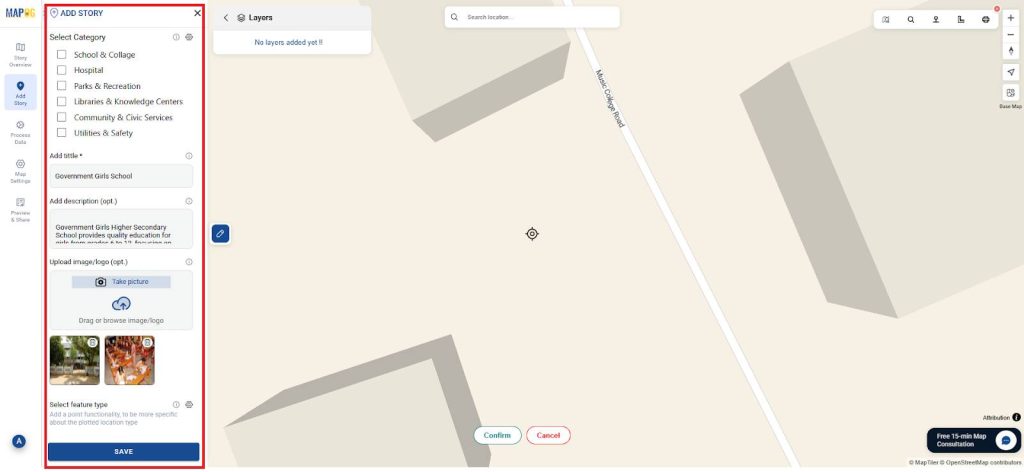
- Then, plot each amenity precisely using latitude and longitude by using the toolbox for all the locations.
- Moreover, repeat for all public facilities in your dataset.
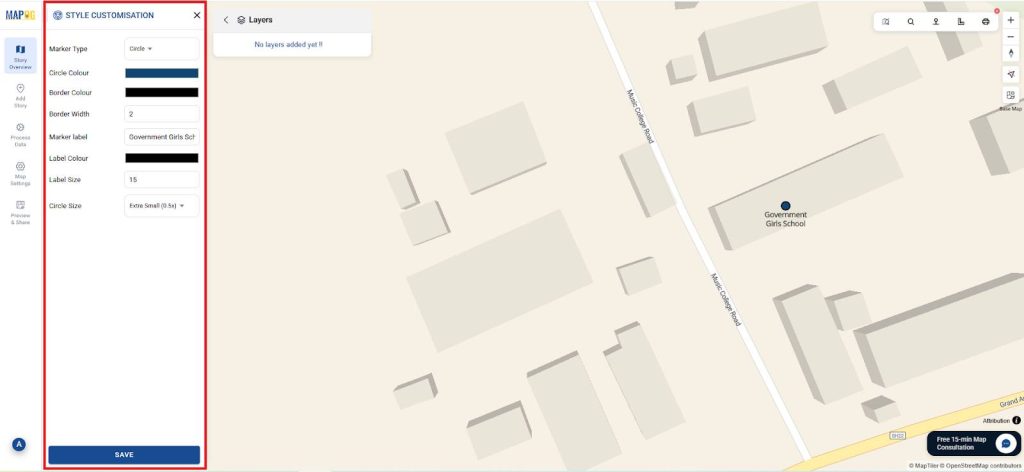
3. Style Icons and Labels
- Whereas, go to point customization and give the category-specific icons: Education (blue), Healthcare (red), Parks & Recreation (green), Libraries & Knowledge Centers (Pink), Community & Civic Services (Purple) and Utilities & Safety (Grey).
- Although, color-code clusters and underserved areas for quick analysis.
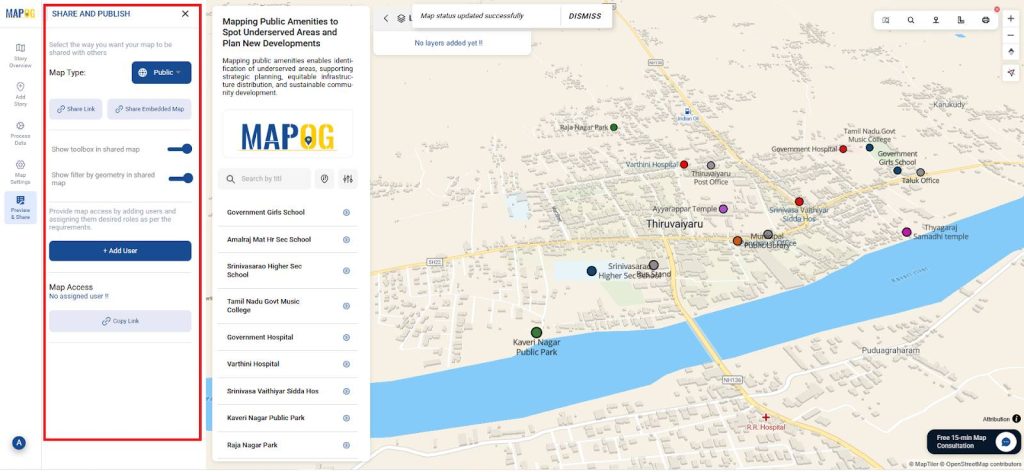
4. Publish and Share
- So use Publish & Share to create a live interactive map link.
- Embed it on municipal websites or share via emails during community meetings.
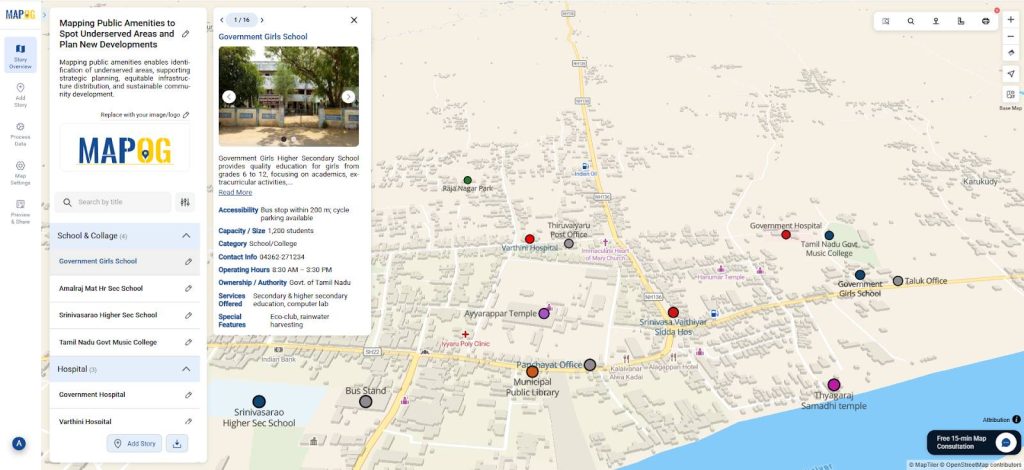
Insights and Applications
- So, identify underserved regions lacking basic facilities.
- Visualize clusters to avoid over-concentration.
- Empower citizens to engage in local planning.
Relevant For
- Urban Planners & Local Authorities
- NGOs & Community Groups
- Citizens, Students & Researchers
Benefits of Public Amenities Mapping
- Boosts Engagement: Residents can explore and suggest improvements.
- Supports Data-Driven Decisions: Guides investments effectively.
- Eco-Friendly: Reduces dependency on printed directories.
- Improves Quality of Life: Ensures fair and accessible services.
Conclusion
As a result of mapping public amenities with MAPOG creates a smarter, transparent, and citizen-focused planning approach. Then by visualizing schools, hospitals, parks, and community centers in one place, cities can bridge service gaps, plan future growth, and build more inclusive, equitable neighborhoods.
Similarly, from data collection to planning, this approach creates a smarter, greener, and well-connected mapping process for identifying public amenities. Furthermore strategies have been successfully applied to pinpoint underserved areas and guide new developments.
Additionally, MAPOG was utilized across multiple studies referenced in this context.
- Role of GIS In Irrigation Planning and Water Resource Management
- How GIS and Smart Mapping Reduce Urban Heat Islands
- GIS in Infrastructure Development and Road Network Analysis
- Flood Risk Mapping with Interactive Web Maps: SaaS Approach
- Optimizing Warehouse Location Selection with GIS for Supply Chain Efficiency