Mapping EV charging stations is a crucial step for planners aiming to develop smart, data-driven electric vehicle infrastructure. As electric mobility accelerates, GIS platforms like MAPOG enable users to visualize charging station locations clearly, identify gaps in coverage, and prioritize investments. Consequently, using modern web-based mapping tools, planners and analysts transform spreadsheets into actionable maps—showing where stations are well-placed, where new ones are needed, and how infrastructure aligns with urban demands.
If you’re interested in how spatial analysis supports infrastructure planning, you might also explore Urban Flow Layers and Design or Flood Risk Mapping with Interactive Web Maps: SaaS Approach
Key Concepts
Mapping EV charging stations with GIS allows urban planners to visualize existing infrastructure, uncover underserved regions, and plan network expansion. By doing so, they can assess coverage, accessibility for drivers, and integration with road networks or population density.
How GIS Supports Mapping EV Charging Stations for Smarter Planning
GIS plays a vital role in strategically planning and optimizing EV charging networks. To begin with, it aggregates multiple spatial layers into a unified map, supporting informed decisions about location, accessibility, and projected demand. Here’s how GIS supports this process:
- Station Density Mapping – GIS visualizes the current distribution of charging stations, highlighting regions with high density and those lacking coverage. Thus, it helps pinpoint where new infrastructure is most needed.
- Demand Forecasting – For instance, by analyzing vehicle registration data, traffic flow, and urban growth, GIS predicts where charger demand will increase. This enables proactive infrastructure placement.
- Optimal Resource Allocation – GIS evaluates land use, grid connectivity, population, and proximity to major routes. As a result, chargers are placed where they can offer maximum utility.
- Public Accessibility and Awareness – Furthermore, interactive GIS-based maps help drivers locate chargers, understand connector types, and plan routes efficiently.
- Urban Infrastructure Planning – GIS integrates EV data with transport networks and housing zones, ensuring chargers fit seamlessly into urban environments. Therefore, planning becomes smarter and more holistic.
- Traffic and Usage Analysis – Meanwhile, by tracking vehicle movement and peak usage, GIS guides fast charger placement and reduces downtime.
Step-by-Step Workflow for Mapping EV Charging Stations Using GIS
This section outlines a practical step-by-step process to create a bubble map visualizing electric vehicle (EV) charging station distribution using GIS. The workflow involves collecting EV location data, uploading it to a mapping platform, and visualizing charging density across regions
Step 1: Data Collection
First, gather relevant EV charging station data from official transport datasets, open EV infrastructure portals, or internal records. Ensure the dataset includes geographic coordinates (latitude and longitude) for each station.
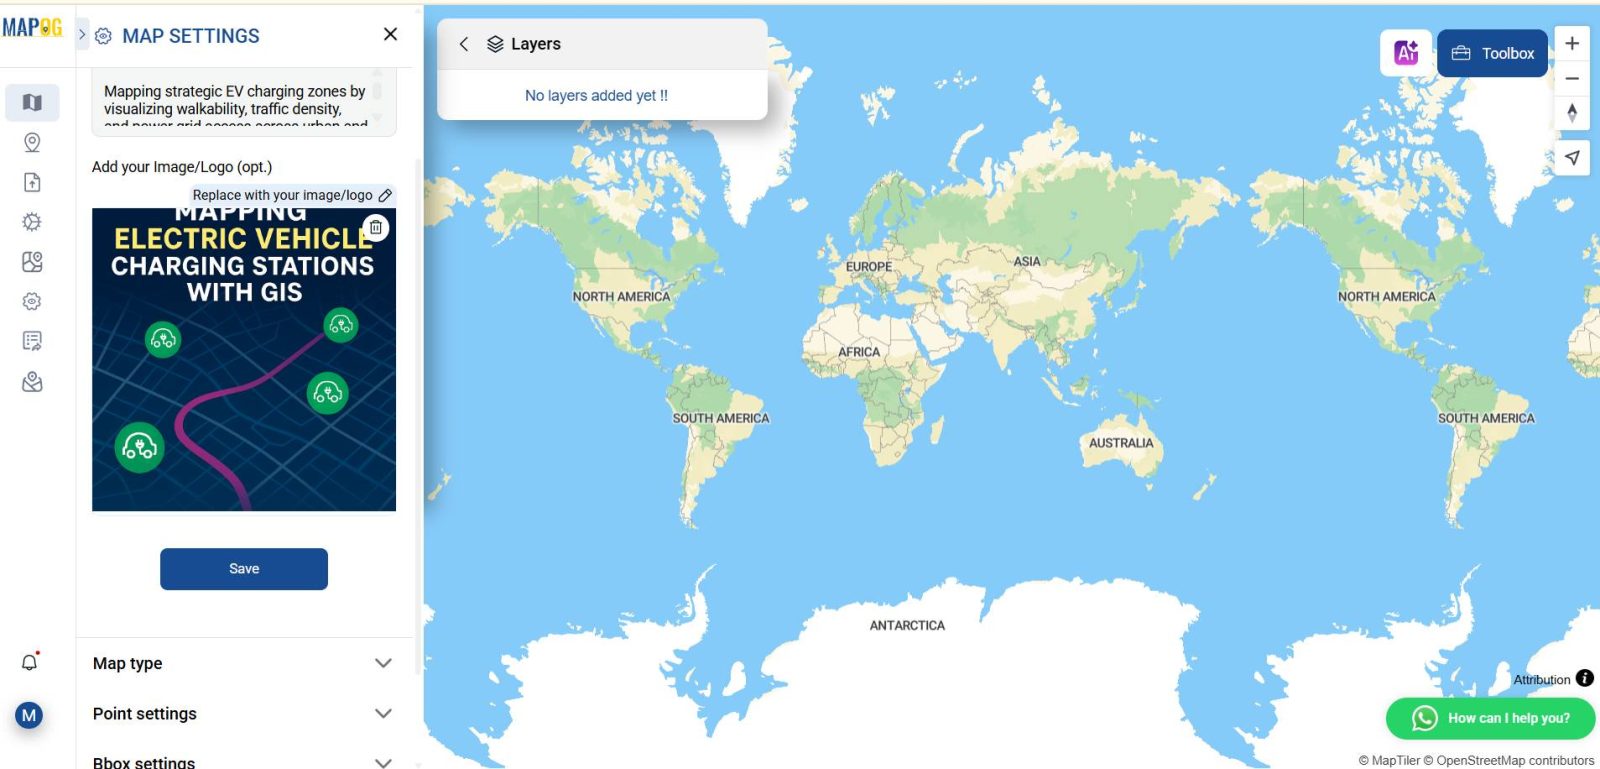
Once your data is ready, log into your GIS platform (e.g., MAPOG) and start a new project. In many cases, urban analysts prefer platforms that support Excel uploads and interactive styling.
Step 2: Add Boundary Layers to Support EV Charging Station Mapping
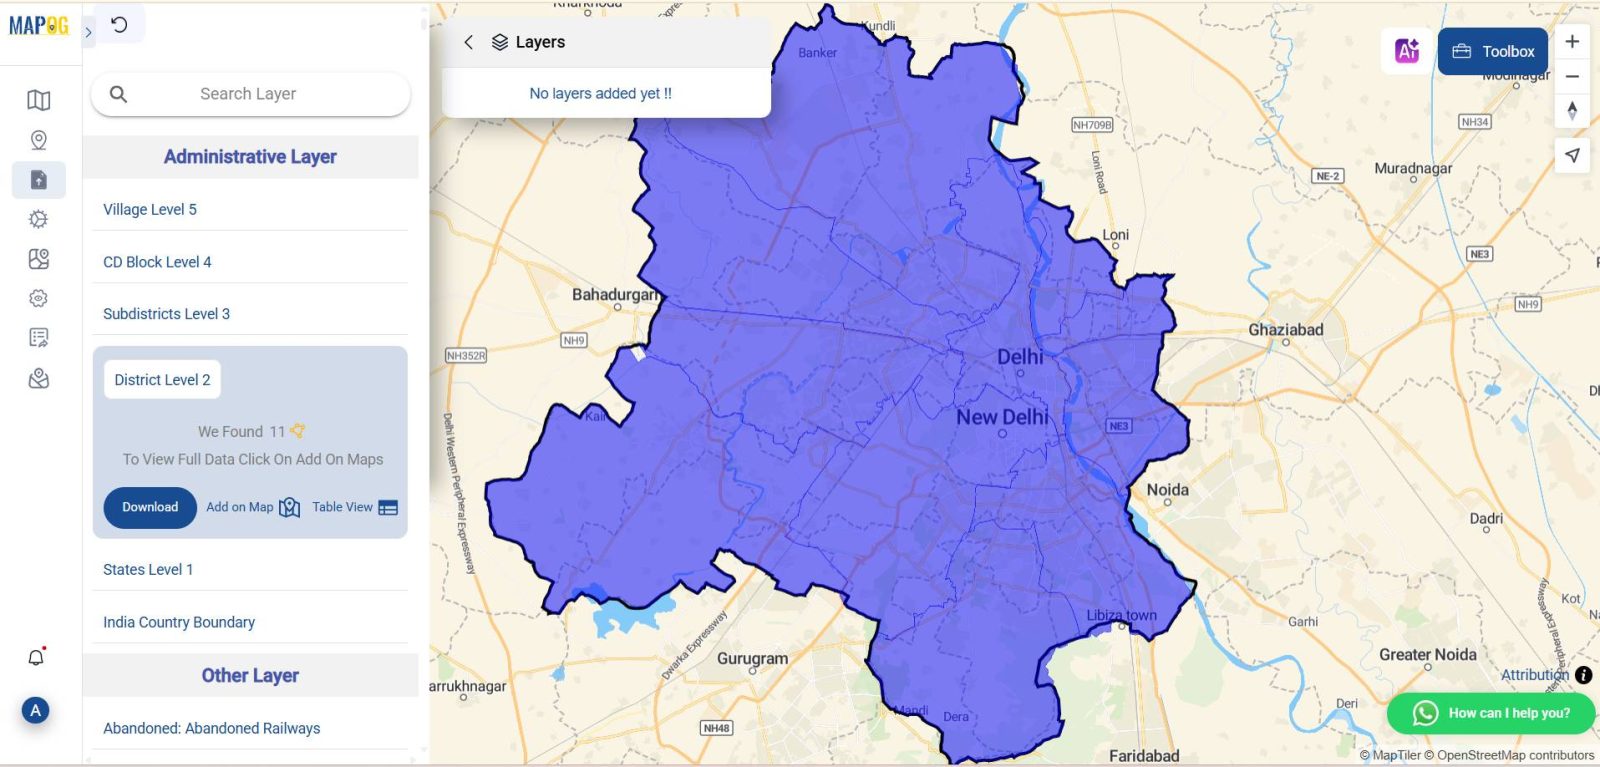
Next, import an administrative boundary layer for your focus region (city, district, or zone). To provide clarity, adjust style settings such as opacity and border color to ensure visibility of the base map while boundaries remain clearly defined. This helps improve analysis accuracy significantly
Upload EV Charging Station Dataset
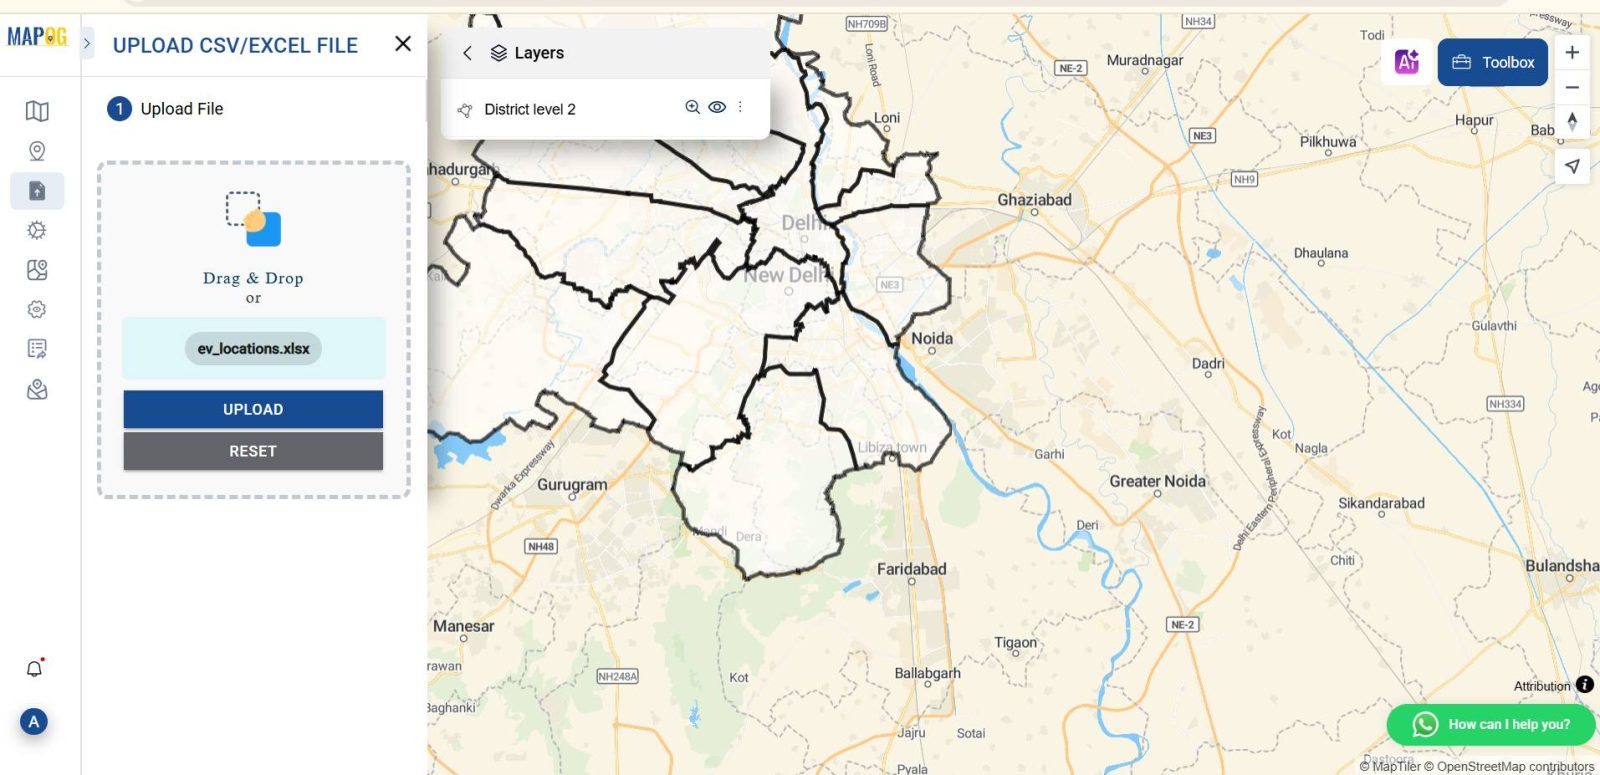
- Then use the “Upload CSV/Excel” feature under the “Add/Upload Data” option to import your dataset.
- Ensure your Excel file includes columns for latitude and longitude, as these are essential for accurately placing each EV charging station on the map.
- one labeled “Latitude” and the other “Longitude”, with numeric coordinates for each EV charging station.
- Once you select and upload the file, the MAPOG platform automatically detects these geographic fields. You’ll see an interface asking you to match your columns to the correct field types. Select “Latitude” from the dropdown for the latitude field, and “Longitude” for the longitude field.
- Once you’re in the Upload Data section, select your prepared Excel sheet that lists all station locations along with their geographic coordinates.
- This will allow the GIS tool to automatically map each charging point on the selected region.
Add Station Attributes for Better Visualization
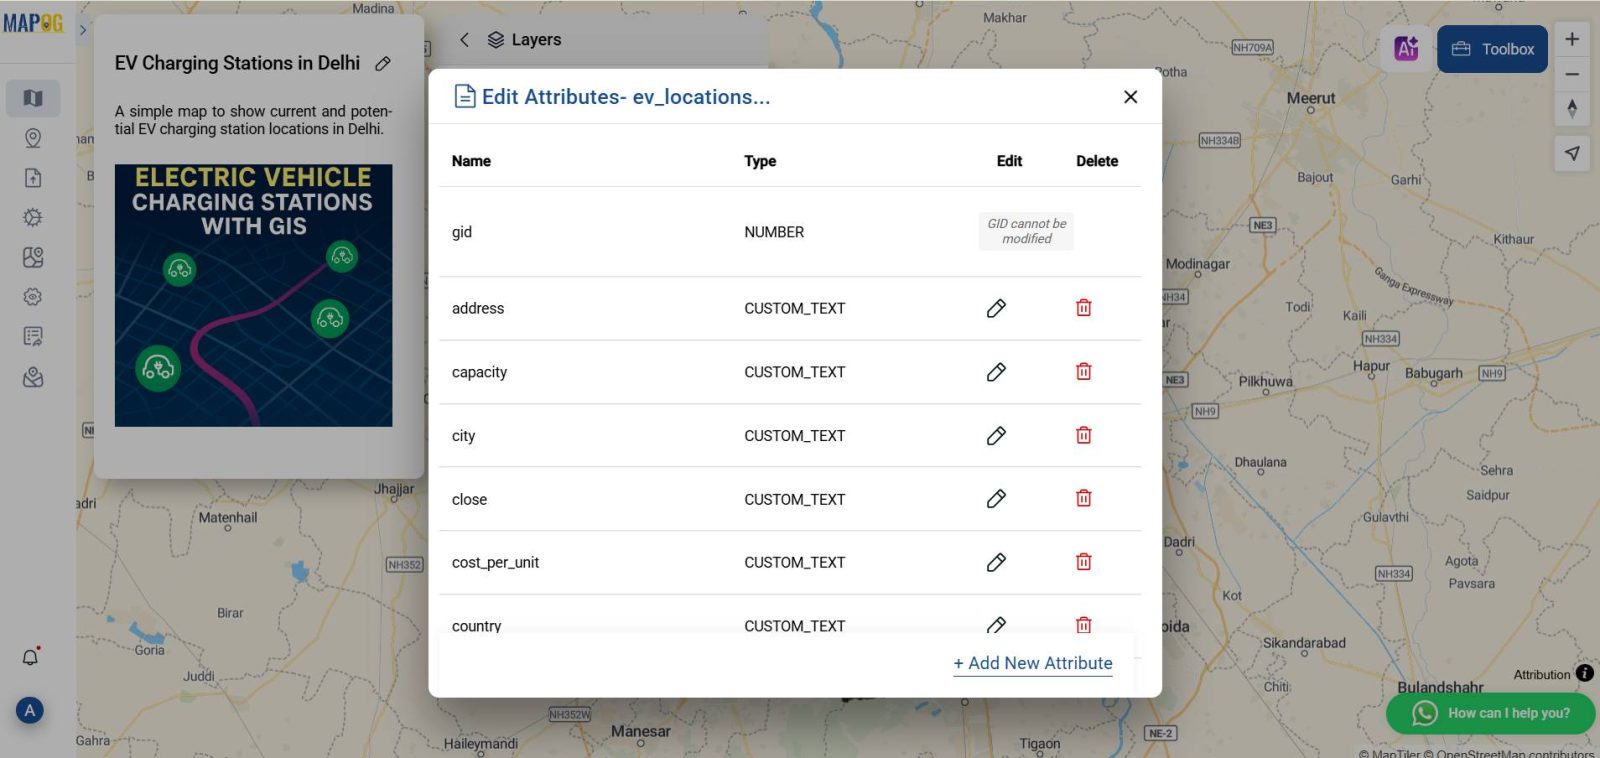
After uploading your data, you can access the attribute table associated with your EV station layer.
Here, you can add custom columns such as “Station Type,” “Connector Type,” or “Charging Speed” to enrich your dataset. Use the “Add Column” feature to define these fields, and populate them manually or by importing values directly.
This additional context allows for layered insights, helping distinguish between types of chargers (e.g., fast vs. standard) and improving the clarity of your final map.
Customize Map Style for EV Station Data
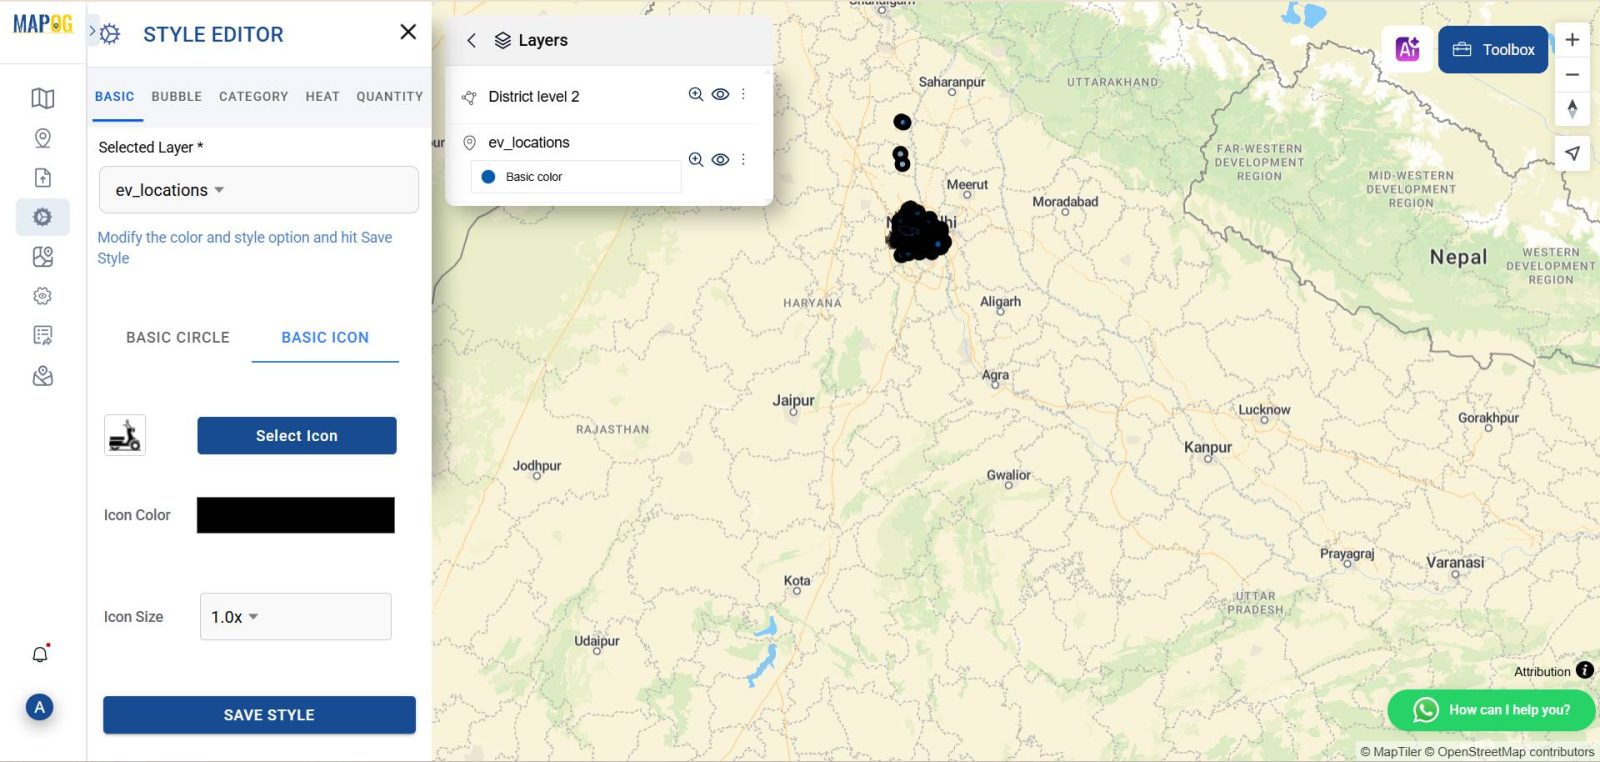
Navigate to the style editor to format your station points visually. Choose “Bubble Map” or “Point Map” depending on your preference. You can:
- Firstly, adjust bubble size based on charging capacity or usage.
- Secondly, apply color coding (e.g., blue for fast chargers, green for standard).
- Thirdly, modify icons for improved clarity and design consistency.
This customization step, overall, enhances the map’s readability and makes your insights more accessible
This step enhances readability and makes the map more insightful at a glance.
Enhance Map with Supporting Layers (Optional)
To add more context, include layers such as population density, road networks, or commercial zones. As an example, this may help align charger locations with demand or travel accessibility. Use polygon merging tools to integrate spatial data seamlessly
These can be merged using the “Merge polygon” ,which helps in fine-tuning charger placement in relation to real-world infrastructure.
Preview and Finalize Your EV Charger Map
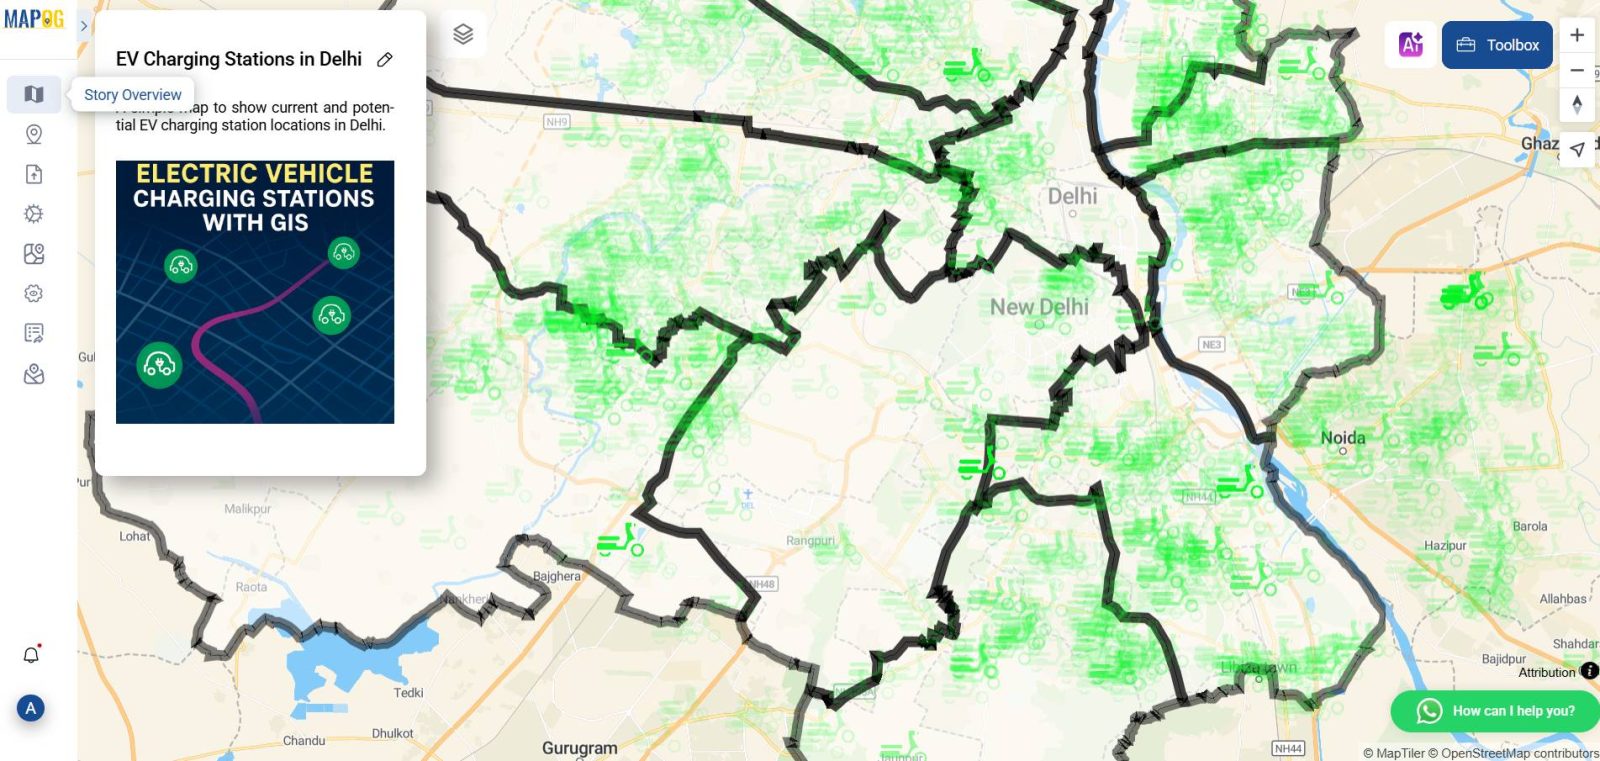
Before publishing, preview your map. Look for missing or overlapping points, unclear labels, or inconsistent icon sizes. Once adjusted, finalize and publish your interactive map. It can be shared via a public link or embedded on websites
Publish
Make any necessary edits, then click “Publish” to finalize the map. The output can be shared via a public link or embedded into a website for broader use.
Industry & Domain
Industry
Geographic Information Systems (GIS) have become increasingly vital in several sectors. In particular, the transportation industry relies heavily on GIS to manage and plan infrastructure networks. Moreover, as the shift to electric vehicles continues, GIS is playing a central role in renewable energy and urban development initiatives. For example, planners use spatial analysis to determine optimal EV charger locations and monitor how these align with city growth patterns.
As a result, GIS contributes directly to building more efficient, sustainable, and responsive urban environments.
Domain
This blog focuses on the domain of electric mobility and smart infrastructure planning. Specifically, mapping EV charging stations supports sustainable urban growth by ensuring that electric vehicle users have equitable access to charging facilities. Consequently, GIS mapping allows stakeholders to evaluate current station density, forecast demand, and select high-impact installation points.
In short, it’s a domain where data-driven planning and technological tools intersect to create smarter cities and better public services.
GIS Data Used
Data was uploaded using standard CSV or Excel formats compatible with most mapping platforms that support coordinate-driven plotting.
Conclusion: Mapping EV charging stations
To sum up, planning EV infrastructure is more than placing pins on a map. GIS enables transportation professionals to understand the distribution, accessibility, and usage patterns of charging stations with much greater clarity. By using tools like MAPOG—featuring layer styling, data merging, and publishing—professionals can turn basic spreadsheets into powerful strategic visuals.
Therefore, mapping EV charging stations using GIS is essential for planning an efficient, data-driven electric vehicle network.
To explore more, read our blogs on How GIS and Smart Mapping Reduce Urban Heat Islands and Optimizing Warehouse Location Selection.
Exploring Our Previous Blogs
You might also enjoy reading Creating a Responsive EV Charging Map and GIS in Infrastructure Development and Road Network Analysis, where we dive deeper into how spatial data supports sustainable urban systems
- Role of GIS In Irrigation Planning and Water Resource Management
- How GIS and Smart Mapping Reduce Urban Heat Islands
- GIS in Infrastructure Development and Road Network Analysis
- Flood Risk Mapping with Interactive Web Maps: SaaS Approach
- Optimizing Warehouse Location Selection with GIS for Supply Chain Efficiency