Mapping Cyclone Shelter Locations in coastal villages need quick access to shelters during emergencies. Visualizing shelter locations and their accessibility helps uncover gaps in disaster readiness. With MAPOG, users can build interactive GIS maps showing shelter distribution, village settlements, roads, and key geographic features. Instead of complex tools, this method uses simple layers and spatial logic to plot shelters and create 5 km service buffers.
Key Concept: Mapping Cyclone Shelter Locations
While cyclone shelters exist in the coastal landscape, their effectiveness relies on visibility, accessibility, and balanced distribution. By overlaying shelter points with roads, boundaries, and residential clusters, planners can pinpoint underserved villages. This simple mapping approach also answers vital questions:
- Which villages have nearby shelters?
- Are shelters road-accessible?
- How many residents fall within reach?
Ultimately, such maps highlight both risks and opportunities for improving cyclone resilience.
Uses of Mapping Cyclone Shelter Locations
- This project enhances GIS learning for students in geography, disaster management, and environmental studies.
- It builds layer awareness, encourages real-world application, and strengthens visual thinking.
- Most importantly, it connects classroom learning to community-focused planning and problem-solving.
Methodology: Mapping Cyclone Shelter Locations
Project Focus: Visualizing cyclone shelter coverage for coastal villages using key GIS layers and point plotting.
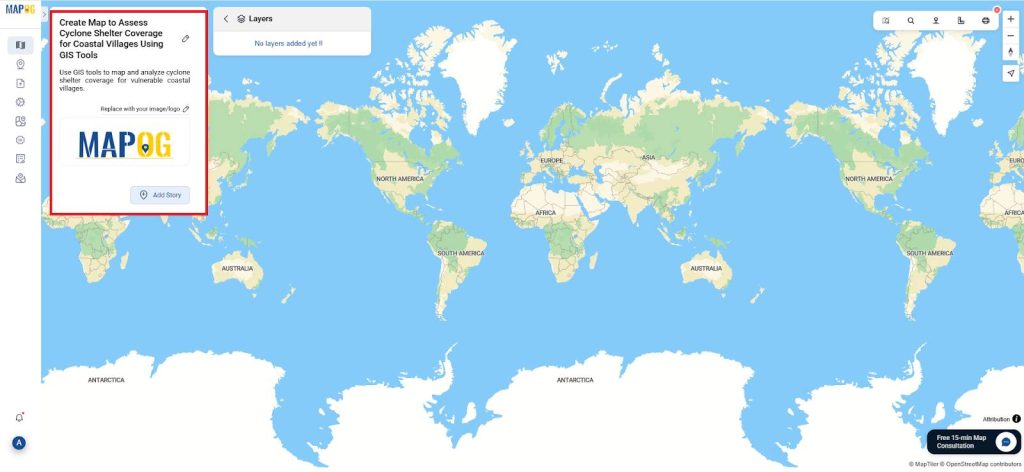
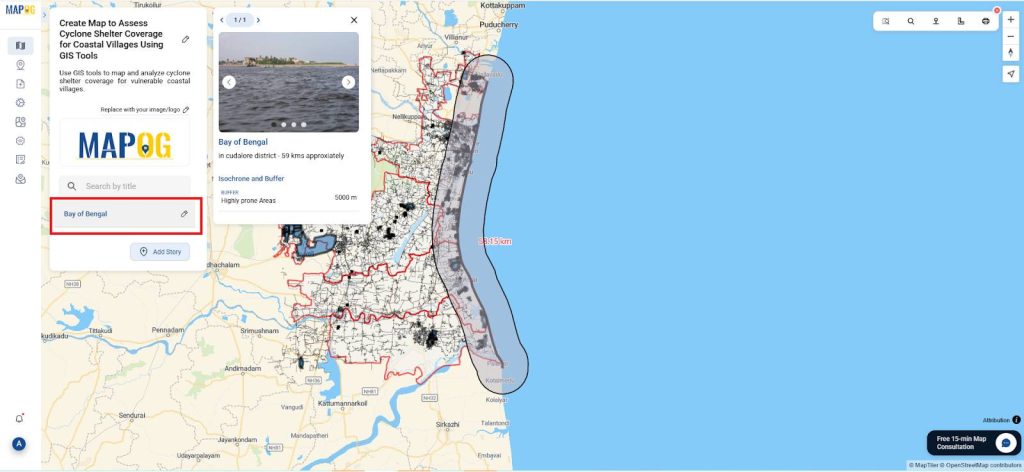
1. Start a New Story and Add a Project Title
- First, go to the MAPOG website, click “Create New Map,”.
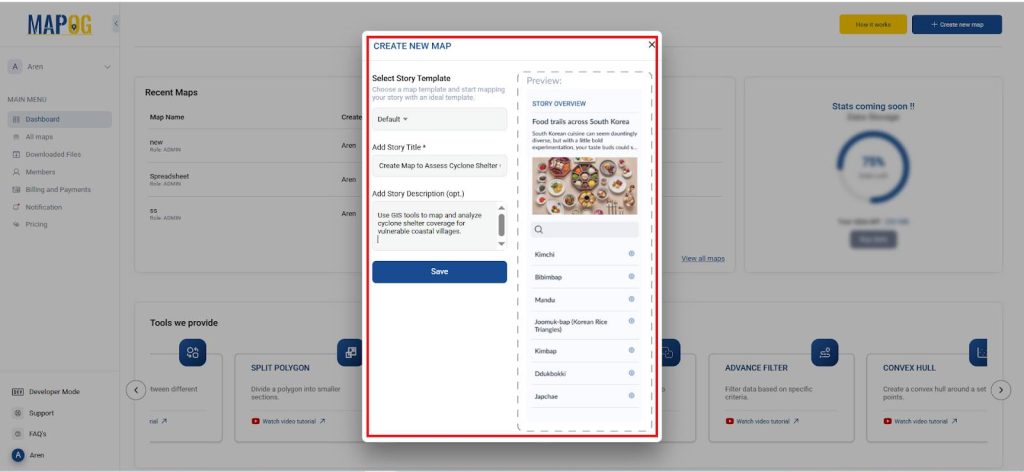
- Then, give the project name and description.
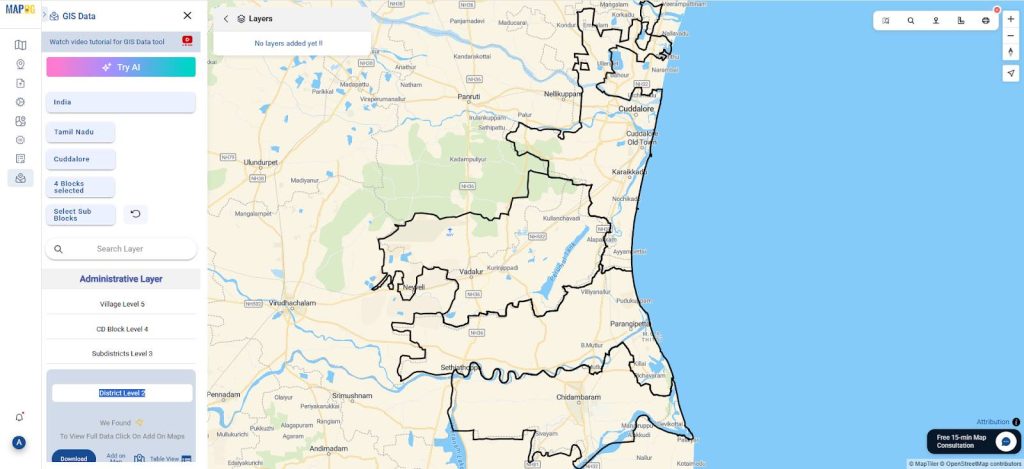
2. Load the Following GIS Layers
Then, open the GIS Data Library, choose your country → state → district→ blocks, and add the following layers:
- Administrative: Subdistricts level 3 → It helps locate and focus on coastal settlements.
- Transportation: roads → This provides all road routes connecting villages.
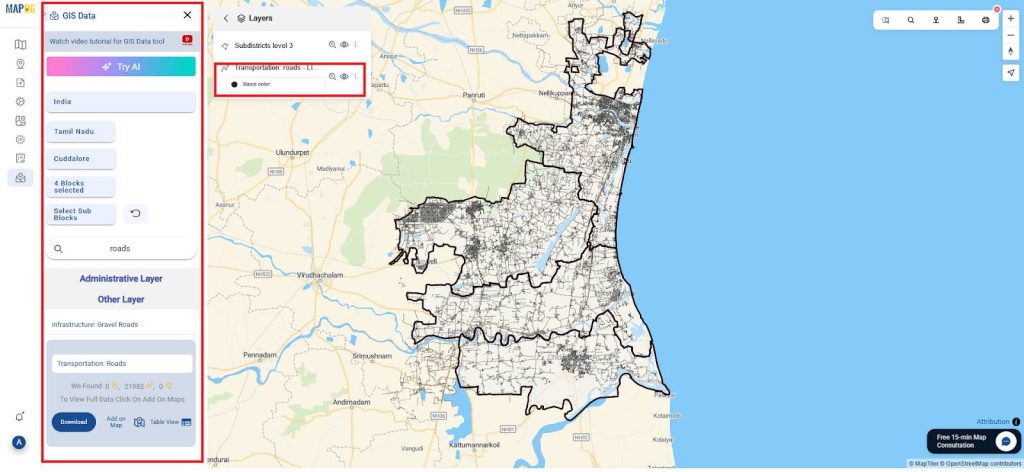
- Land Use: landuse → This highlights populated residential clusters.
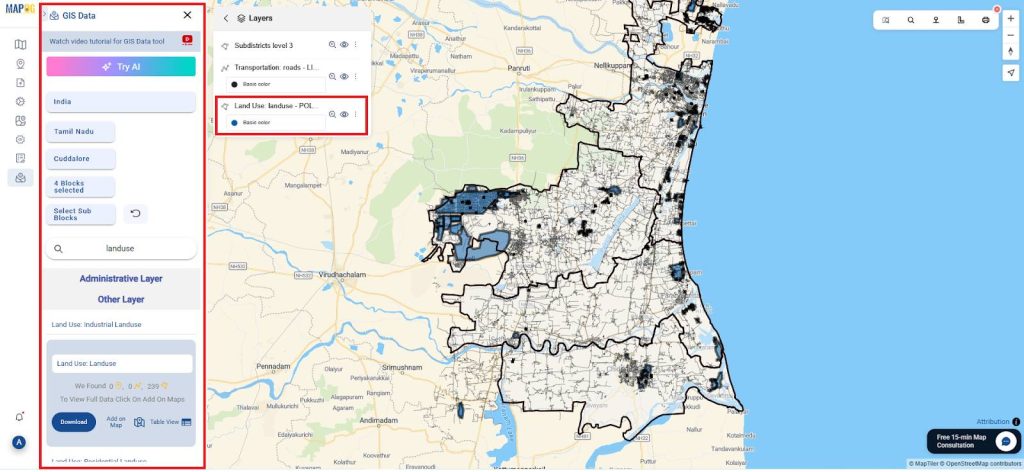
- Finally, these layers offer spatial context for shelter placement and community exposure.
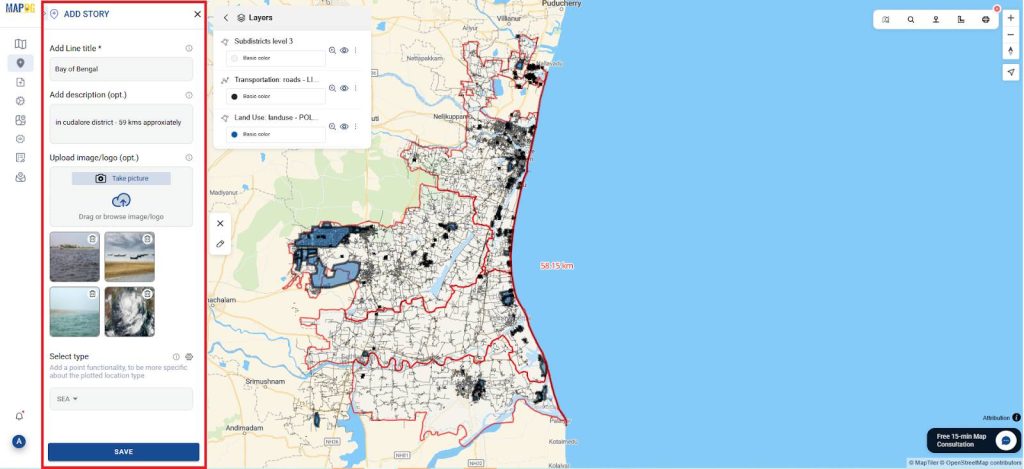
3. Digitize Coastal Line & Generate 5km Buffer Zone
- First, go to “Add Story” change to line data, draw manually the coastal line and give a title, Description and images and line type.
- Next, right click and select Add Isochrone/buffer, select the buffer tool to generate a 5 km zone around the coastal line.
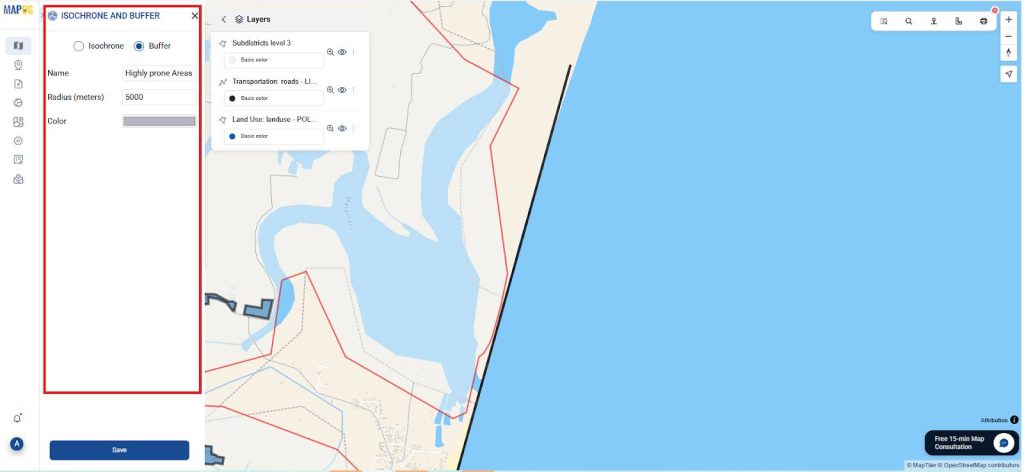
- Then, analyze the buffer zone to identify covered villages and accessibility.
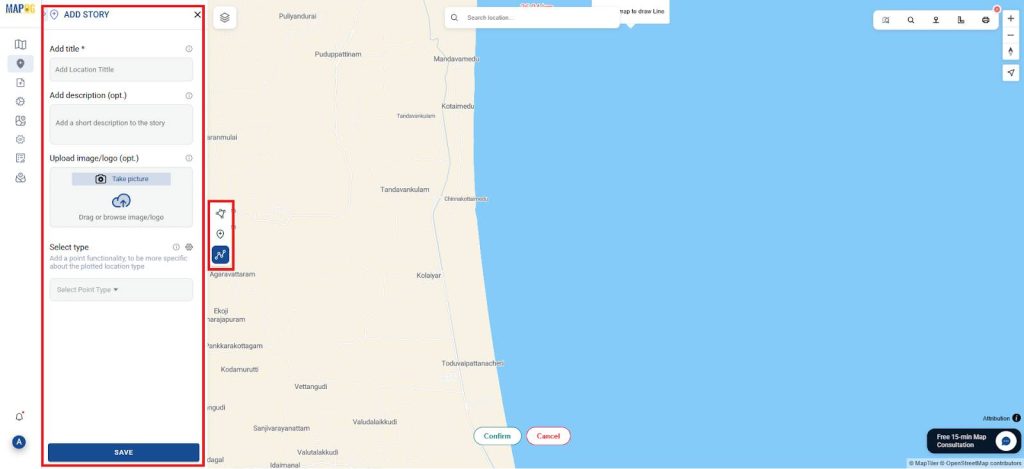
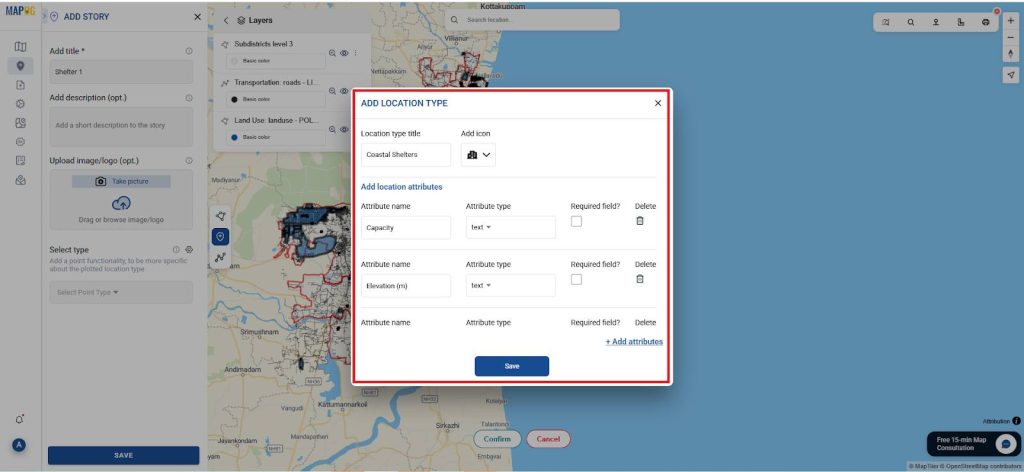
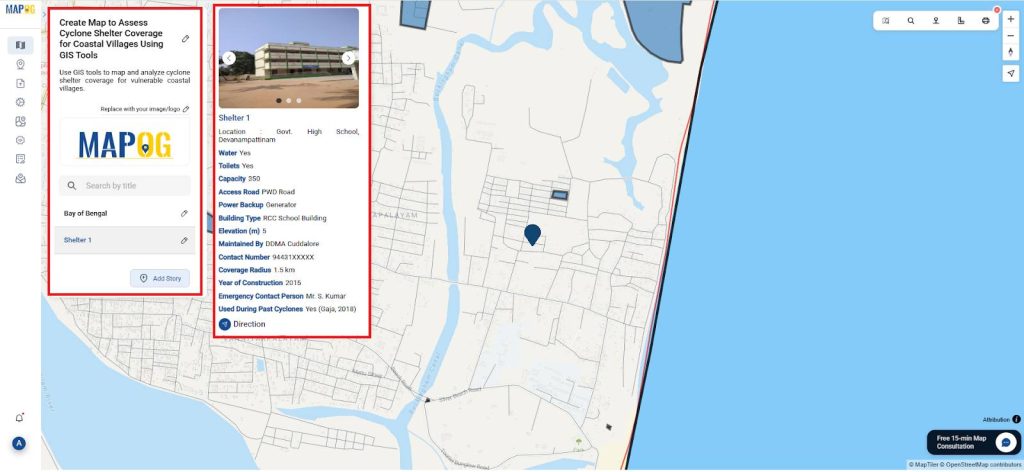
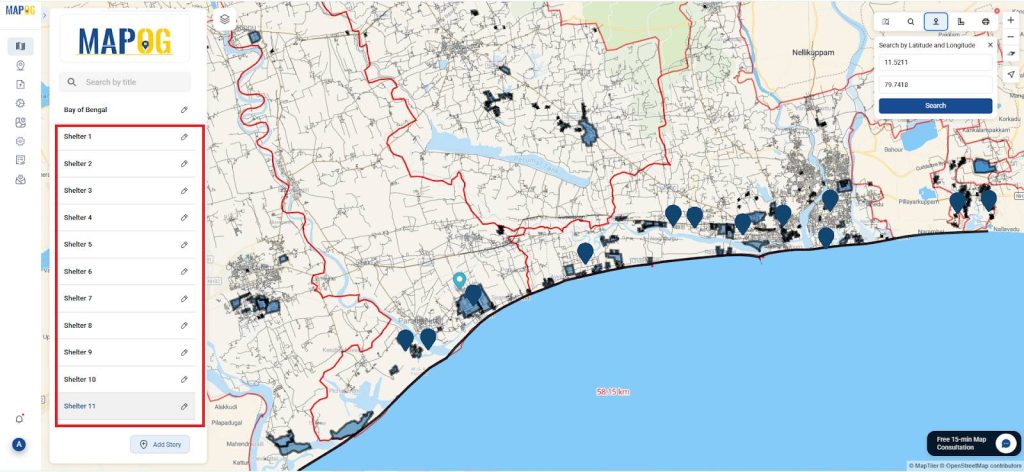
4. Add Cyclone Shelter Points Manually
- Now, use the “Add story“ feature to create 10–12 cyclone shelter points across the coastal region named the type as “Coastal Shelters” and name it.
- And for each shelter point, enter attributes such as :Location, Capacity, Elevation (m), Access Road, Toilets, Water, Power Backup,Maintained By, Coverage Radius, Building Type, Year of Construction, Used During Past Cyclones, Emergency Contact Person and Contact Number.
- Then, give the latitude and longitude on the toolbox and save all the details
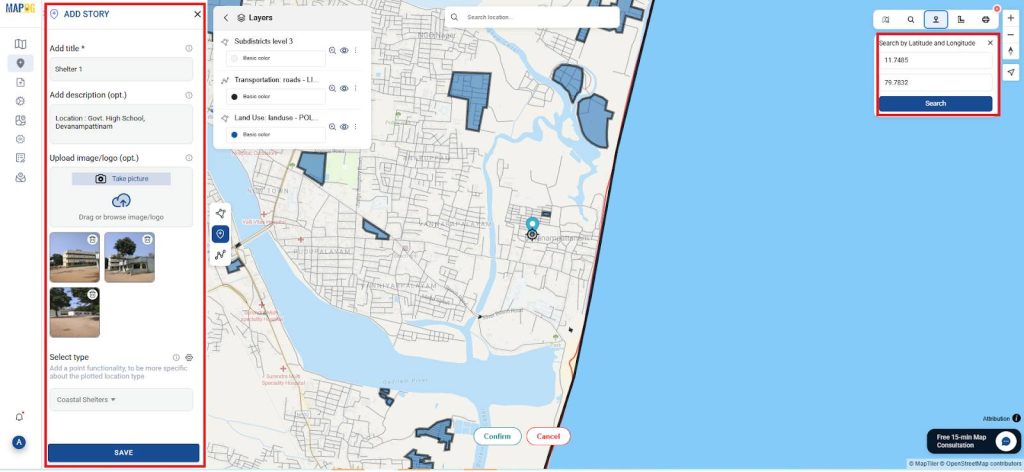
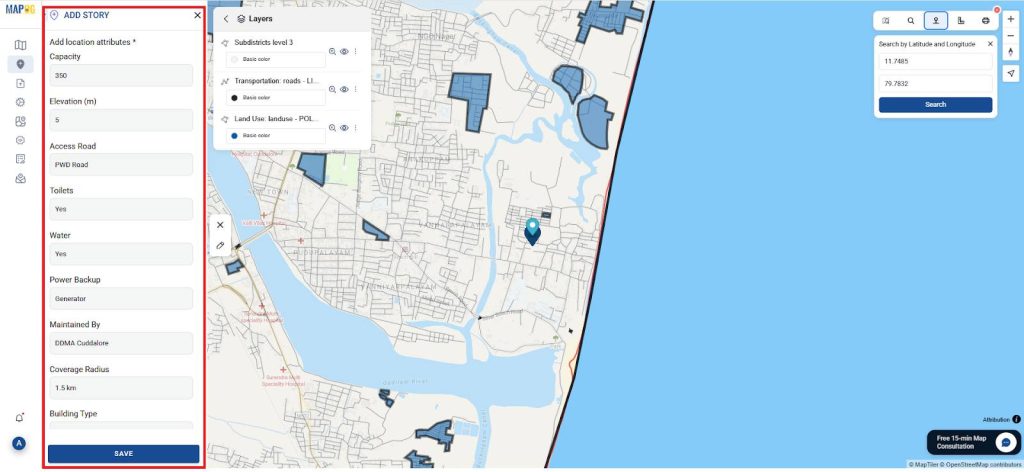
- Similarly, add all locations to create detailed spatial shelter points.
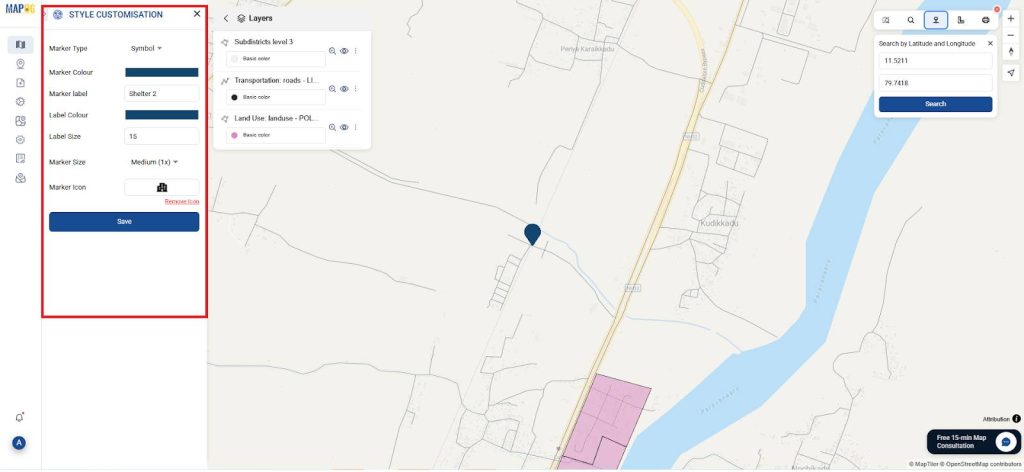
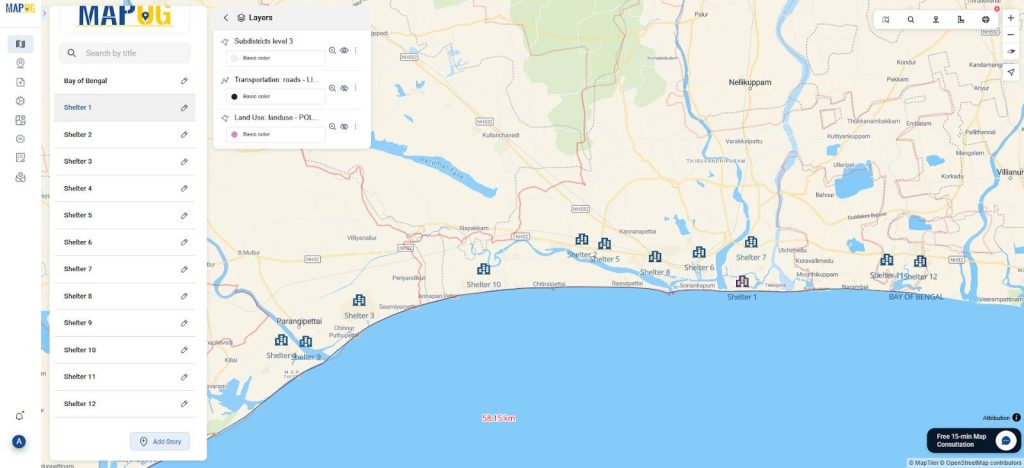
4. Customize Points for Visual Appeal
- Finally, label cyclone shelters and customize icons with emergency or shelter symbols using Point customization .
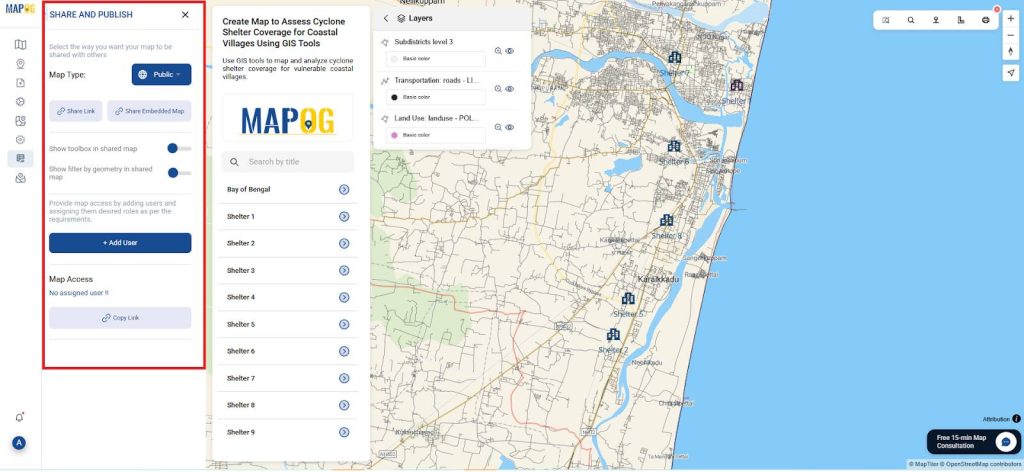
5. Share and Present the Map
- Finally, use MAPOG’s “Publish & Share” feature to export a live map link or embed it in a report or presentation.
- Thus, your map becomes a usable tool for community awareness, disaster drills, and planning discussions.
GIS Data Used
Insights and Applications
- Mapping cyclone shelters alongside roads and residential data clearly highlights underserved areas.
- Moreover, it guides decision-makers in planning new shelters and improving connectivity.
Relevance Across Disciplines
- therefore, this GIS approach benefits fields like disaster management, urban planning, environmental studies, and public infrastructure.
- It also encourages collaboration among students, planners, and NGOs on safety-driven projects.
Conclusion
To conclude, assessing cyclone shelter coverage using MAPOG doesn’t require complex tools, just thoughtful layering and manual point entry. This method turns raw location data into a meaningful visual map for disaster planning. Ultimately, this makes spatial planning more accessible, impactful, and lifesaving.
In the end, MAPOG converts spatial data into usable visual solutions.
Several related studies have demonstrated its effective application.