Map your customers with interactive layers turns plain data into clear business insights. In fact, this approach visualizes buying patterns, engagement, and regional performance. Moreover, it helps identify loyal customers, new prospects, and high-value areas instantly.
Key Concept: Map Your Customers
Interactive customer mapping merges sales, location, and engagement data into one dynamic platform using MAPOG. Consequently, businesses gain a visual understanding of where their customers are and how they behave. Furthermore, this visual context makes it easier to compare regional performance and detect growth opportunities. Therefore, teams can act faster, plan better, and make smarter, data-driven decisions.
Why Use Interactive Layers?
Simply put, interactive layers transform spreadsheets into dynamic maps. You can filter customers by purchase value, type, or visit frequency. Moreover, zooming into areas or clicking points reveals details like sales, feedback, and channels. By combining layers such as customer category, branch location, and delivery radius, businesses quickly uncover insights and adjust strategies where engagement is highest.
Methodology: Map Your Customers
Interactive mapping refines customer insights and simplifies decision-making across teams. It turns complex data into clear visuals. Now, let’s explore the methodology for mapping customers using MAPOG.
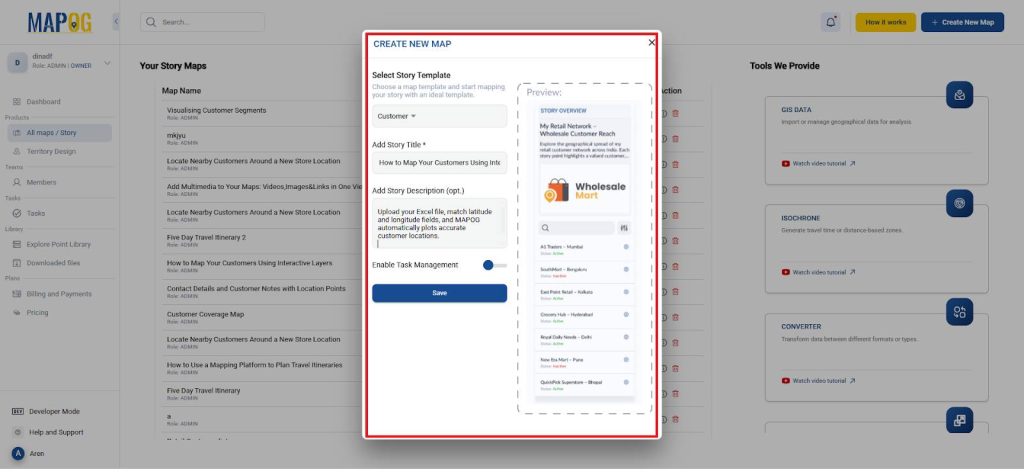
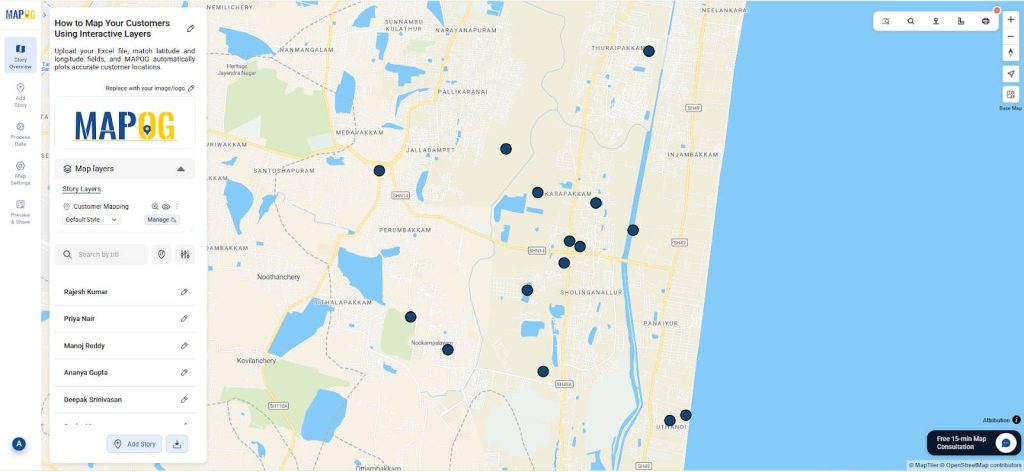
Create a New Project
- Firstly, open MAPOG and start a new map titled Customer Mapping.
- Then, write a brief description to define your mapping purpose.
- And select the story temple as a “customer”.
Upload Customer Data
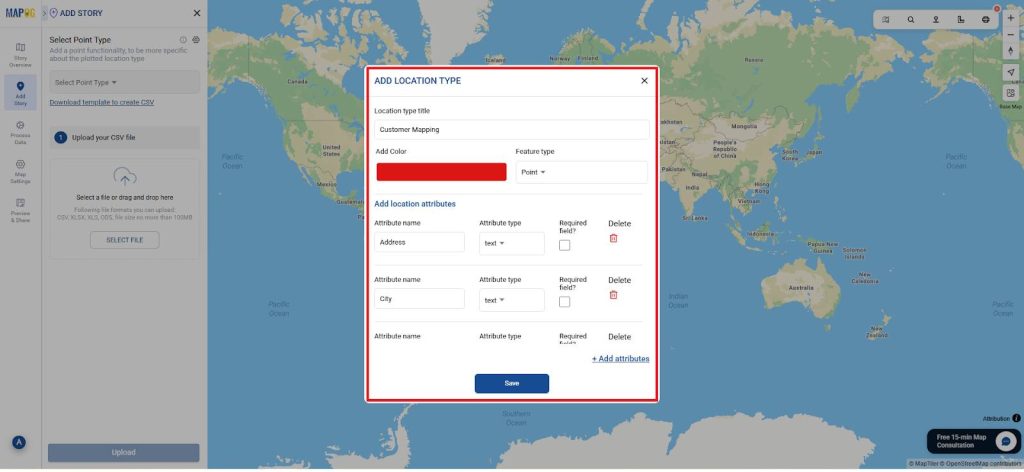
- Use the “Add by uploading CSV/Excel” option under the Add Story section. Then, open the Select Point Type Settings dialog box for location type management.
- Within this panel, select “Add More Location Types”, assign an appropriate title, set it as a point, and choose a preferred color for easy identification.
- Next, include relevant attributes such as Customer Name, Type, Purchase Value, or any additional parameters required.
- Define their data types accordingly to ensure accurate mapping and analysis.
- Next, browse your Excel or CSV file containing fields like Customer Name, Type, Purchase Value, Latitude, and Longitude. Optionally, include Feedback Score, Preferred Channel, and Visit Frequency for richer insights.
- Next, select the location type you created earlier and upload the Excel file under that category and upload it.
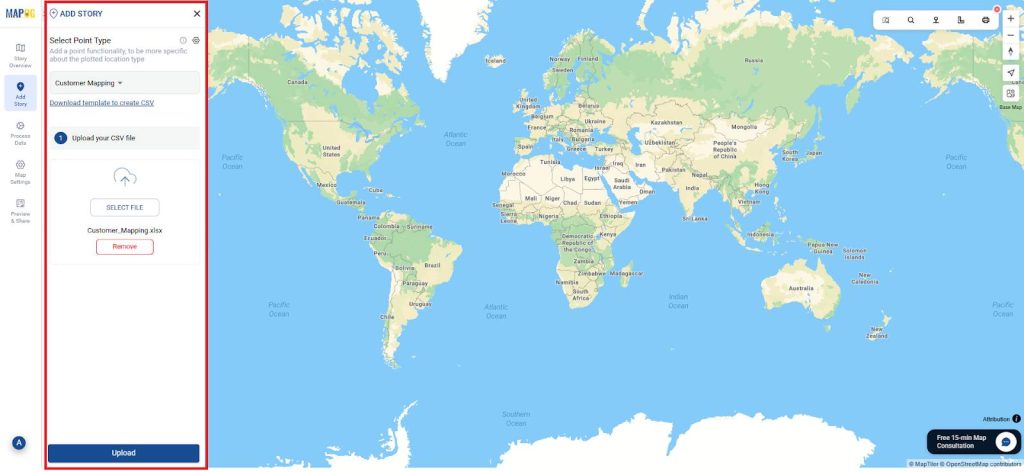
- Ensure that all fields are matched accurately, as MAPOG will automatically plot your locations on the map based on this data.
- It is essential to align the latitude and longitude fields correctly for precise placement.
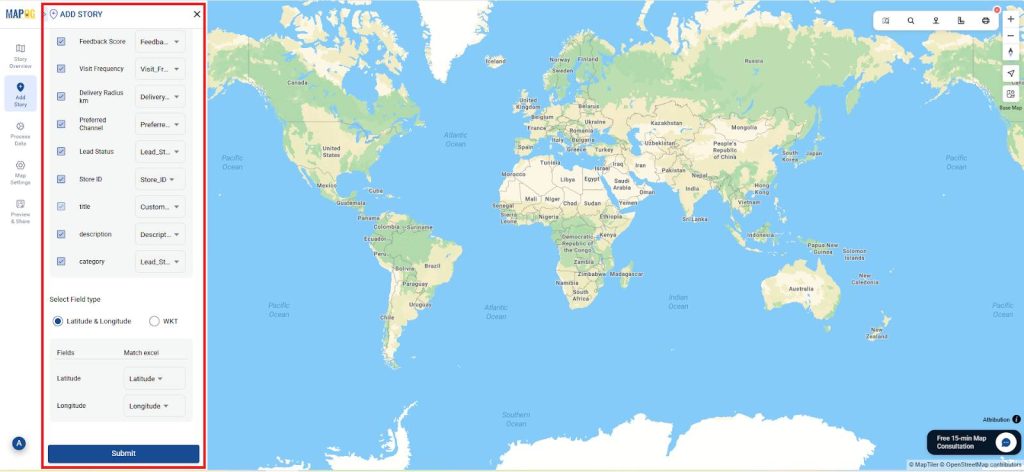
- As a result, you can easily review, refine, and validate each mapped location with accuracy and efficiency.
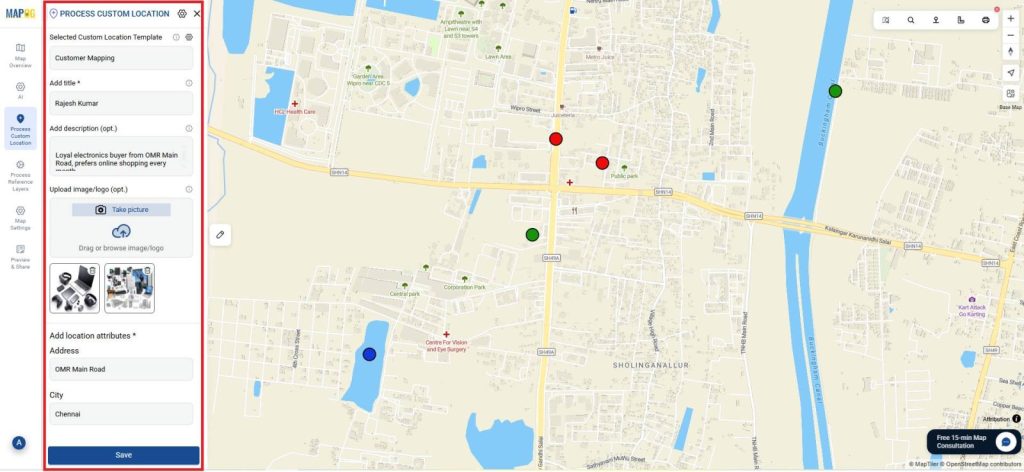
Add Descriptions and Media
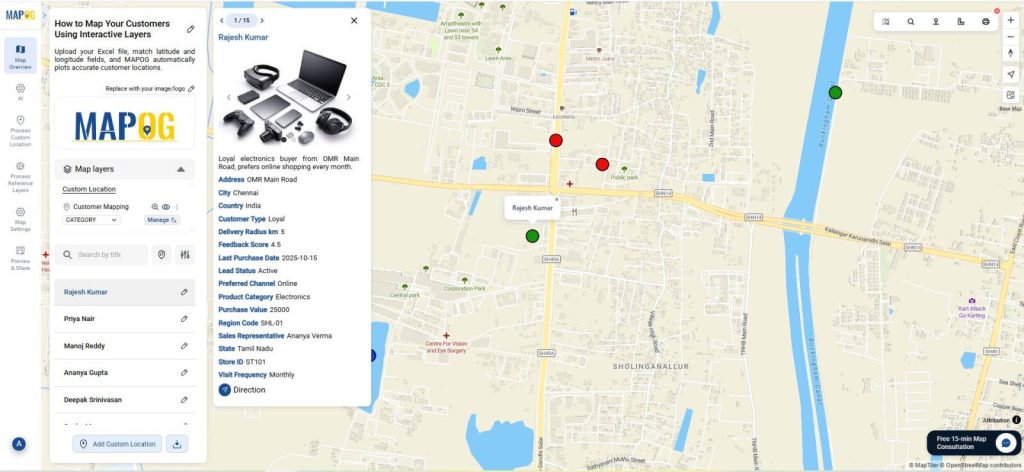
- Next, add the location details for each day, go to Edit point details and in settings add all the data as shown.
- Next, edit each customer point to include short descriptions and optional images of branches or products.
- Consequently, your customer map becomes more interactive and visually rich.
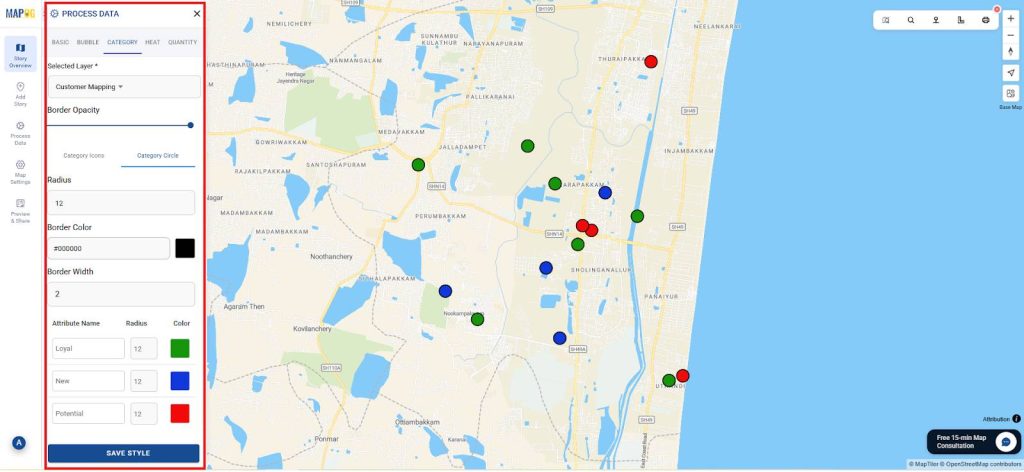
Apply Layer Styles
- Afterward, go to Story Layers → Add Layer Style → Category Style.
- Then, map attributes such as Lead Status and color them by category.
- For instance, green can mark Active buyers, while blue shows follow-up ones and red for Cold ones.
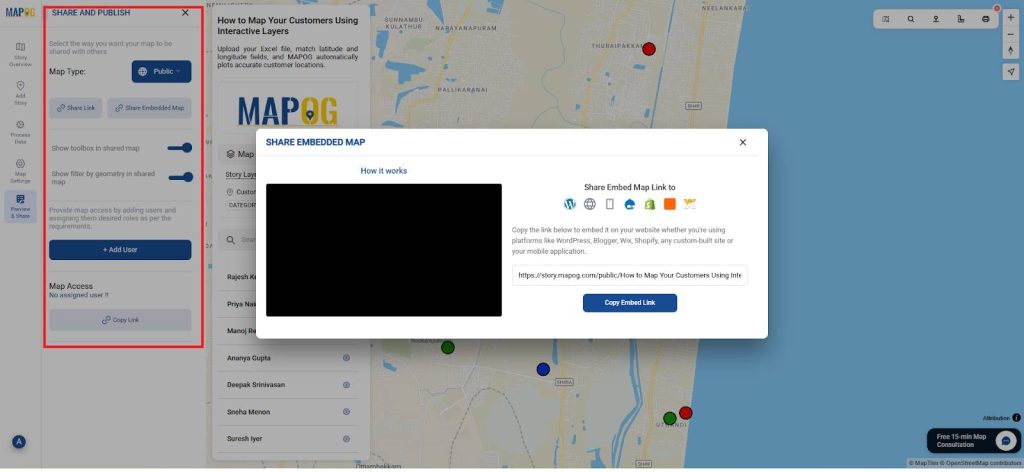
Share and Collaborate
- Finally, use Preview and Share to publish your customer map.
- You can embed it on your website, share with your team, or collaborate live.
- As a result, everyone can access the same data and act in real time.
Benefits of Map Your Customers
✅ Smarter Insights: See loyal, new, and potential customers at a glance.
✅ Efficient Planning: Adjust delivery zones and marketing areas quickly.
✅ Better Decisions: Base strategy on real-time data, not assumptions.
✅ Collaborative Work: Share maps with teams for synchronized updates.
✅ Eco-Friendly: Replace printed reports with interactive visuals.
Conclusion
In conclusion, mapping customers using interactive layers transforms how businesses see and serve their clients. Through MAPOG, every location becomes a story of loyalty, opportunity, and growth. Moreover, this digital approach bridges analytics and strategy, ensuring teams make smarter, faster decisions.
Consequently, organizations can visualize performance, plan efficiently, and build stronger customer relationships all through the power of interactive mapping.