Managing business assets across industries is complex, as locations scatter with maintenance, compliance, and operational risks while spreadsheets fail in real‑time tracking. ATM networks highlight these challenges, spread across hubs and highways with delays and threats. MAPOG transforms this landscape, enabling organizations to map and manage business assets through interactive attributes and structured workflows.
Key Concept: Why to Map and Manage Business Asset
The ability to visualize and manage business assets is essential. Without mapping, assets remain scattered and complex. Mapping ties them to locations, while management enforces accountability, simplifying oversight, reducing risks, and ensuring continuity across industries.
Steps to Map and Manage Business Assets
1. Create a Location Template
Begin by opening MAPOG, then access the Task Management Dashboard to organize workflow.

Click Create New Task. Then, select Create New Custom Location for a new site or Create from Existing Point for ongoing work.

Next, click the settings icon beside Custom Location Template and choose Add More Custom Location Template.

Give your template a title, and color then set geometry to Point, and add attributes like ATM name (Text), ATM type (Select), and Address (address). Then enable contributor access so users can update details on‑site, save the attributes, and reuse the template across projects.

2. Build Completion Forms
Once the template is ready, move to Completion Form Setup to create a validation form before closing tasks. Select the location template, then add questions for all tasks or customize per task, such as technical checks (Multiselect) or setup photos (Image), and save.

3. Create a New Map
From the dashboard, click Create New Map. Select map template as category, add a title and description, enable Task Management, and hit create to set the foundation for your project.

4. Upload asset locations
After creating the map, proceed to the Process Custom Location section. Then, choose Add by Uploading CSV/Excel to upload your sites in bulk.

Next, select your custom location template from the dropdown and upload your CSV/Excel file containing attributes and coordinates.

If your file has a unique ID, select it; otherwise, click Auto Generate ID to let MAPOG create one automatically. Then, match your attributes with the Excel fields. For placement, choose either Coordinates or WKT, and finally, click Save. As a result, all your assets will appear as points on the map.

5. Edit Asset Details
Once assets are visible, click the Pencil Icon on any point and select Edit Custom Location details.

Here, you can add descriptions, upload images, and refine location details, making each asset more informative and visually complete.

6. Assign and Manage Tasks
After editing, select a location and click Add Task. Provide a task title, description, due date, and deal value if required.

Next, choose a task type from the options or create a custom one via the Manage option.

Then, create task‑specific completion forms in Completion Form Setup to add checkpoints for accurate reporting.

Save the task type, update its status (Open, Assigned), and set priority (Urgent, High, Medium, Low).

Moreover, add members through Add New Team Member, enter email IDs, and assign roles: Admins (full control over tasks and site details) or Others (limited to assigned tasks) and click Add.
Next, select member from the dropdown and allow user to edit location for onsite changes.

7. Style and Organize the Assets

In the Category section, select an attribute, choose icons, or upload custom ones.

Then, add labels by selecting attributes, adjusting font, color, and size, and saving them.

Additionally, use Group by Attributes to arrange locations by type or date.

Apply the Filter Tool to display specific attributes like area and ATM type.

Finally, use Sorting to organize sites by name or live distance, prioritizing urgent visits.

8. Monitor and Update Tasks
Meanwhile, through the MAPOG Contributor App, assignees access tasks, filter by priority or status, and update progress as Arrived, Started, or On Hold. When marked Completed, completion form appears, they fill it with comments, photos, or videos before submission.

Simultaneously, admins can monitor progress in the Task management dashboard, filter tasks by status or type,

review location updates, approving or rejecting them to maintain accountability and

Review completion forms, update statuses, and comments making all assets stay organized and manageable from one central dashboard.

9. Preview and Share
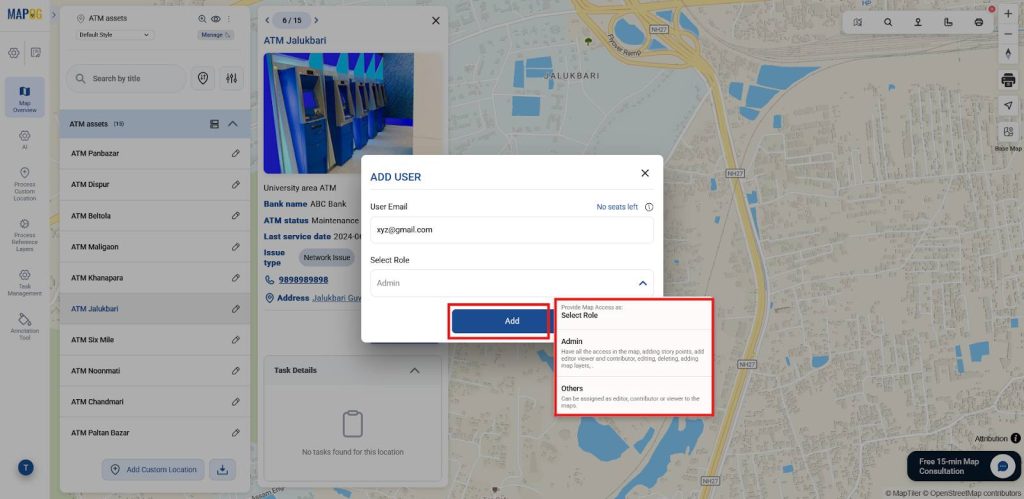
Finally, open Preview and Share. Invite users via Add User and assign roles. Editors can edit, add points, and invite others but cannot delete or assign admins; Viewers have read‑only access. Alternatively, share publicly via link or embed for seamless collaboration.

Industrial Use and Benefits
Mapping assets with task workflows benefits not only ATM networks but also real estate,solar, hospitality, and IT; delivering visibility, accountability, reduced downtime, stronger compliance, and seamless collaboration across operations.

Conclusion
Ultimately, mapping and managing business assets on an interactive map ensures efficiency and accountability. With MAPOG, industries achieve visibility, compliance, and seamless collaboration, transforming scattered operations into structured control.