In every business, understanding where your customers truly come from can completely transform your growth strategy. Moreover, when you Identify High-Density Customer Areas, it becomes easier to plan expansion, target marketing efforts, and optimize logistics efficiently. For instance, imagine having a store in one area where only 20% of your customers are local, yet 80% travel from another town. Clearly, the actual customer base lies elsewhere, and therefore, identifying that high-density area becomes crucial. With MAPOG, businesses can not only visualize customer data interactively but also make confident and timely decisions about where to open their next store.
Key Concept: Identifying High-Density Customer Areas Using Interactive Maps
Furthermore, interactive maps act as powerful analytical tools that allow businesses to visualize customer distribution across multiple locations. When you aim to Identify High-Density Customer Areas, these maps seamlessly highlight clusters and trends that raw data alone can never reveal. MAPOG, in particular, simplifies this entire process through its “Add by uploading CSV/Excel” feature, allowing businesses to upload and map customer data quickly and conveniently. Once plotted, you can immediately analyze spending levels, purchase frequency, and even visualize overall sales performance.
Step-by-Step Process to Identify High-Density Customer Areas
Step 1: Uploading Customer Data to Begin Mapping
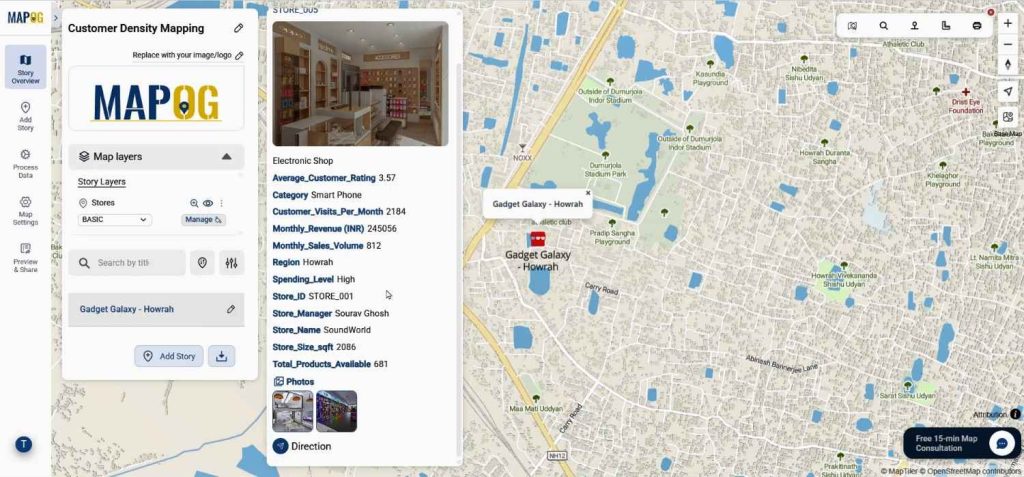
Start by visiting MAPOG. Begin with the map of your existing store location.
Step 2: Setting Attributes for Meaningful Insights
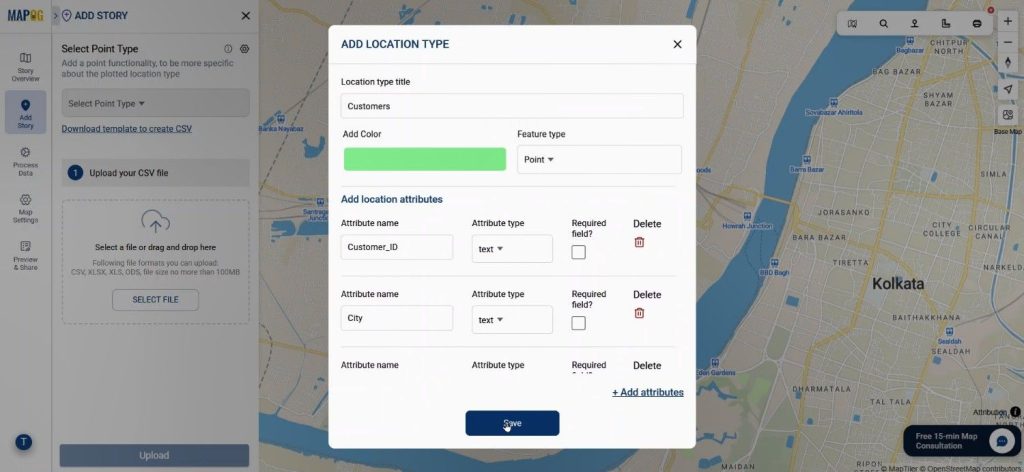
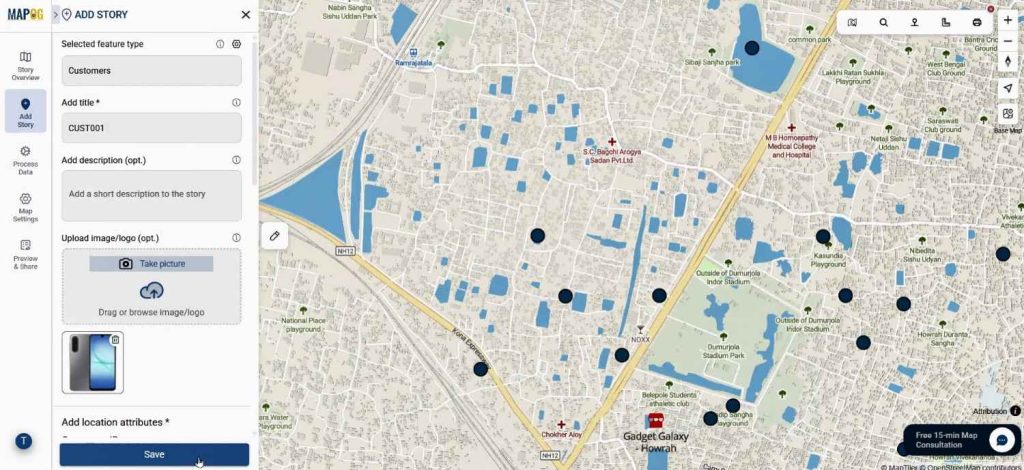
Then go to the Add Story section. Next, use the “Add by uploading CSV/Excel” option to upload your customer data. Next, under the Select Point Type settings, carefully define a new attribute type as “Customer.” After that, within this section, add attributes such as purchase volume, spending level, and frequency. Together, these details not only help you filter but also compare customer behavior more effectively. When you identify high-density customer areas through these data points, you can better understand which regions contribute most to sales performance.
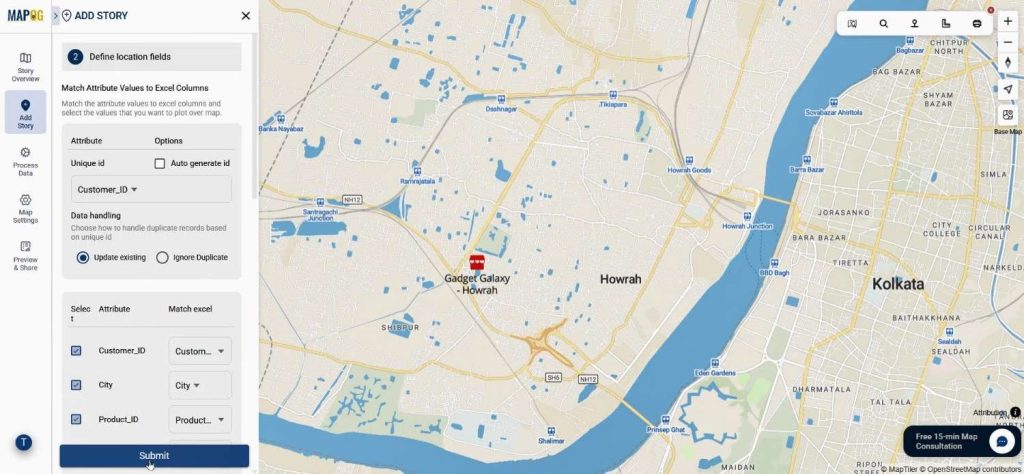
Step 3: Match Attributes and Map Coordinates
Upload your prepared CSV file containing detailed information with coordinates. Select Customer ID as the unique identifier, then match all columns with the appropriate attributes. Choose coordinates fields to pinpoint each customer’s location. Once submitted, your data points will auto-plot.
Step 4: Edit & Styling the Map for Better Visualization
Go to the Edit Point details, and attach the purchased items images to customers points.
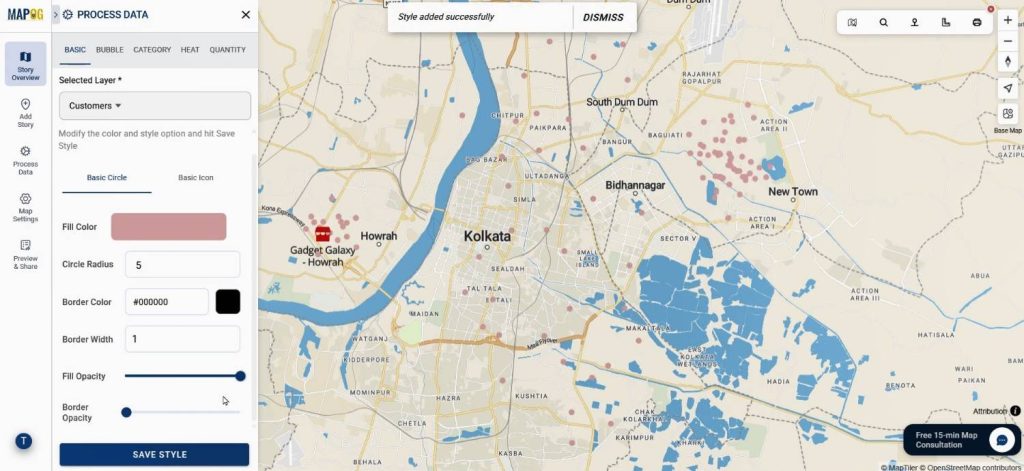
Select basic style under Add Style Layer. Here, you can apply colors to represent customer. This visual layering helps you immediately recognize the high-density customer areas and makes your analysis more engaging and actionable.
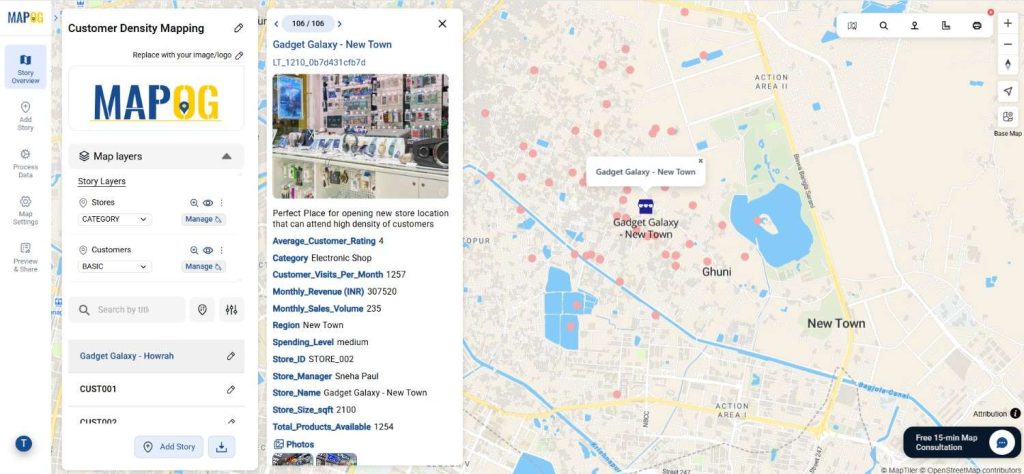
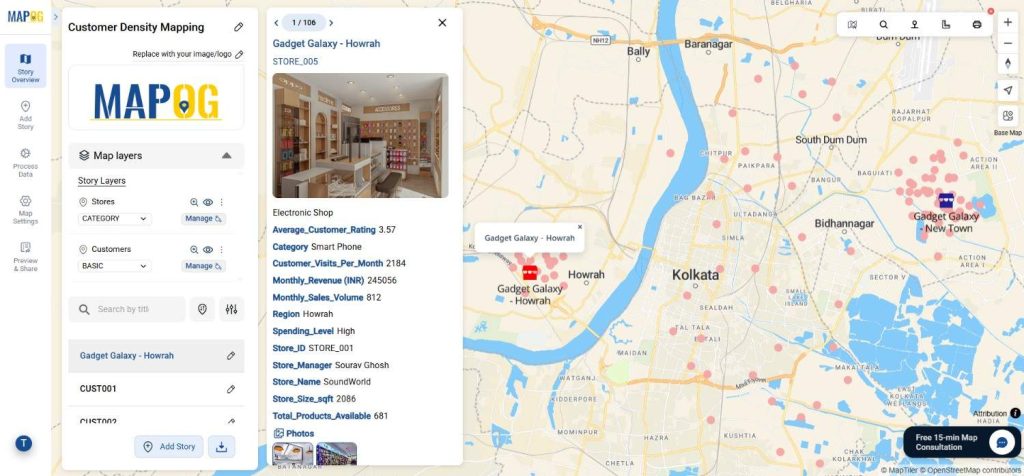
Step 5: Identifying the High-Density Zones and New Store Location
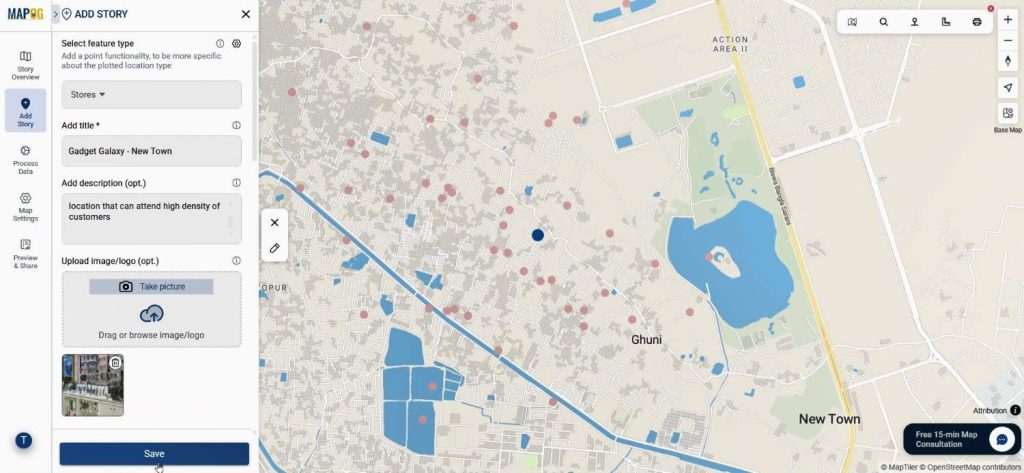
With all points visible, analyze which area shows the densest cluster of customers. This insight indicates where your next store should ideally be located. You can now pinpoint your new proposed location and confirm it from Add manually under the Add Story section by selecting the “Store” feature type and entering relevant details and images.
Step 6: Differentiating Store Layers for Clear Comparison
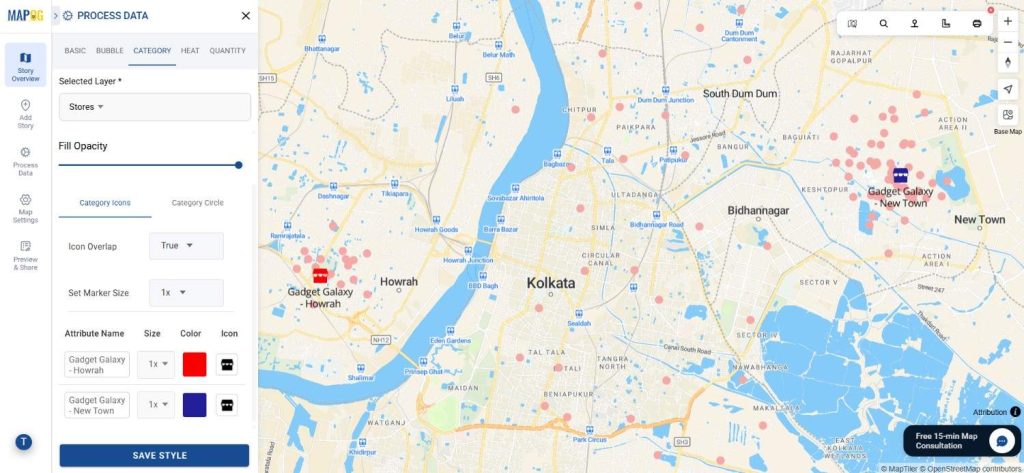
In the final step, return to the Store Layers section and open Add Style Layer once again. Use distinct colors to differentiate between your existing and new stores—red for the existing store and blue for the new one. This color contrast visually communicates growth strategy and makes it easy to compare performance once data starts flowing in.
Industry Use & Benefits of Identifying High-Density Areas
Additionally, the power to Identify High-Density Customer Areas benefits multiple industries. Retailers can strategically plan new outlets, healthcare providers can choose optimal clinic locations, and logistics teams can strengthen delivery hubs. Consequently, this leads to improved accessibility, reduced travel time, and higher conversions.
Conclusion
Ultimately, by mapping customer locations through MAPOG’s “Add by uploading CSV/Excel” and “Add style layer” features, businesses can seamlessly Identify High-Density Customer Areas. This process not only connects data analytics with spatial intelligence but also empowers teams to plan confidently, expand wisely, and grow faster. In short, it’s more than just visualization—it’s your roadmap to smarter, data-driven expansion.