To combine all the customer data from the field is a common challenge for organizations. Teams collect location details, service feedback, and on-site observations through a mix of mobile apps, paper forms, and spreadsheets, but this mix of formats often leaves the data scattered and hard to interpret.
A unified map solves this problem by consolidating all inputs into a single geographic view, helping teams quickly see where customers are and what issues they face across different regions. Moreover, with MAPOG, this process becomes even smoother, enabling standardized data, clearer patterns, and faster, more confident decision-making.
Key Concepts for Combining Customer Field Data on a Map
To combine all customer data from the field into one map, a few core ideas guide the process:
- Data Consolidation: Bringing all field inputs into one unified dataset.
- Standardization: Using consistent formats to keep data clean and comparable.
- Geospatial Mapping: Plotting customer locations for clarity and pattern detection.
- Unified Platform: Managing everything in one place with a tool.
Step by Step Guide on how to combine customer data from field on to a map
1. Start with Mobile data collection
Go to MAPOG and then navigate to Mobile data collection. Then, click on Create New to create a new map.
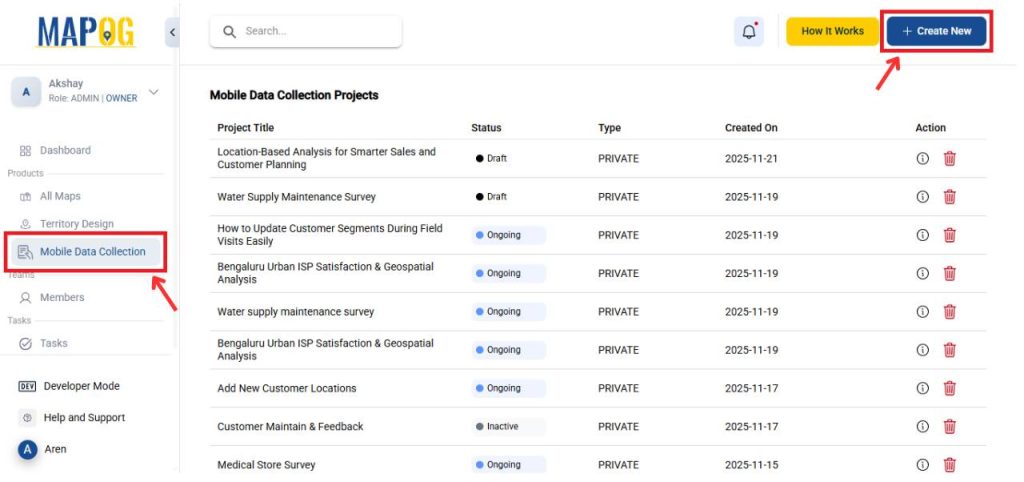
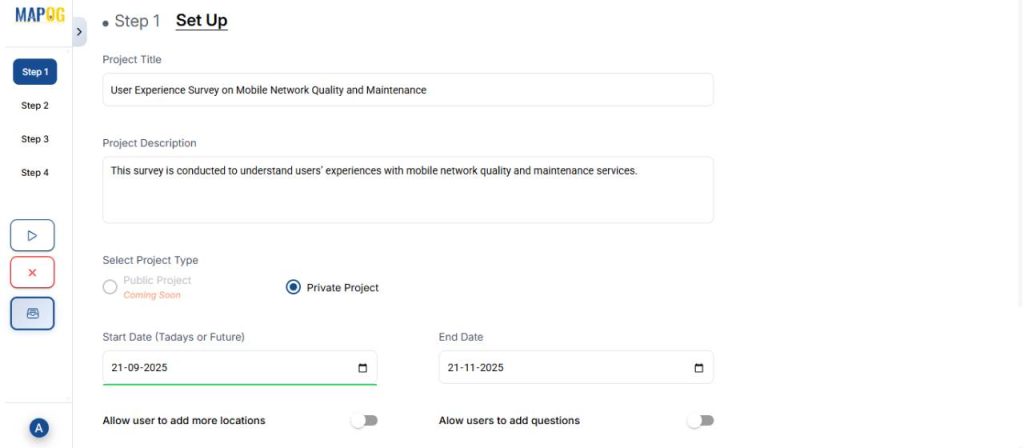
Give the project a title and description along with other details.
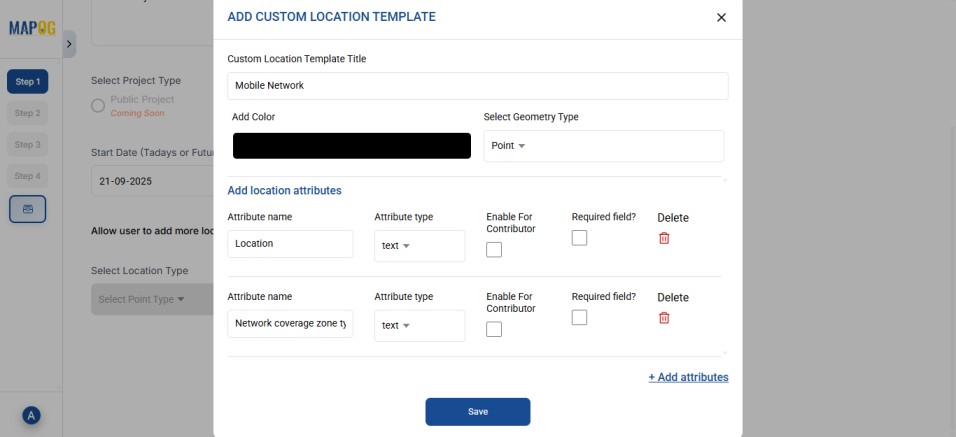
2. Creating a new Location Type
Then, go to Select Location Type to create a new location type. Give it a name, choose a geometry type such as Point, and add all necessary attributes.
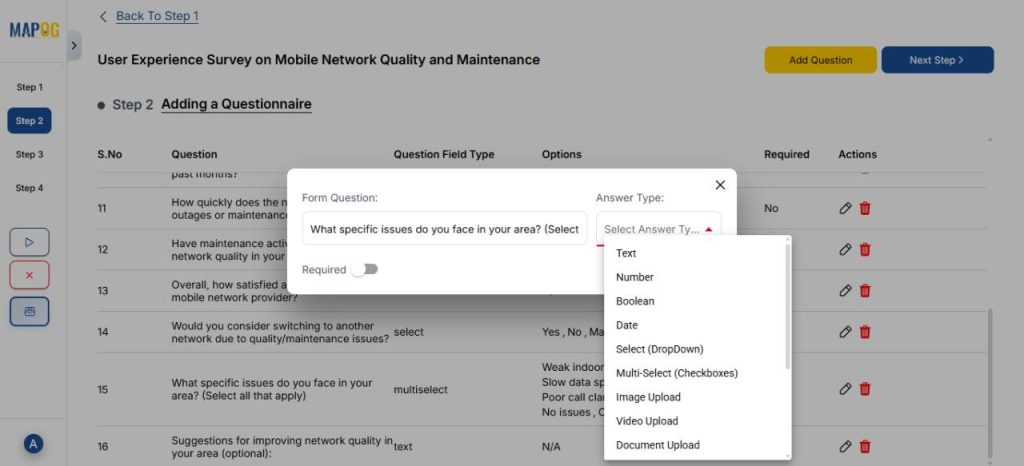
3. Create a Questionnaire
Proceed to Step 2 and click Add Question to include the questions for your survey. Since this survey focuses on mobile network experience, add items like customer name, address, network provider etc. Use the dropdown menu to choose the answer type like text, select, or multiselect based on the kind of response.
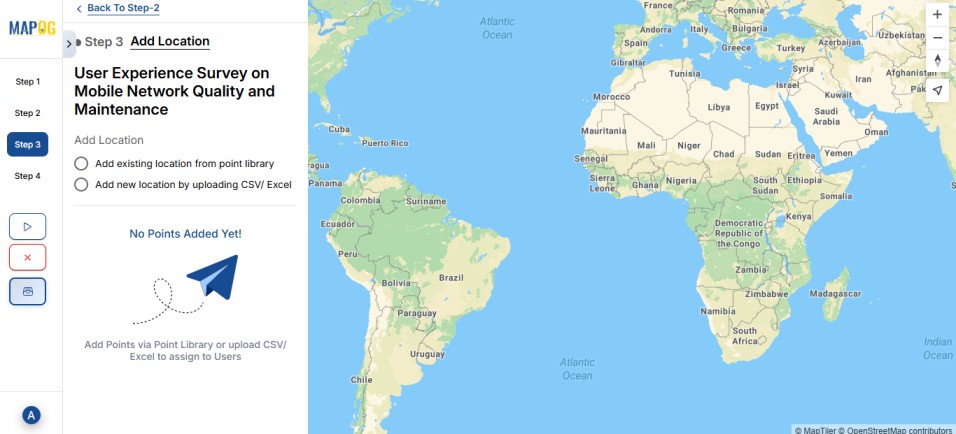
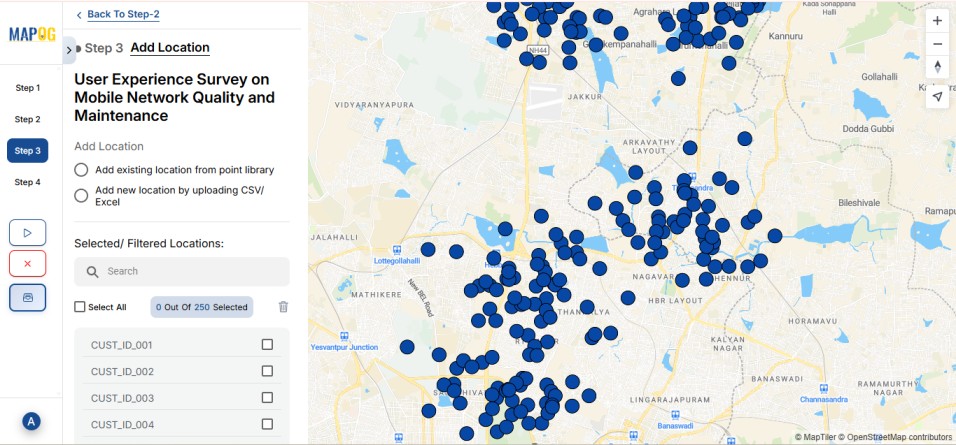
4. Upload Customer data
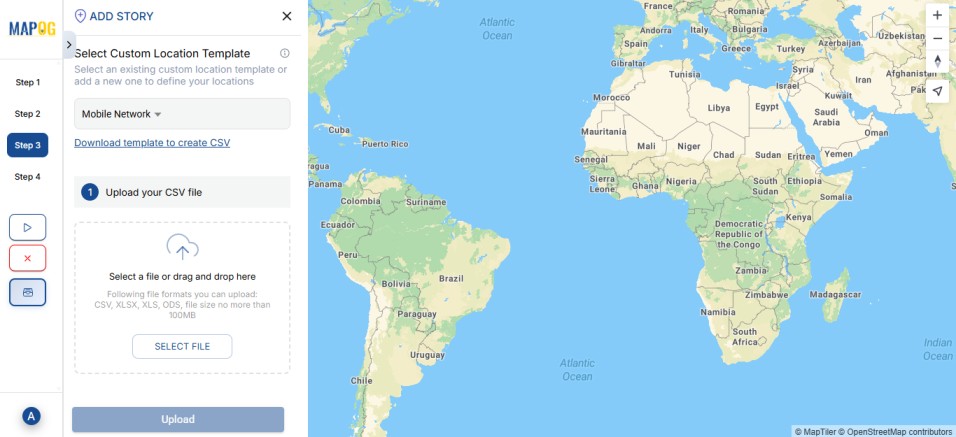
In the next step, click on Add new location by uploading CSV/Excel.
Upload your file.
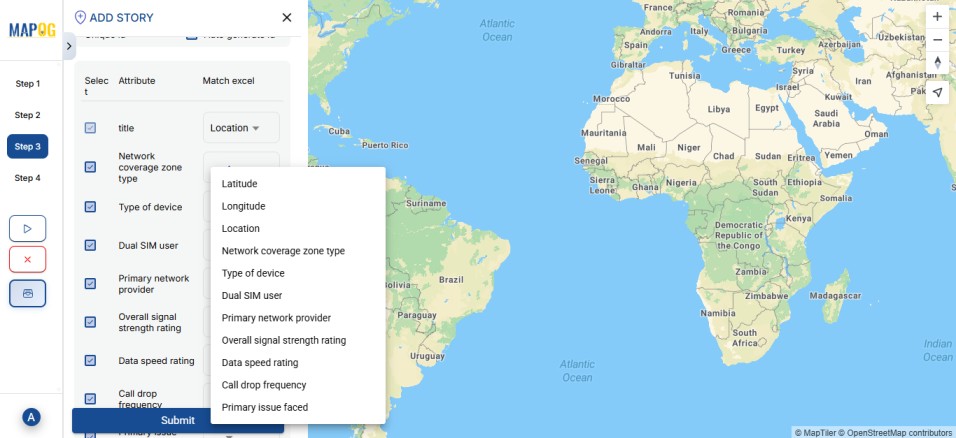
Match your excel with attributes and field type to either coordinates or WKT format, then submit.
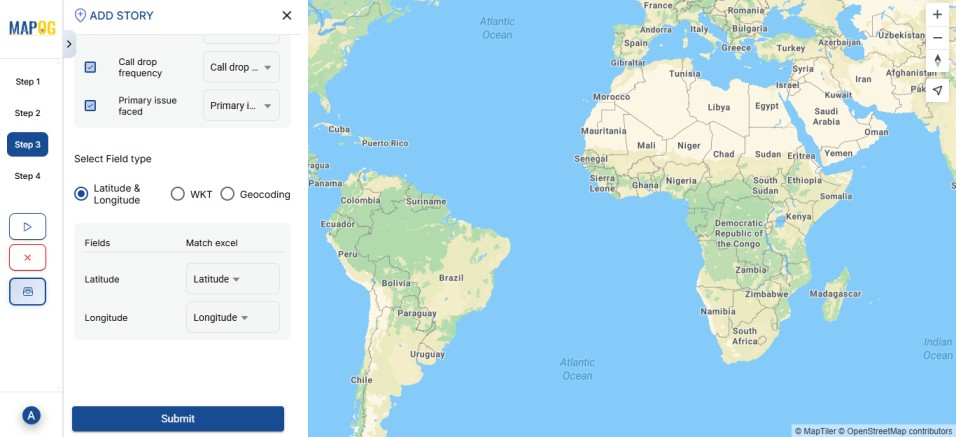
Your customer points are now visible on the map.
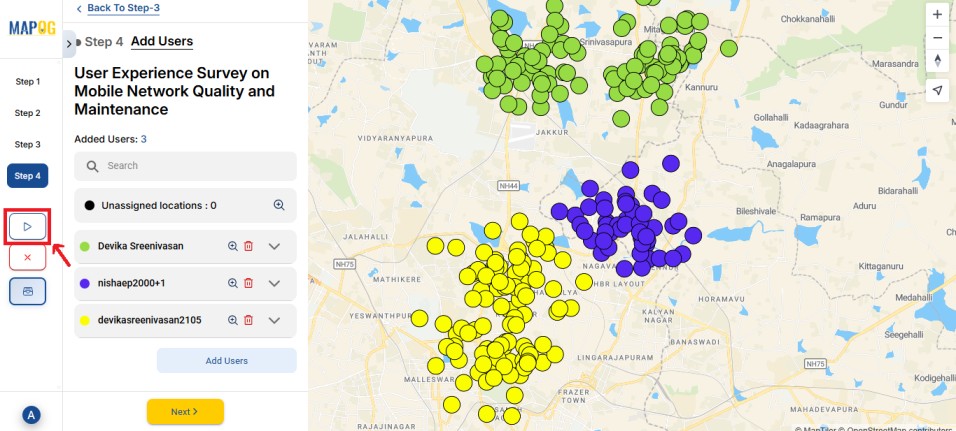
5. Adding Users and Assigning Role
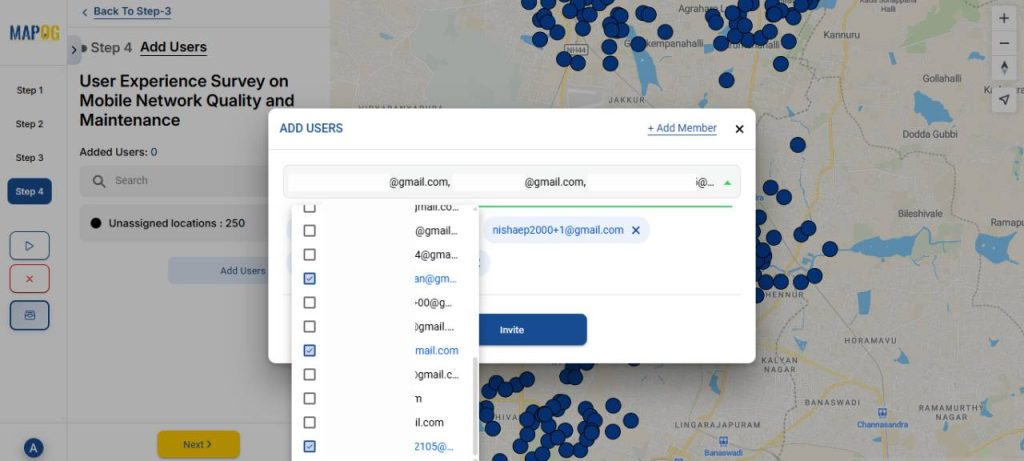
Next, click Add User to include team members and assign roles based on your project requirements.
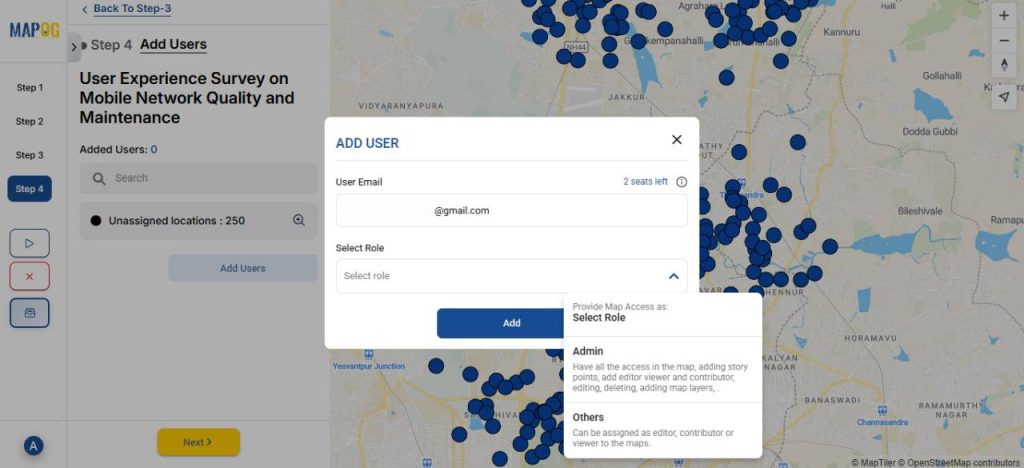
Then, select the members from the dropdown and invite them.
Then, click on the Map tab. Draw polygons to divide the points and assign them to team members. You can also use color-coding to make the divisions clearer.
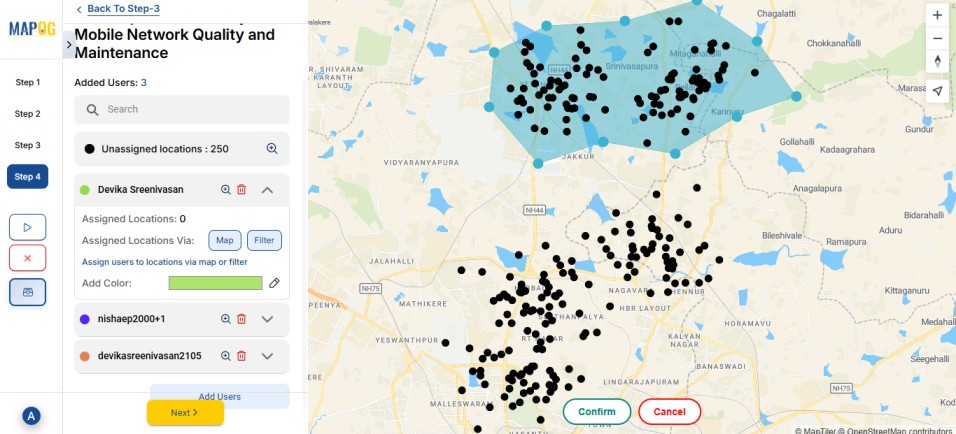
You can also use the Filter option to assign locations by switching from Unassigned to All Points.
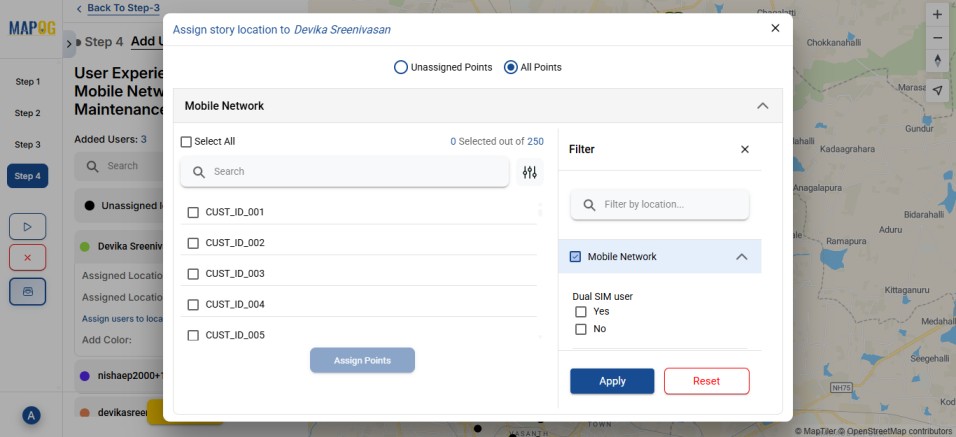
Once done, launch the survey.
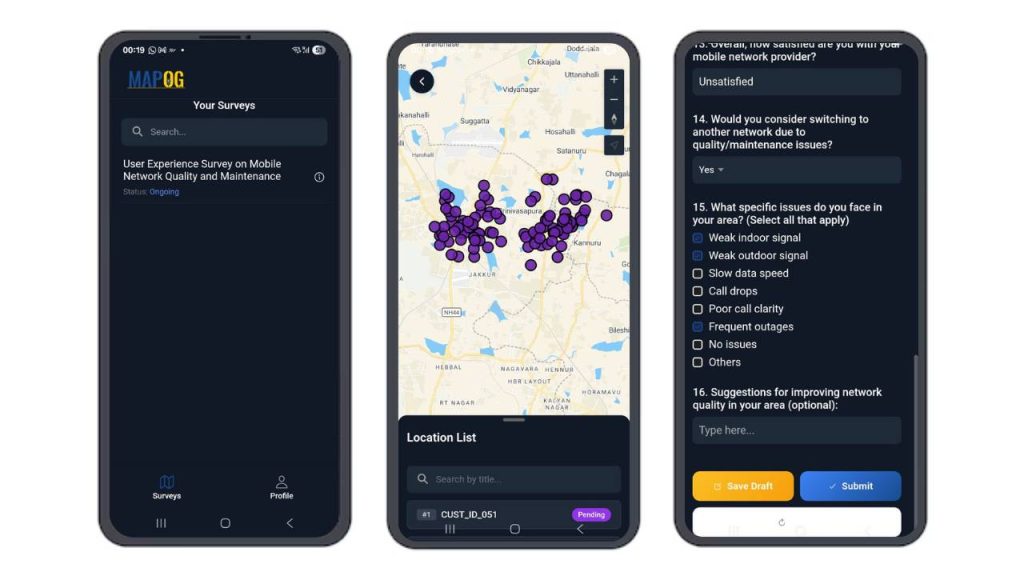
6. Contribute to the Survey via Mobile App
On the MAPOG Contributor app, assigned members can view and complete their surveys, saving drafts or submitting responses directly. Subsequently, all updates are synced automatically to the MAPOG browser in real-time.
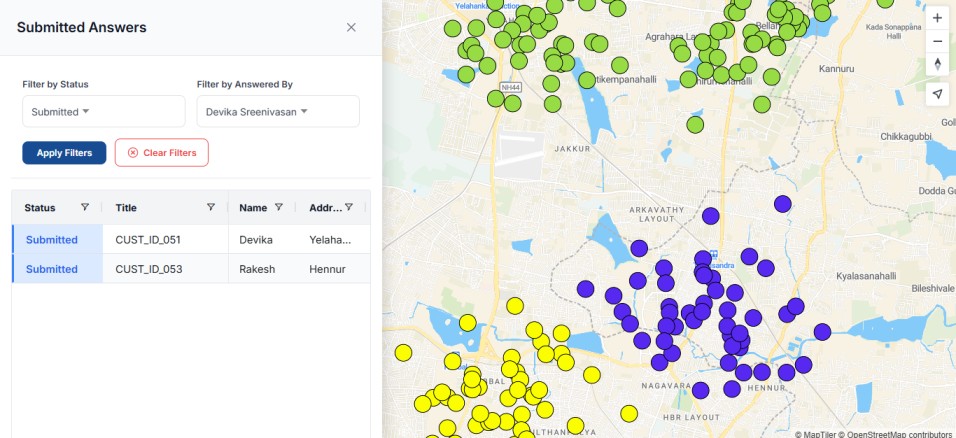
7. Monitor and Analyse Results
Use the Overview panel to track the status of your survey. Here, you can view key statistics such as the number of pending, drafted, and submitted responses.
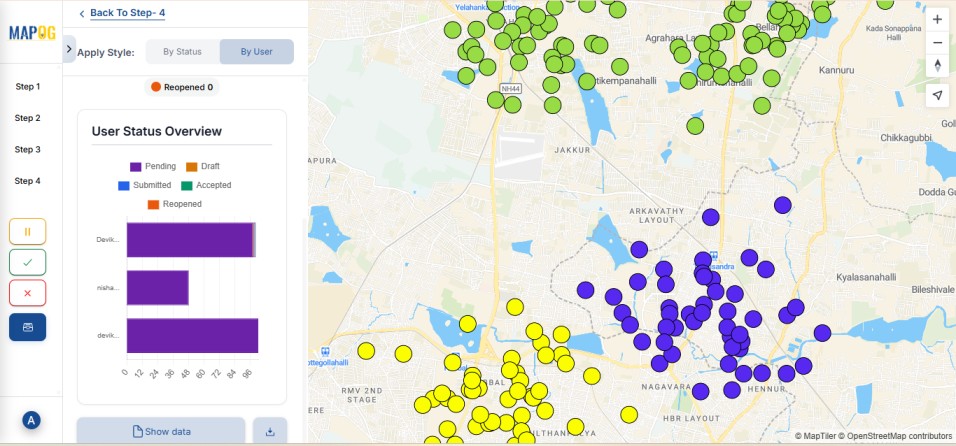
You can also monitor progress by filtering customer responses based on the team members they were assigned to.
Real World Applications
Unified field data mapping has a wide range of practical uses across industries. For instance, telecom teams rely on mapped customer signal strength, and service issues to identify weak zones and plan necessary tower upgrades.
Similarly, utility departments benefit from mapping faults, outages, and repair progress, which helps them prioritize tasks. In addition, companies use mapped customer visits, feedback, and service quality metrics to conduct service audits and improve response times.
Conclusion
A unified map makes field-collected customer data clear and actionable. Instead of relying on scattered spreadsheets, teams gain one accurate geographic view that highlights patterns and issues. Moreover, with standardized inputs, real-time syncing, and tools like MAPOG, data becomes easier to manage, and decisions become faster and more effective.
Want to check out MAPOG contributor app, Here’s the links below
App Store: https://apps.apple.com/us/app/mapog-contributor/id6754868956
Play Store: https://play.google.com/store/apps/details?id=com.mapog.contributor