To analyze village healthcare coverage, planners increasingly use maps because they turn scattered health data into clear, visual insights. In rural planning, decision-makers often delay actions due to poor visibility. However, when analysts map villages and healthcare facilities together, they identify coverage gaps faster. As a result, MAPOG make village healthcare coverage analysis not only easier but also more practical by combining GIS Data with spatial analysis tools such as Convex Hull.
Key Concept: Why It Matters to Analyze Village Healthcare Coverage
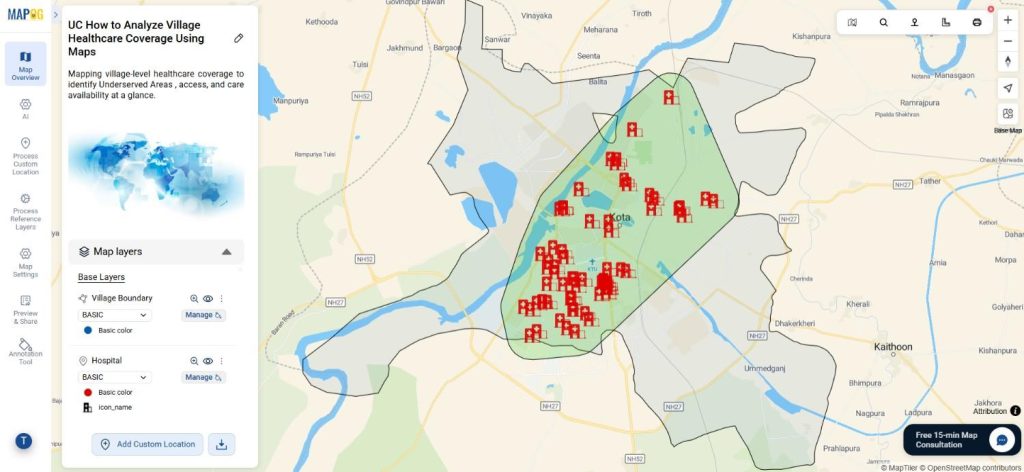
When you analyze village healthcare coverage, you actively check whether hospitals and clinics remain accessible to all residents. For example, a village may appear close to a hospital on paper, yet healthcare providers may serve only a limited area. Therefore, by overlaying village boundaries with hospital locations using MAPOG GIS Data, analysts visually reveal underserved zones. Consequently, planners, NGOs, and local authorities can confidently prioritize healthcare expansion.
Step-by-Step Process to Analyze Village Healthcare Coverage Using Maps
Step 1: Create a Healthcare Mapping Project
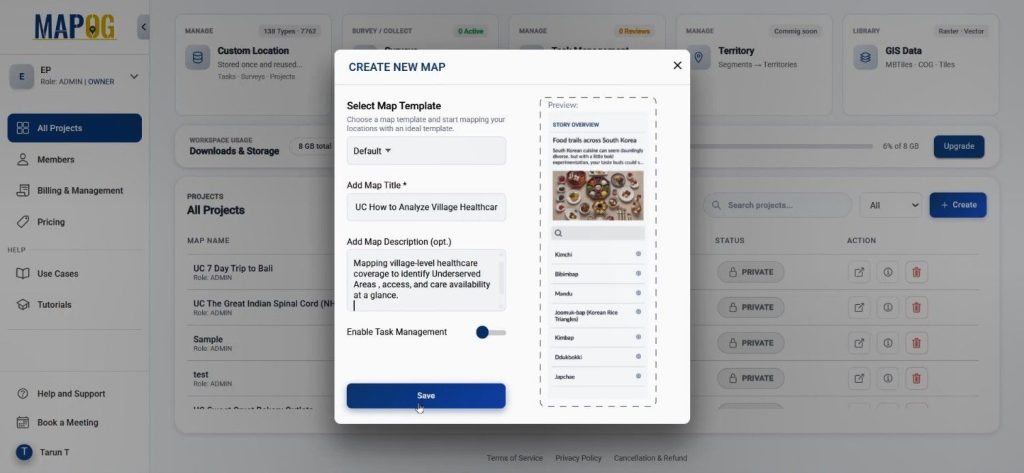
First, create a new project in MAPOG by clicking the “create” option, There set the title and description and hit saved. This initial setup ensures the healthcare objective remains clearly defined throughout the mapping process.
Step 2: Add Village Boundaries Using GIS Data
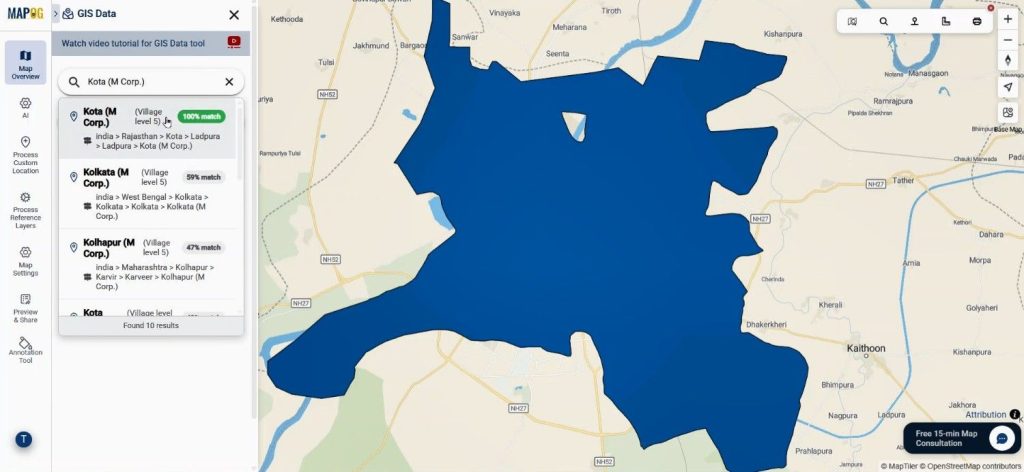
Next, open the map interface and Go to Process Reference Layer → GIS Data.
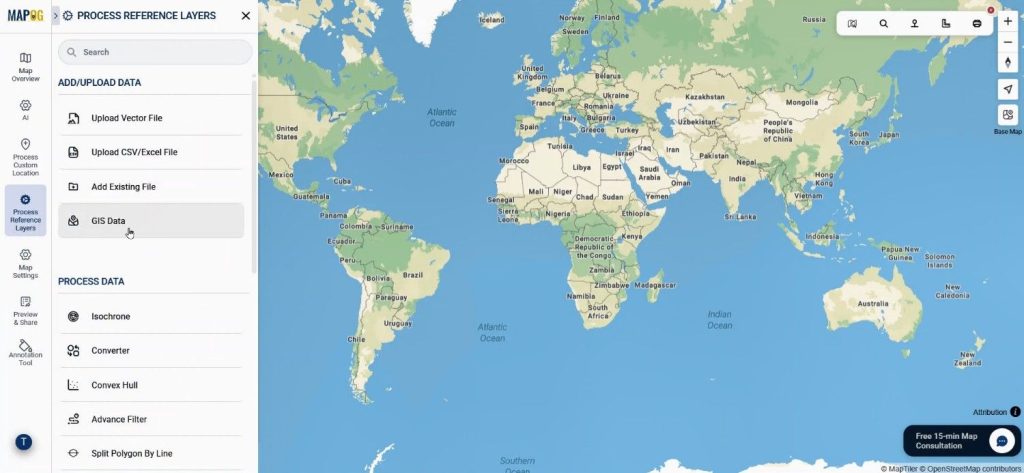
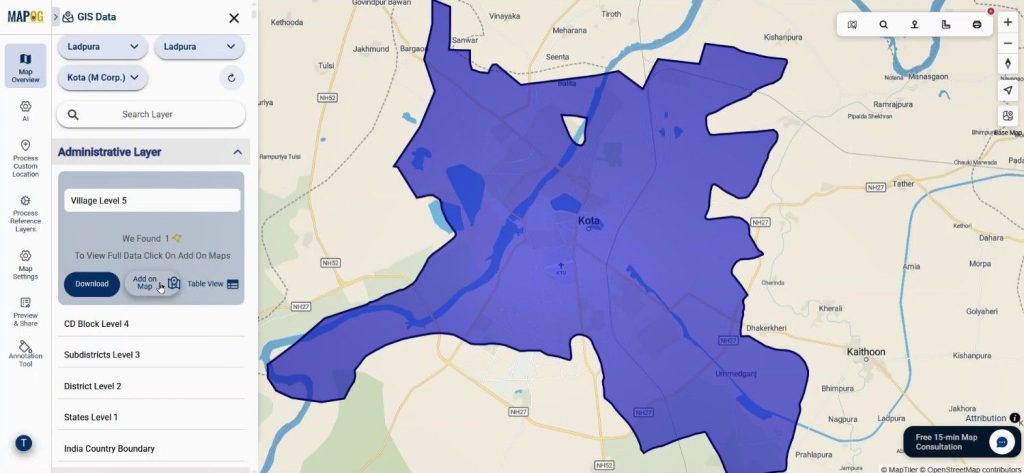
Users search village-level boundaries from country to village scale and add them directly using the “Add on Map” option. Hence, they establish the base geography accurately.
Step 3: Add Hospital Locations Precisely
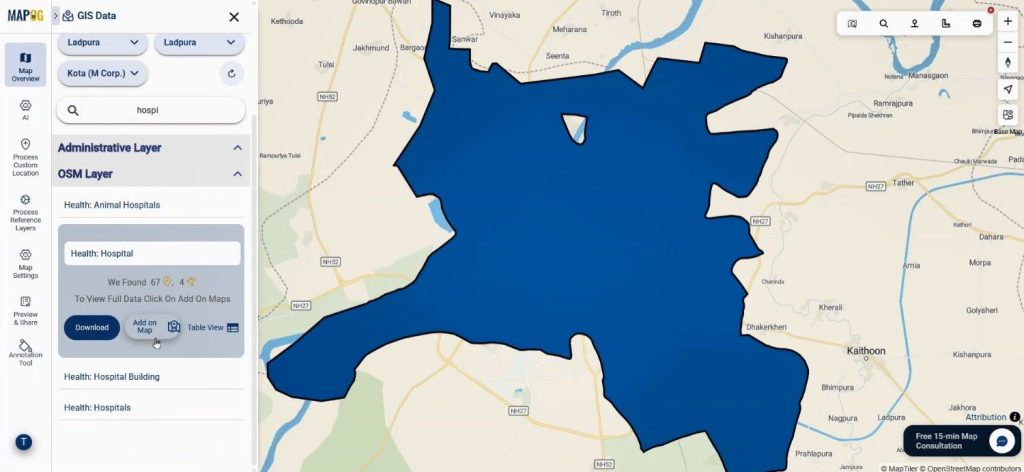
Then, users access GIS Data again, but this time they search the exact place name using “Search for any place.” Available matches appear.
After which, users search hospital data and add it to the map. As a result, the system positions healthcare facilities precisely.
Step 4: Style and Organize Healthcare Layers
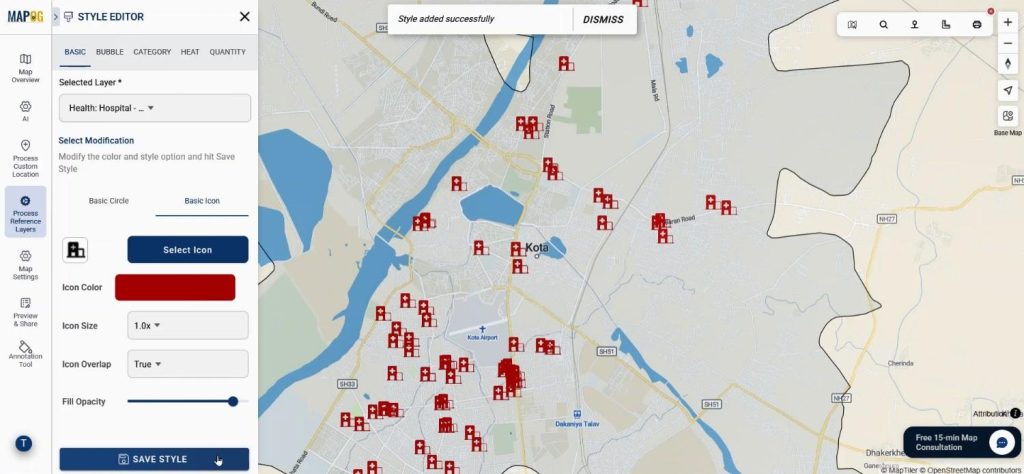
Afterward, users apply the Add Style Layer option. They reduce village opacity while highlighting hospital layers with proper colors and icons.
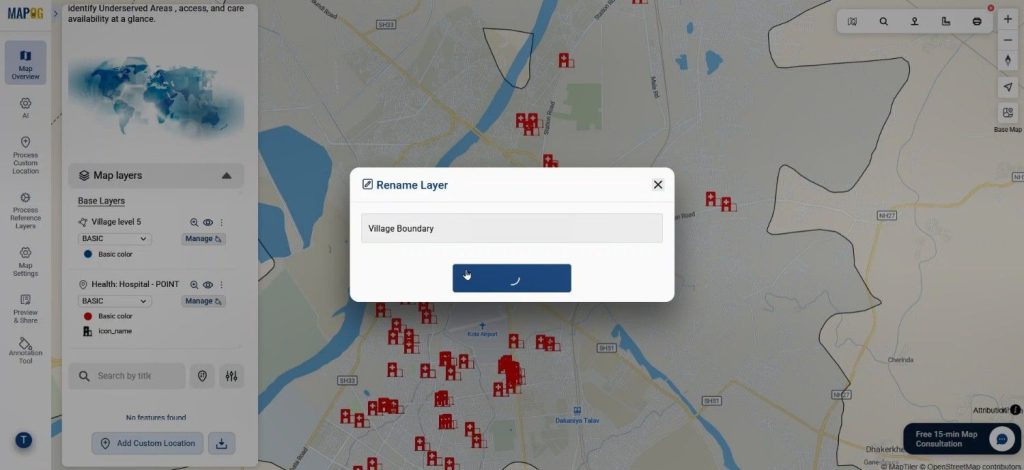
Users rename both layers for clarity, which improves readability and interpretation.
Step 5: Apply Convex Hull for Coverage Analysis
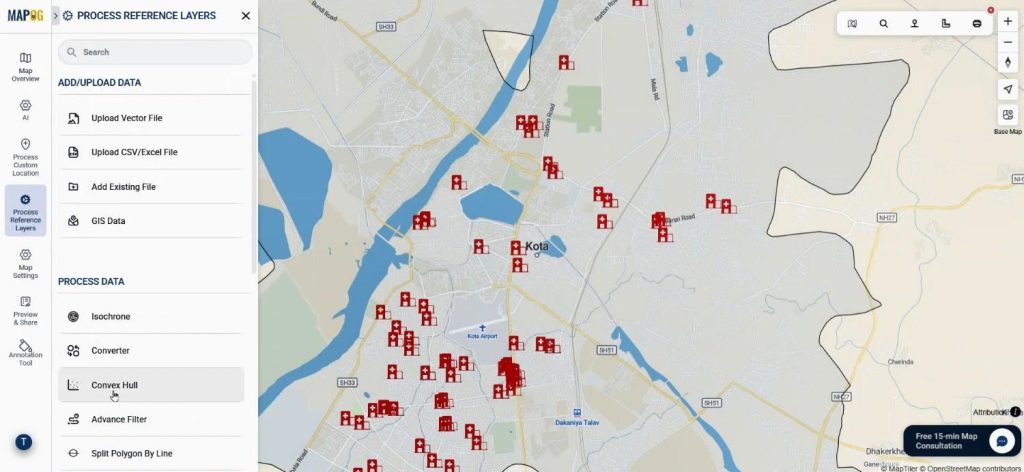
Finally, Select Convex Hull from process reference layers option.
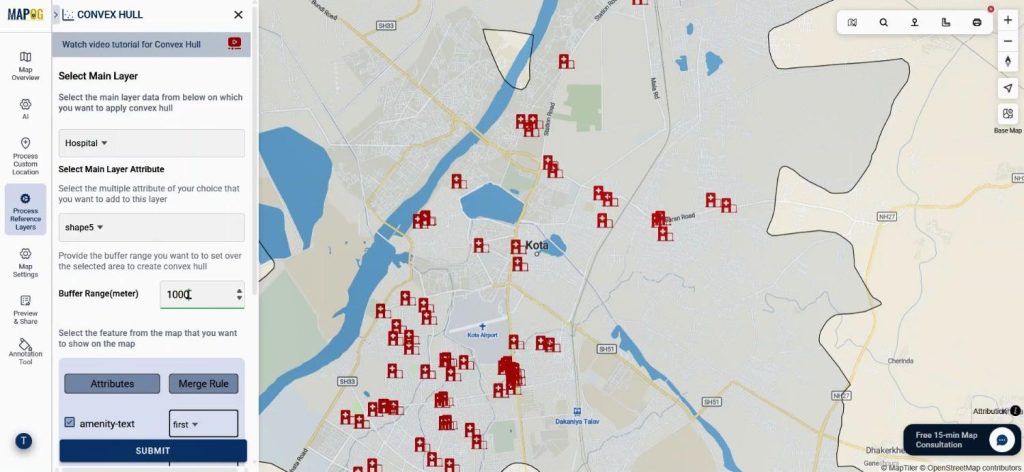
Users apply Convex Hull by selecting the hospital layer as the main dataset. They add village attributes and define a buffer range in meters.
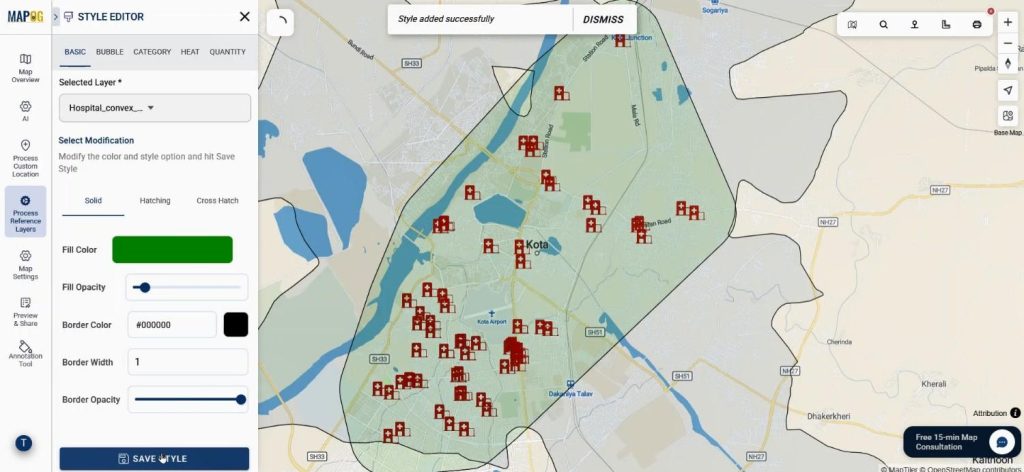
Consequently, covered areas appear clearly, while uncovered regions indicate underserved populations. Now using the add layer style option use different color and opacity for better visualization.
Step 6: Share and Publish the Map
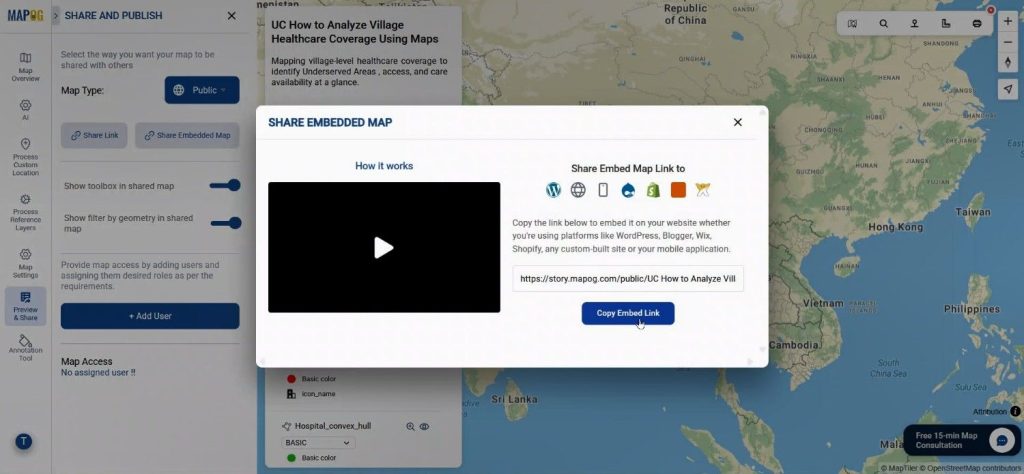
Once analysis is complete, the preview & share option is used, the map is set to public, and a shareable or embedded link is generated. Thus, insights can be shared with stakeholders easily.
Industry Use Cases and Benefits
When governments analyze village healthcare coverage, resource allocation becomes data-driven. Similarly, NGOs can identify villages needing mobile clinics, while researchers can compare healthcare access across regions. Because MAPOG integrates GIS Data and Convex Hull, spatial healthcare analysis becomes faster and more reliable.
Conclusion
In conclusion, to analyze village healthcare coverage, interactive maps offer clarity that spreadsheets cannot. By using MAPOG, healthcare gaps are visualized, decisions are improved, and rural health planning becomes more effective. Explore how spatial mapping can strengthen your next healthcare assessment.