In recent years, the importance of GIS Mapping of Landslide-prone areas has grown significantly. As climate conditions continue to worsen and extreme weather becomes more frequent, it is becoming increasingly critical to assess not only the vulnerable zones but also how surrounding communities and nearby roads can be affected. Consequently, this blog will walk you through an insightful and simplified approach to mapping such high-risk zones using interactive GIS platforms. Specifically, MAPOG offers story-based mapping where layers, tools, and insights seamlessly come together—thus making it easier for anyone to visualize threats and plan effectively.
Understanding the Key Concept: GIS Mapping of Landslide-Prone Zones
Moreover, GIS Mapping of Landslide helps identify critical villages and infrastructure at risk by layering spatial data, defining buffer zones, and analyzing proximity to hazards. Thanks to tools like advanced filters and buffer analysis available on MAPOG, users can now transform raw data into compelling public visual stories. As a result, this not only aids disaster management authorities but also empowers planners to act proactively. Furthermore, buffer zones, layer filters, and custom styling options make the process practical and accessible, even for semi-technical users.
Step-by-Step Process to Perform GIS Mapping of Landslide and Access Roads
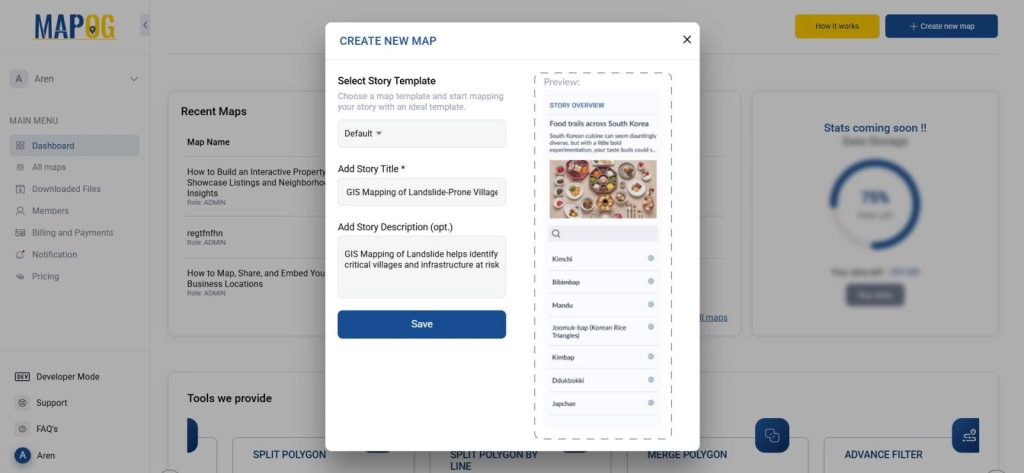
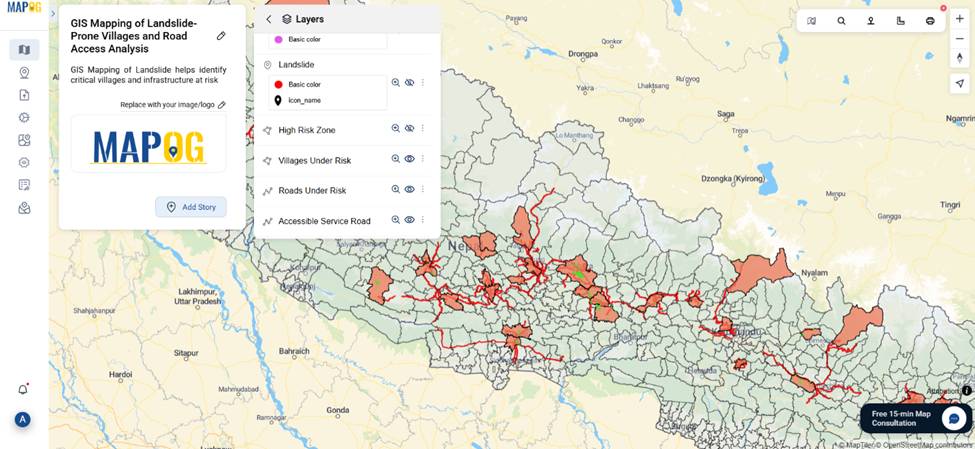
1. Start Your Map Story
- Head over to MAPOG and create a new story.
- Add suitable tittle and description that describe the goal of your map.
2. Add Base Layers: Administrative Boundaries and Roads
- Use the GIS Data Library to add administrative boundaries, roads, and service roads.
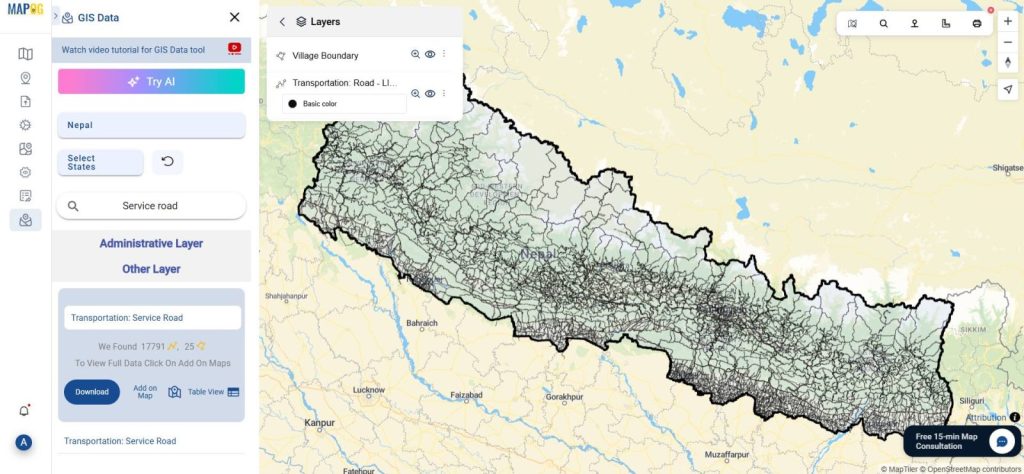
- Rename the layers meaningfully and apply distinct colors using the Style Layer tool.
3. Upload Landslide Point Data
- Use the Upload Vector File from Add/Upload Data option to import landslide-prone location points (in formats like SHP or GeoJSON).
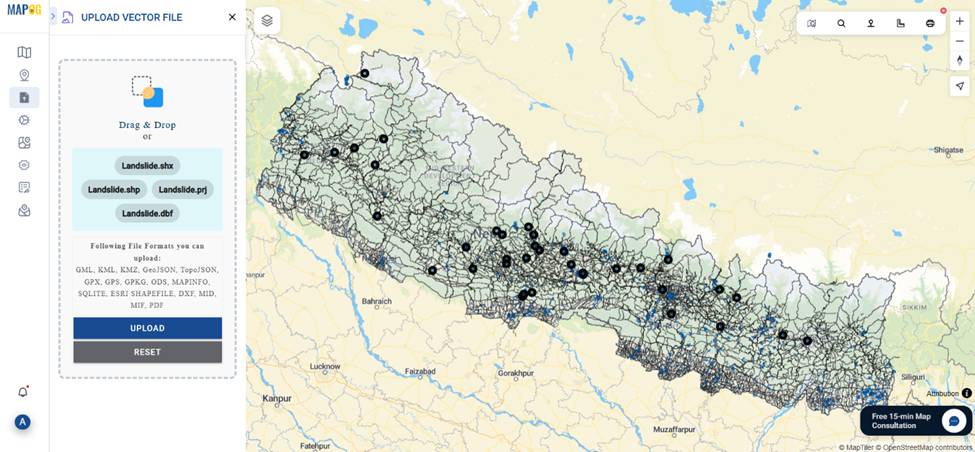
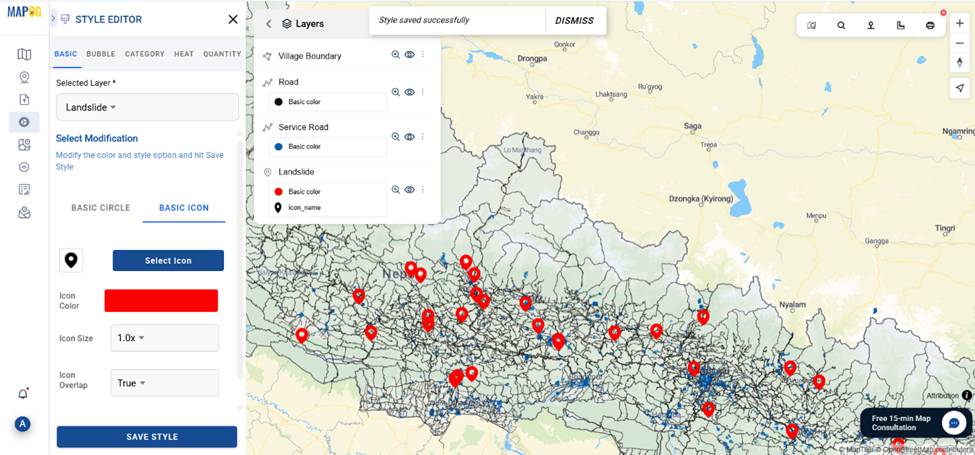
- Style the landslide points with red or hazard-specific markers for better visibility.
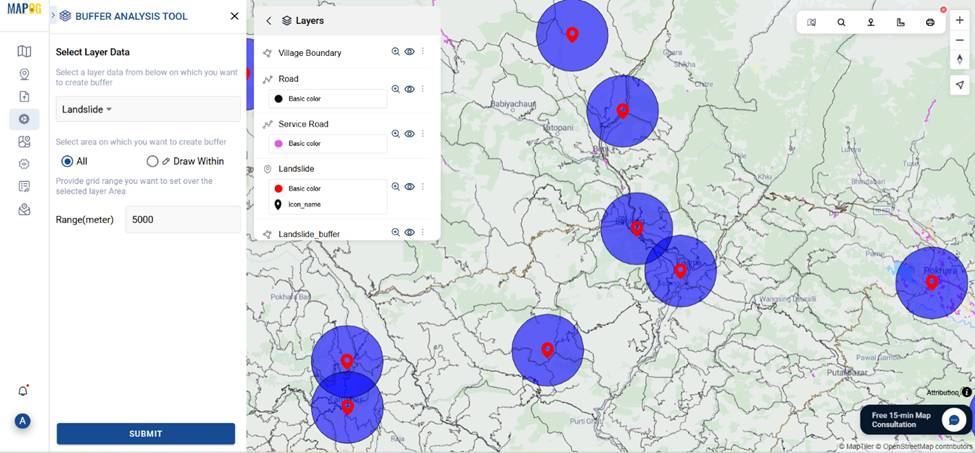
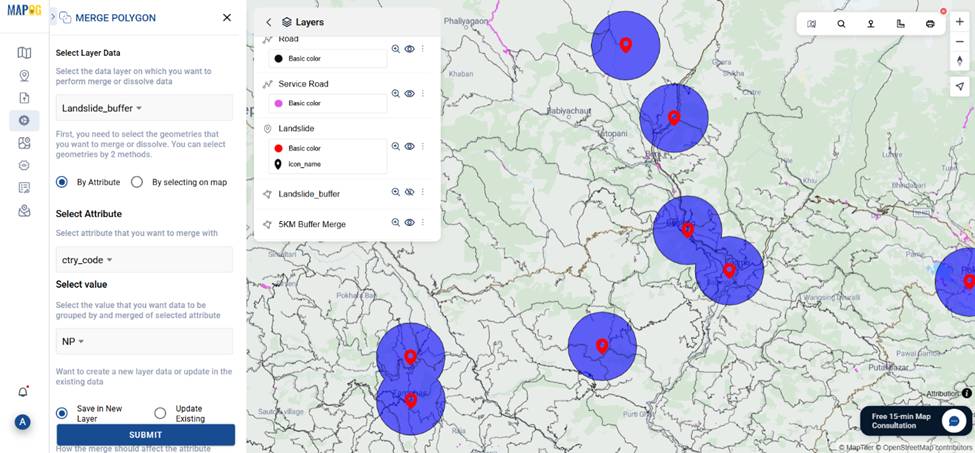
4. Create Risk Zones Using Buffer and Merge Tools
- Use the Buffer Tool, select all landslide points and set a 5KM parameter buffer zone around the landslide area.
- Next, apply the Merge Tool, select buffer zones and by attribute merge them to unify overlapping buffer zones into High-Risk Zone area.
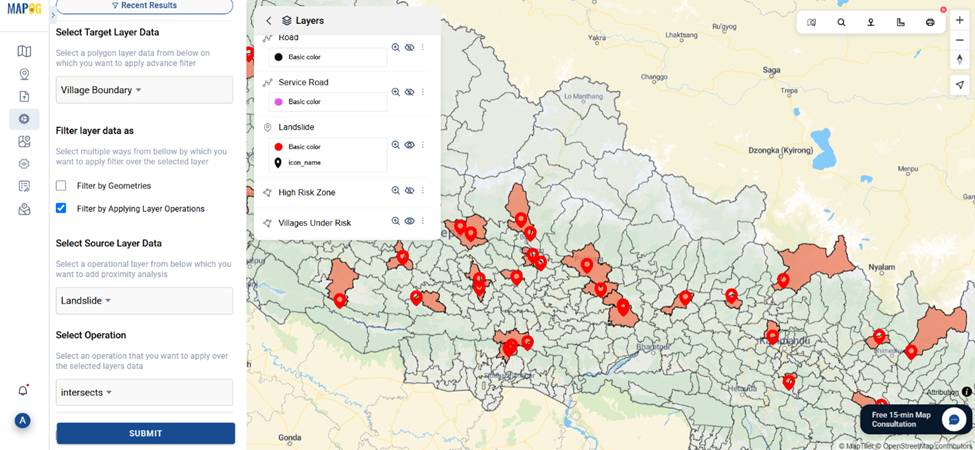
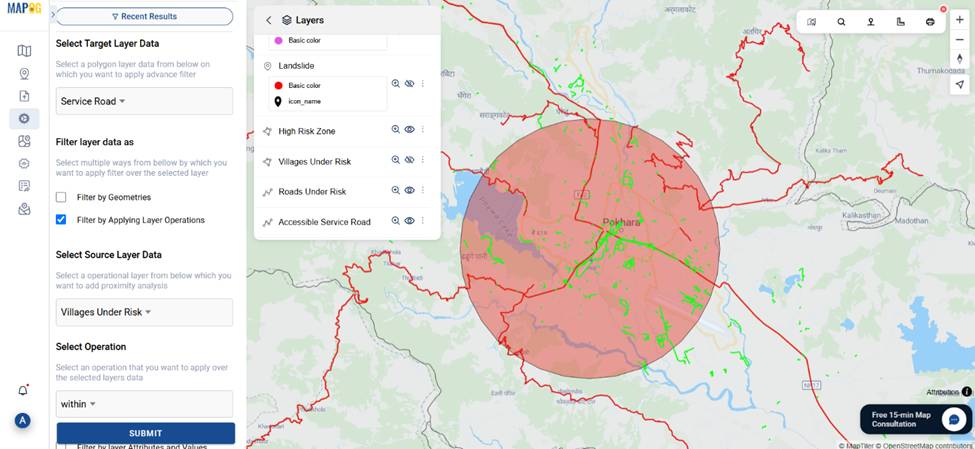
5. Filter High-Risk Villages
- Open Advanced Filter Tool.
- Select “Village Boundary” as the target, then click on Filter by Applying Layer Operations. “Landslide” as the source layer, and apply an “intersects” operation, then submit.
- Click publish to highlight villages under direct risk.
6. Analyze Roads and Alternate Access Routes
- Similarly, apply filtering on roads and service roads to identify routes within risk zones.
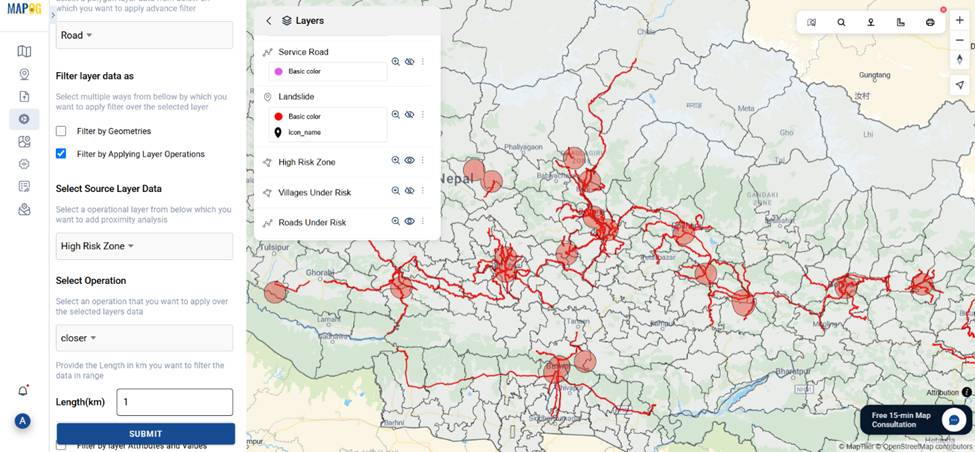
- Use service roads in risk-prone villages as emergency alternates when main routes are compromised.
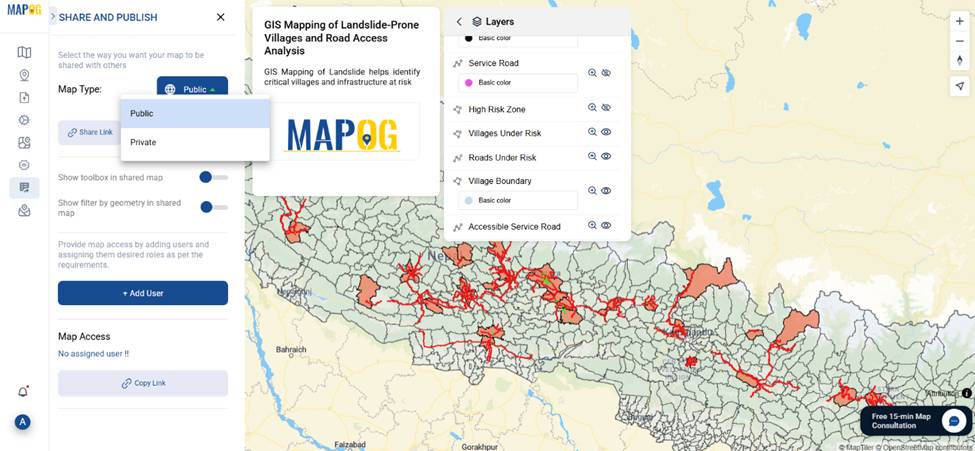
7. Preview, and Share Your Map
- Use Preview and Share to publish the story publicly. Copy the link and share with planners or the local community.
Industry Use Cases and Practical Benefits
In addition, in sectors such as disaster management, rural development, and transportation, the application of GIS Mapping of Landslide contributes greatly to:
- Firstly, prioritizing village evacuations
- Secondly, planning road reinforcements
- Thirdly, allocating emergency supplies efficiently
- Finally, strategically positioning rescue routes
Notably, using MAPOG, professionals can build interactive maps without any coding knowledge. Simultaneously, communities can access and comprehend risk information with ease. Thus, this approach bridges the gap between experts and the general public.
GIS Data Used
Conclusion
GIS Mapping of Landslide-prone villages and road networks is no longer a task reserved for experts. With MAPOG that offer tools like merge polygon, advanced filtering, and buffer analysis, this essential work becomes visual, collaborative, and highly actionable. Whether you’re a planner, academic, or NGO worker, this method ensures your spatial decisions are backed by data and clarity.