In today’s logistics-driven world, Geographic Information Systems (GIS) play a pivotal role in analyzing spatial data for informed decision-making. Fortunately, MAPOG offers Free GIS Mapping Tools that empower students, researchers, and planners to explore and visualize real-world location-based patterns.
With tools such as Buffer Zones, Clip and Isochrones, users can easily identify optimal sites for development projects. For example, one practical application includes locating the most suitable site for a cargo Warehouse Terminal, based on both airport proximity and travel time.
Key Concept: Free GIS mapping tools
Free GIS mapping tools provide valuable spatial insights by highlighting how distance and time influence logistics decisions. By identifying zones within 5 km of airports and reachable in under 60 minutes, users can optimize warehouse placement, streamline transportation, and improve supply chain efficiency for better planning and real-world infrastructure solutions by using GIS tools.
Educational Uses of MAPOG: Free GIS mapping tools
Additionally, MAPOG supports practical learning in classrooms through interactive GIS applications.
- Skill Development: Students apply tools like buffers and isochrones directly.
- Visual Thinking: Spatial data becomes easier to interpret.
- Team Collaboration: Projects become more engaging and analysis-driven.
- Real-World Relevance: Students connect theory to infrastructure and supply chain challenges.
Thus, GIS-based education becomes not only relevant but also fun, actionable, and collaborative.
Methodology: Using Free GIS Mapping Tools with MAPOG
Project Focus: Finding Ideal Cargo Warehouse Locations Based on Spatial and Temporal Factors
1. Access Airport Data from GIS Data Library
- First, go to MAPOG, start a new story, and give it a relevant name.
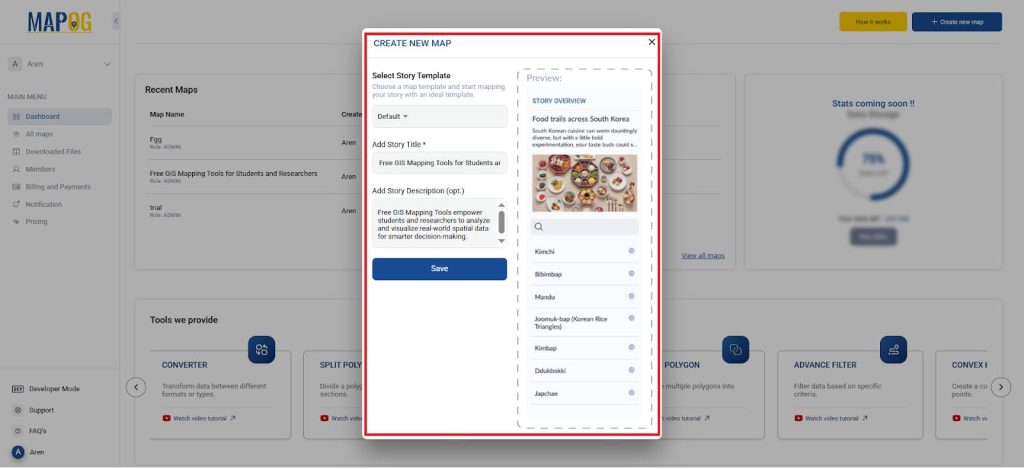
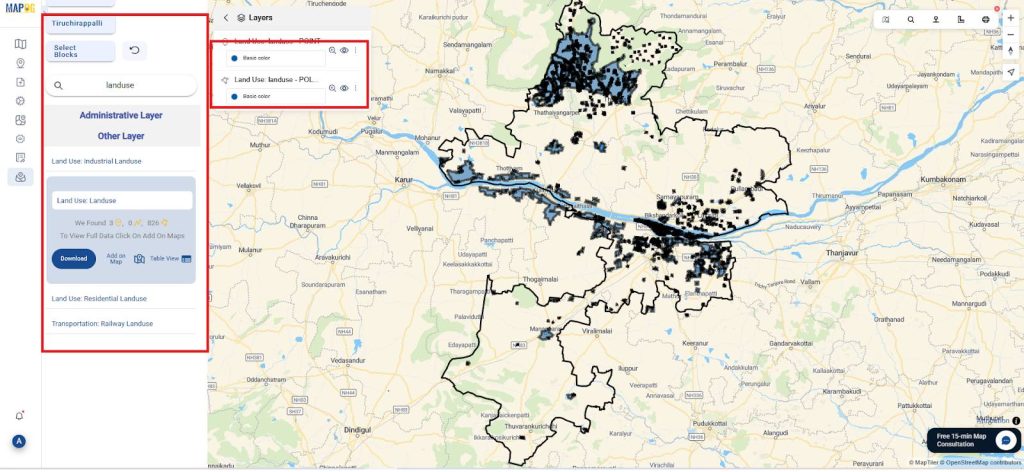
- Then, open the GIS Data Library, select the target country >> state >> district, and load the data like “Transportation: airport” layer, “Land Use: land” and existing warehouse locations.
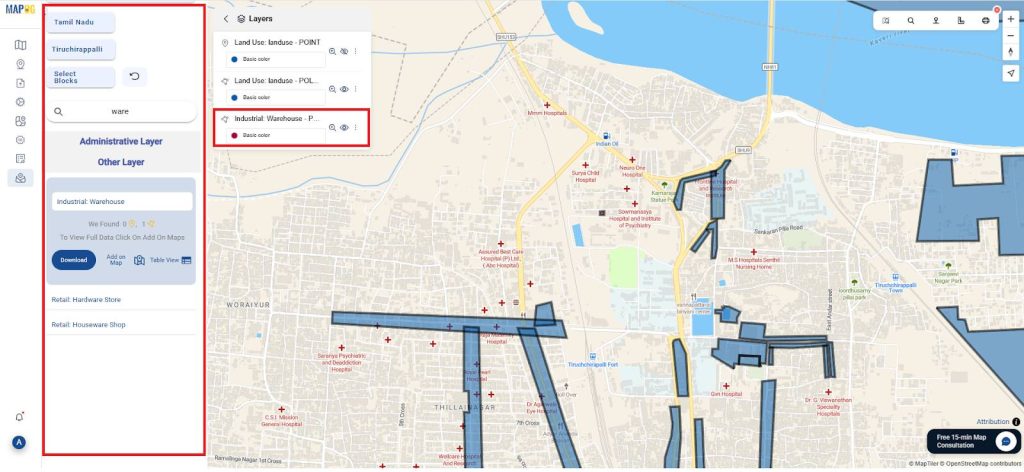

- Finally, this ensures immediate access to accurate, ready-to-use data.
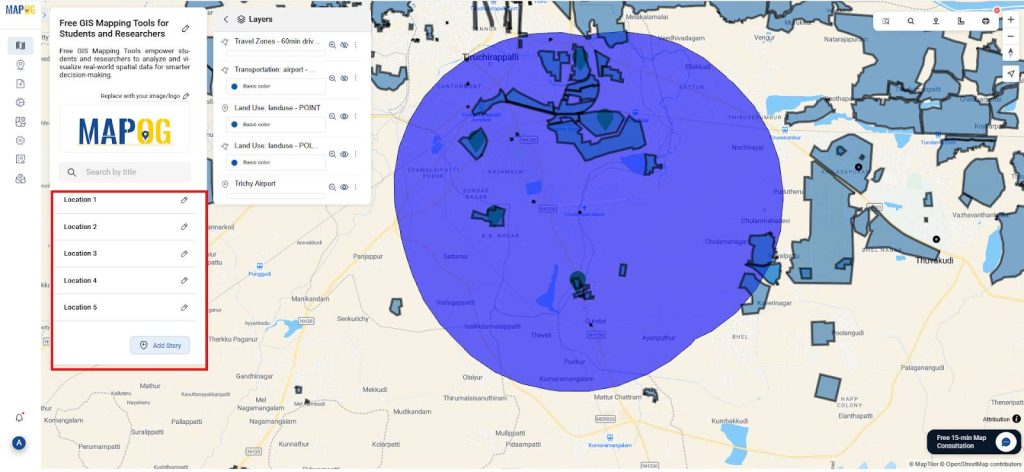
2. Buffer Tool: Define 5 km Radius Zones
- Next, apply the Buffer Tool from the Process Data to create 5 km zones around each airport.
- Label them as “Airport Proximity Zones.”
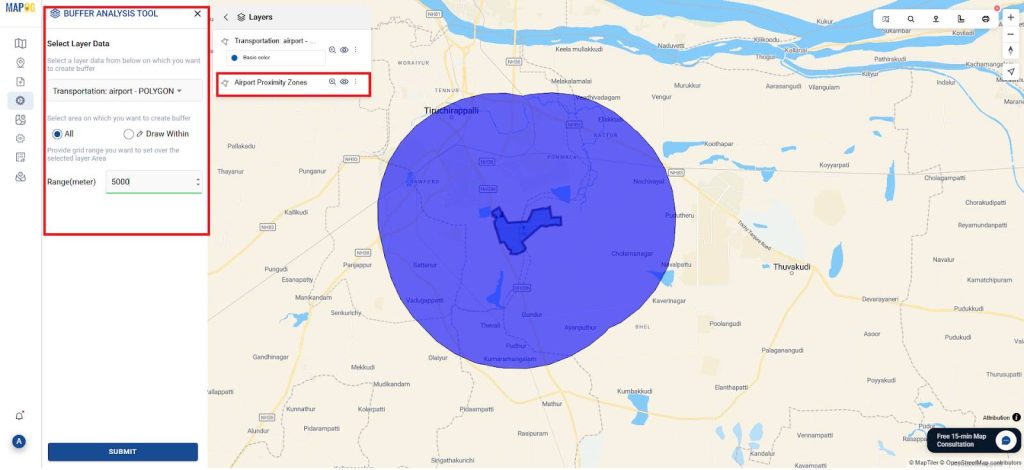
- These highlight locations that are physically close critical for time-sensitive logistics.
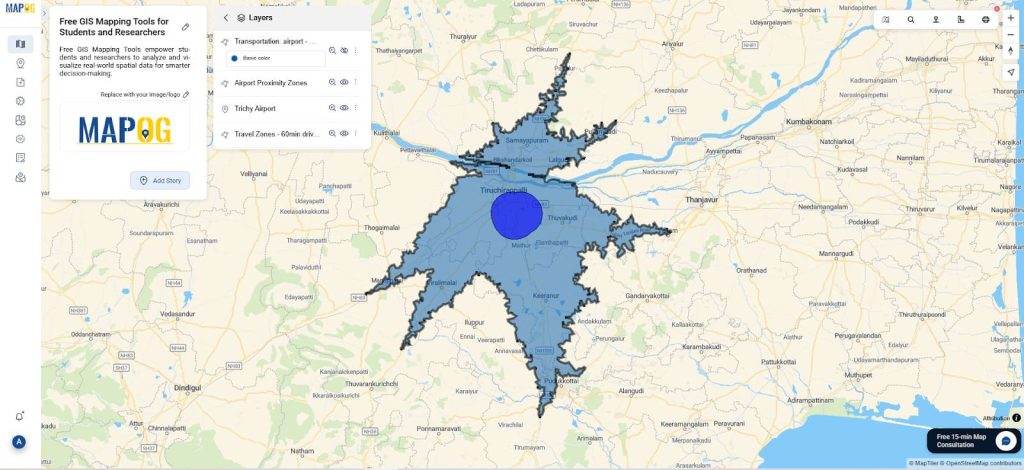
3. Isochrone Tool: Map 60-Minute Reachable Areas
- Additionally use the Isochrone Tool from process data to map 60-minute drive zones from airports, then label them as “Travel Zones.”
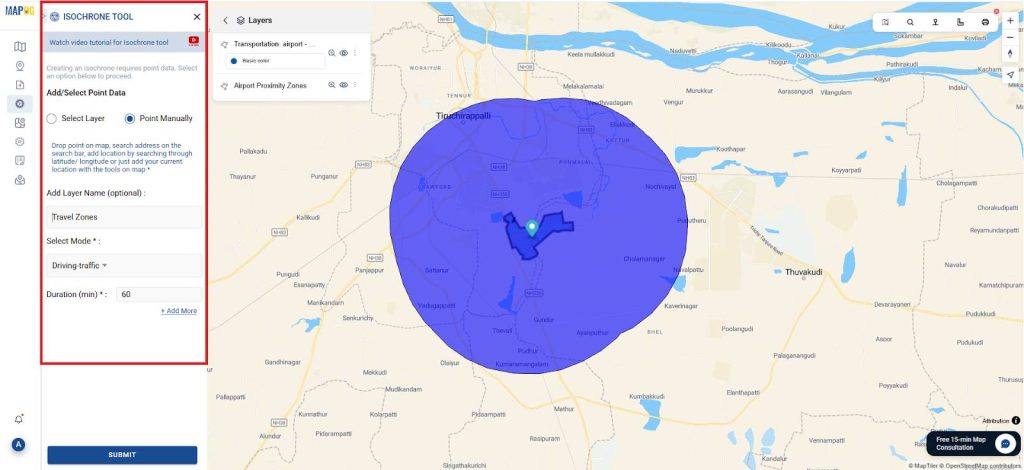
- Consequently, poorly connected areas are excluded, increasing accuracy.
4. Clip Tool: Using Buffer and Isochrone Layers
Now, overlay both layers to generate a composite map
- The resulting areas: Lie within 5 km of an airport and are reachable within 60 minutes by road.
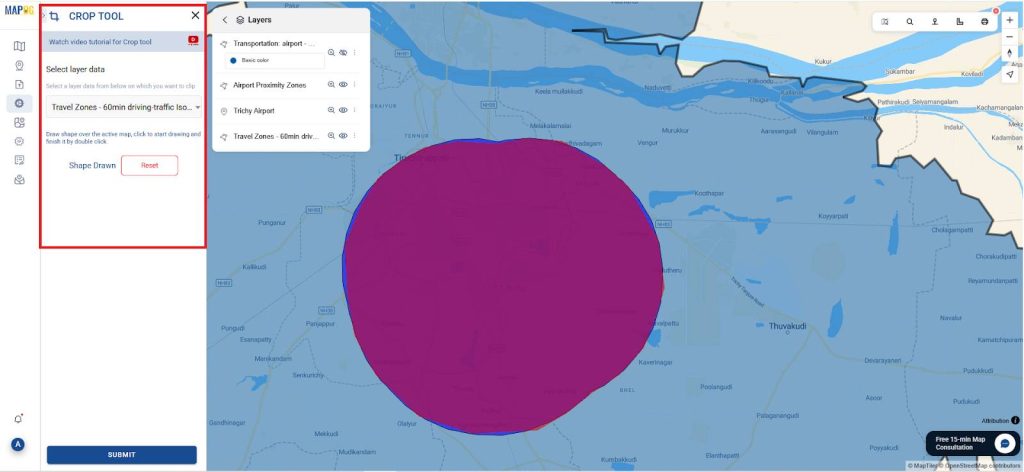
- Then clip the data by using clip tool in process data by manually drawing the layer as shown and save it as the “Overlapped Zoned”.
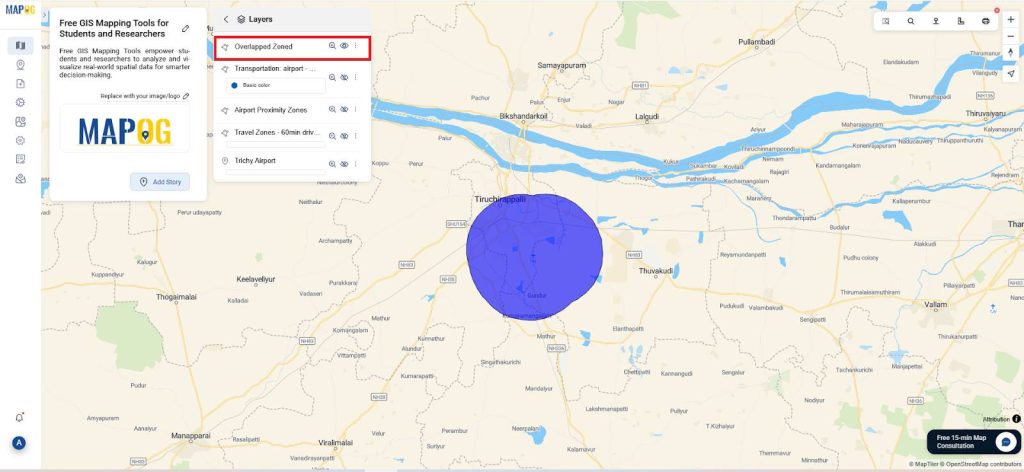
- Therefore, these overlapping zones represent approximate ideal locations for warehouse development.
5. Find locations for Warehouse
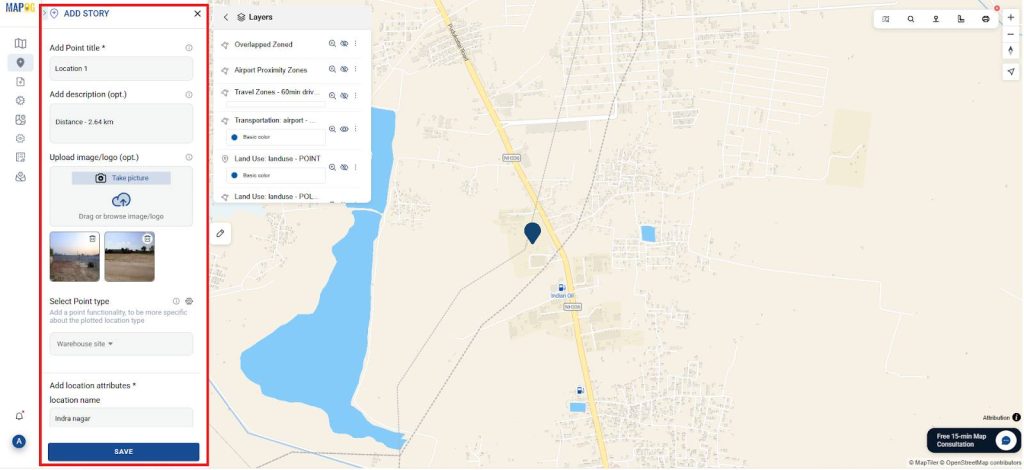
- Manually select 5 locations, mark them as Warehouse points in “Add Story,” and add attributes like name, photos, area (sq.ft), and distance from the airport.
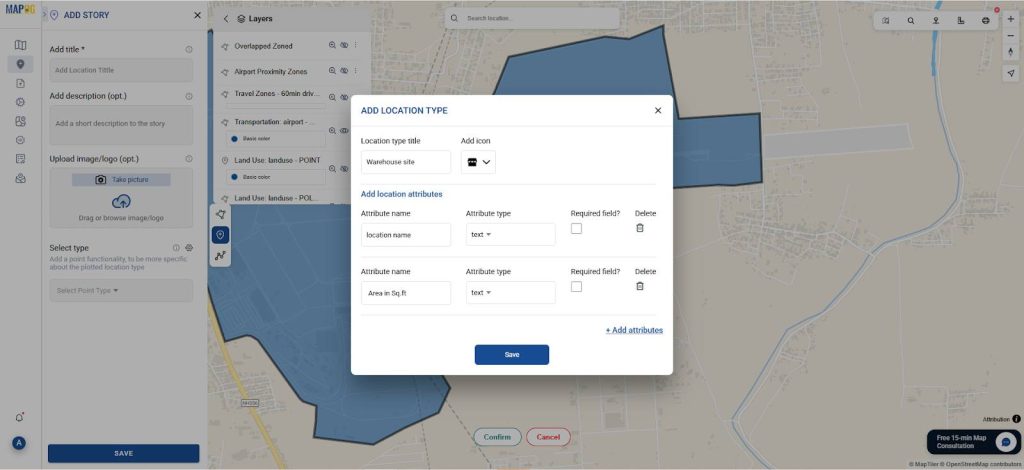
- Then add point tittle, a little description & images to give this location a value.
- Then, use the distance tool from toolbox to measure from the airport to each location.
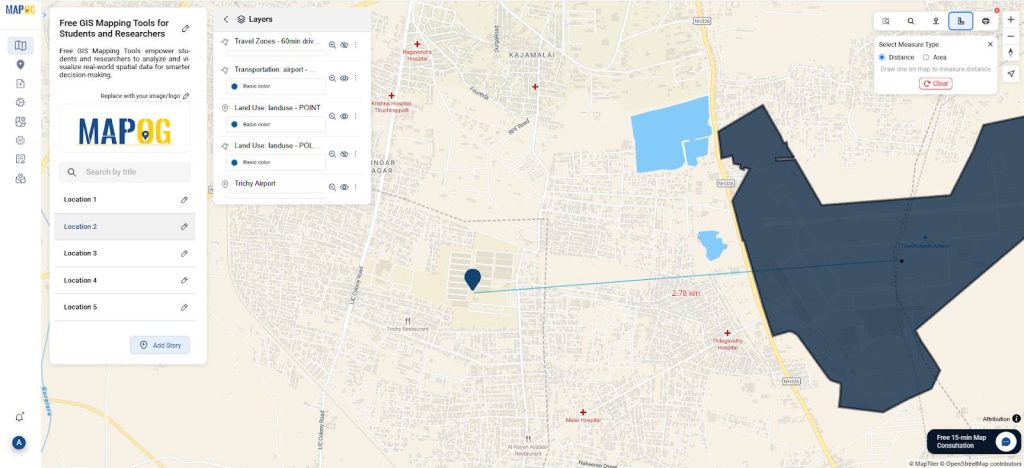
- Similarly using the land use data and the overlapped data we can find locations.
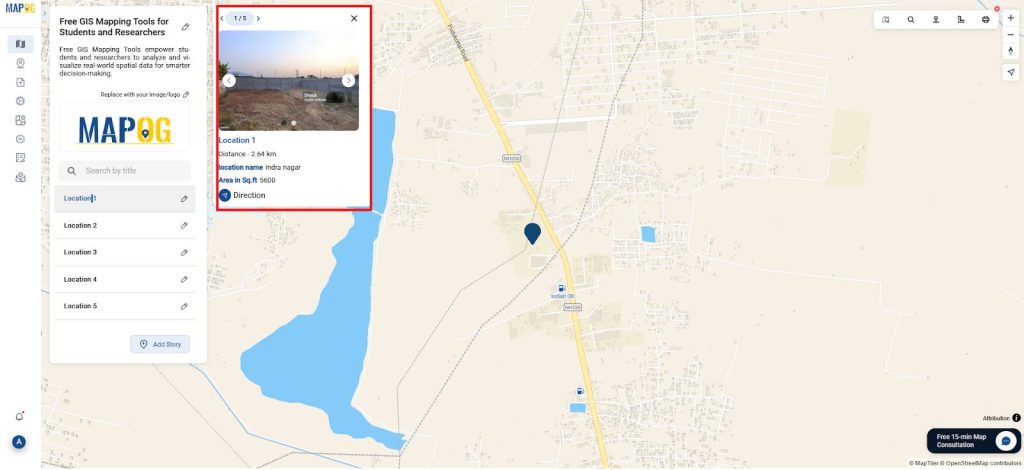
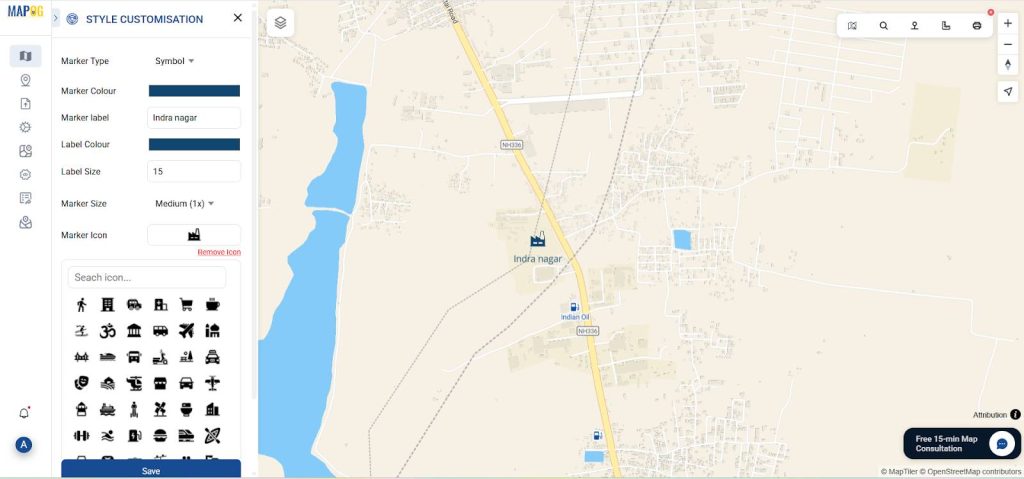
- Then, use point customization to add icons and labels for a visually appealing map.
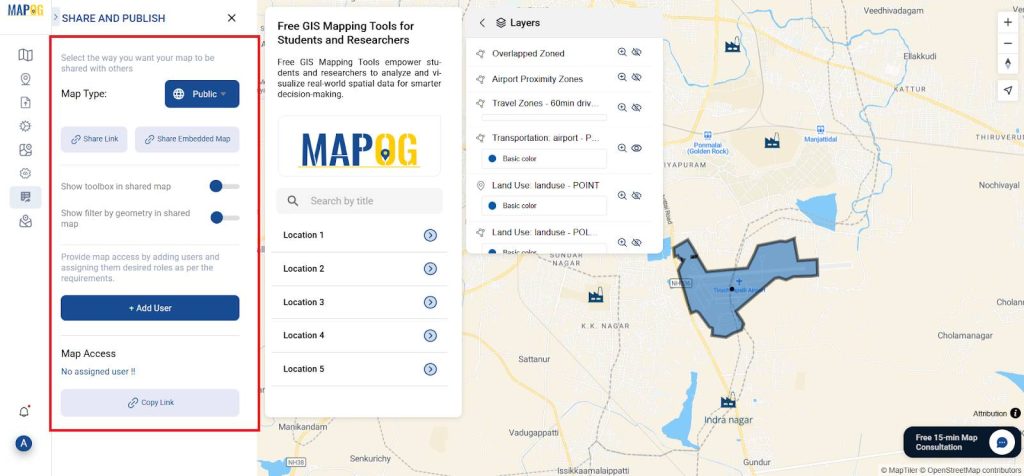
6. Share and Present Your Findings
- As a result, use MAPOG’s “Publish & Share” feature to create an interactive link or embed the map in your report.
GIS Data Used
Multidisciplinary Insights for Logistics and Planning
As a result, combining buffer and isochrone tools, GIS offers valuable insights for supply chain, logistics, and infrastructure. It supports urban planning, transport geography, and environmental studies, enabling cross-disciplinary collaboration.
Conclusion
Therefore, to conclude, MAPOG’s free GIS tools allow students and researchers to solve real-world logistics challenges with ease. Through simple steps accessing data, applying tools, and overlaying results—users define optimal zones based on both spatial and temporal precision.
Ultimately, platforms like MAPOG turn geographic data into practical, visual solutions.
Finally, several studies referenced in this context employed MAPOG