MAP STORY

Interface showing customer data points segmented and filtered instantly using dynamic filters, with color-coded clusters for real-time insights

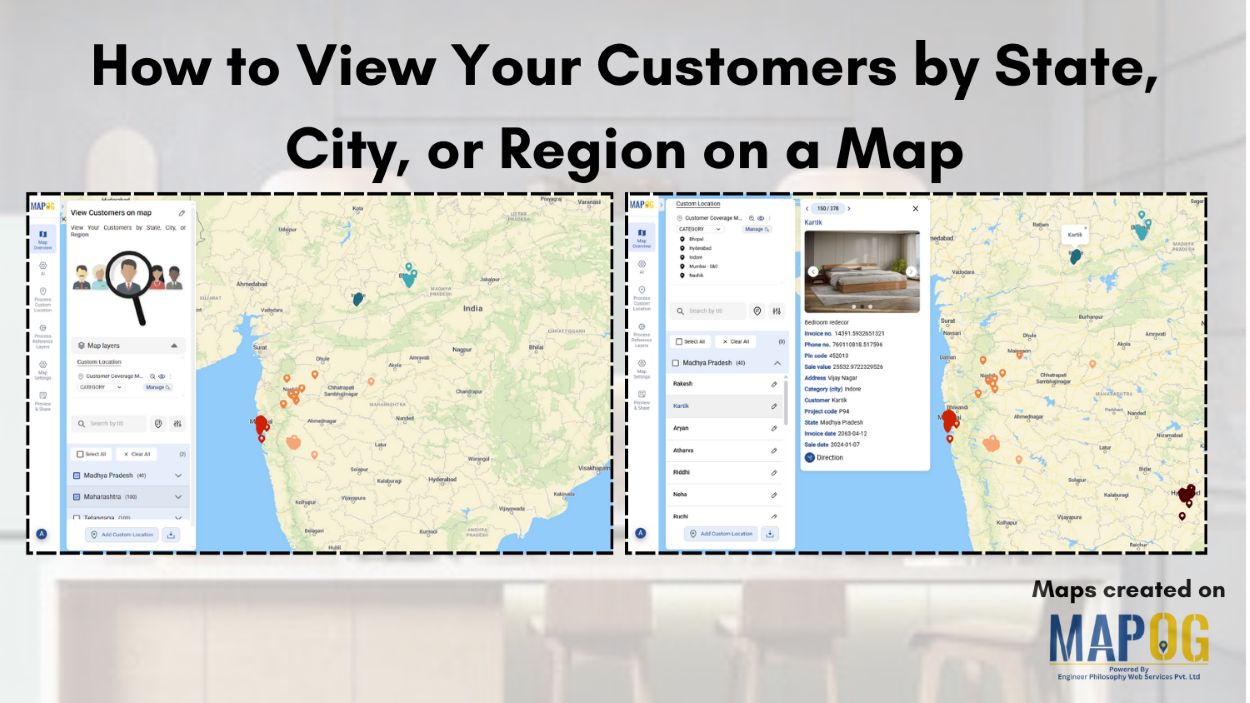
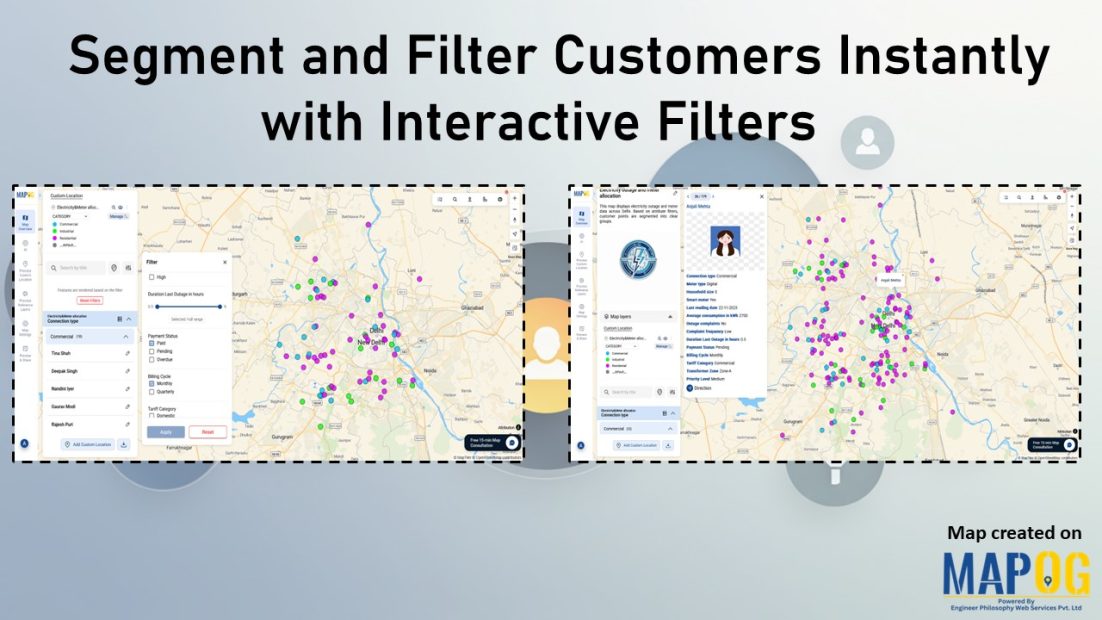
Segment and Filter Customers Instantly with Interactive Filters

Most teams already have customer data, but the way it’s managed often hides the details that matter. Consequently, diverse attributes collapse into uniform rows, obscuring meaningful distinctions. As a result, strategies become generic, and critical signals stay hidden. However, static reports flatten complexity, leaving no room for precision. With MAPOG, teams can segment and filter … Read more

Export Your Map with All Data and Details Intact (GeoJSON, SHP, CSV)

Export Your Map with All Data and Details Intact (GeoJSON, SHP, CSV)

In mapping and spatial data, live interactive maps are incredibly powerful; however, there are times when offline access becomes essential. That’s why MAPOG lets you export your map seamlessly, ensuring all data and details remain intact. As a result, you can analyse, present, or share your information with your team without losing any important elements. … Read more

edit update points

Import Customer Feedback and Ratings into an Online Mapping Tool

Customer data often comes in spreadsheets filled with names, addresses, coordinates, and feedback—but viewing such information in raw tables can limit insight. By importing this data into MAPOG, additionally visualize customer locations, projects or buildings ratings, or import customer feedback into online mapping tool and reviews directly on an interactive map. This not only makes … Read more

tracking customer

How to track customer visits without calling the team again and again

Many organizations struggle to keep track of customer visits without calling in real time zones  , which often leads to repeated phone calls, confused updates, and inefficient coordination. As a result, teams end up relying on scattered verbal reports, causing delays, and inconsistent follow-ups. Consequently, managers find it difficult to monitor field activity, assign tasks, … Read more

Cover image

How to Combine All Customer Data from the Field Into One Clean Map

To combine all the customer data from the field is a common challenge for organizations. Teams collect location details, service feedback, and on-site observations through a mix of mobile apps, paper forms, and spreadsheets, but this mix of formats often leaves the data scattered and hard to interpret.  A unified map solves this problem by … Read more

Cover Image

How to Plot Multiple Locations from an Excel Sheet on a Map

If you have ever managed an extensive list of locations in an Excel sheet — such as customer addresses, store locations, survey sites, or well coordinates — and wanted to represent them spatially, you are not alone. Visualizing location-based data on a map enables you to clearly understand the spatial distribution, relationships, and patterns that … Read more

Showing color-coded customer survey points with a data table and field surveyor visuals in the background, illustrating how to provide maintenance to customers area-wise using field surveys

How to Provide Maintenance to Customers Area-Wise Using Field Survey Map

Many organizations struggle to identify where maintenance issues arise and how they spread across neighborhoods. As a result, teams often rely on scattered reports, which in turn cause delays and uneven service. Consequently, it becomes difficult to provide maintenance to customers consistently across all areas. However, by integrating structured field surveys with MAPOG , teams … Read more

Image showing customer coverage map across multiple branches using colored pins and branch-level data.

How to Compare Customer Coverage Across Multiple Branches

When managing multiple branches, one persistent challenge is the lack of clarity around how customer coverage compares from one location to another. As a result, teams often struggle to make informed decisions. Without a structured way to compare customer coverage across multiple branches, they may rely on assumptions rather than spatial evidence. MAPOG helps solve … Read more

How to View Your Customers by State, City, or Region on a Map

How to View Your Customers by State, City, or Region on a Map

Ever wondered which areas your customers come from or where your business is growing the fastest? Visualizing customer locations on a map can turn raw data into clear, actionable insights. With MAPOG, you can easily map and view your customers by state, city, or region, giving you instant insights into geographic trends and market potential. … Read more

Cover image with article title and MAPOG screenshots showing customer location assignments to field teams.

How to Assign Customer Locations to Field Teams for Surveys

Efficient field surveys start with a clear plan, so you need a simple and accurate way to assign customer locations to field teams. When each member knows where to go, your operations move faster, data quality improves, and field time decreases. This structured approach strengthens tracking, balances workloads, and improves coverage. You can manage all … Read more