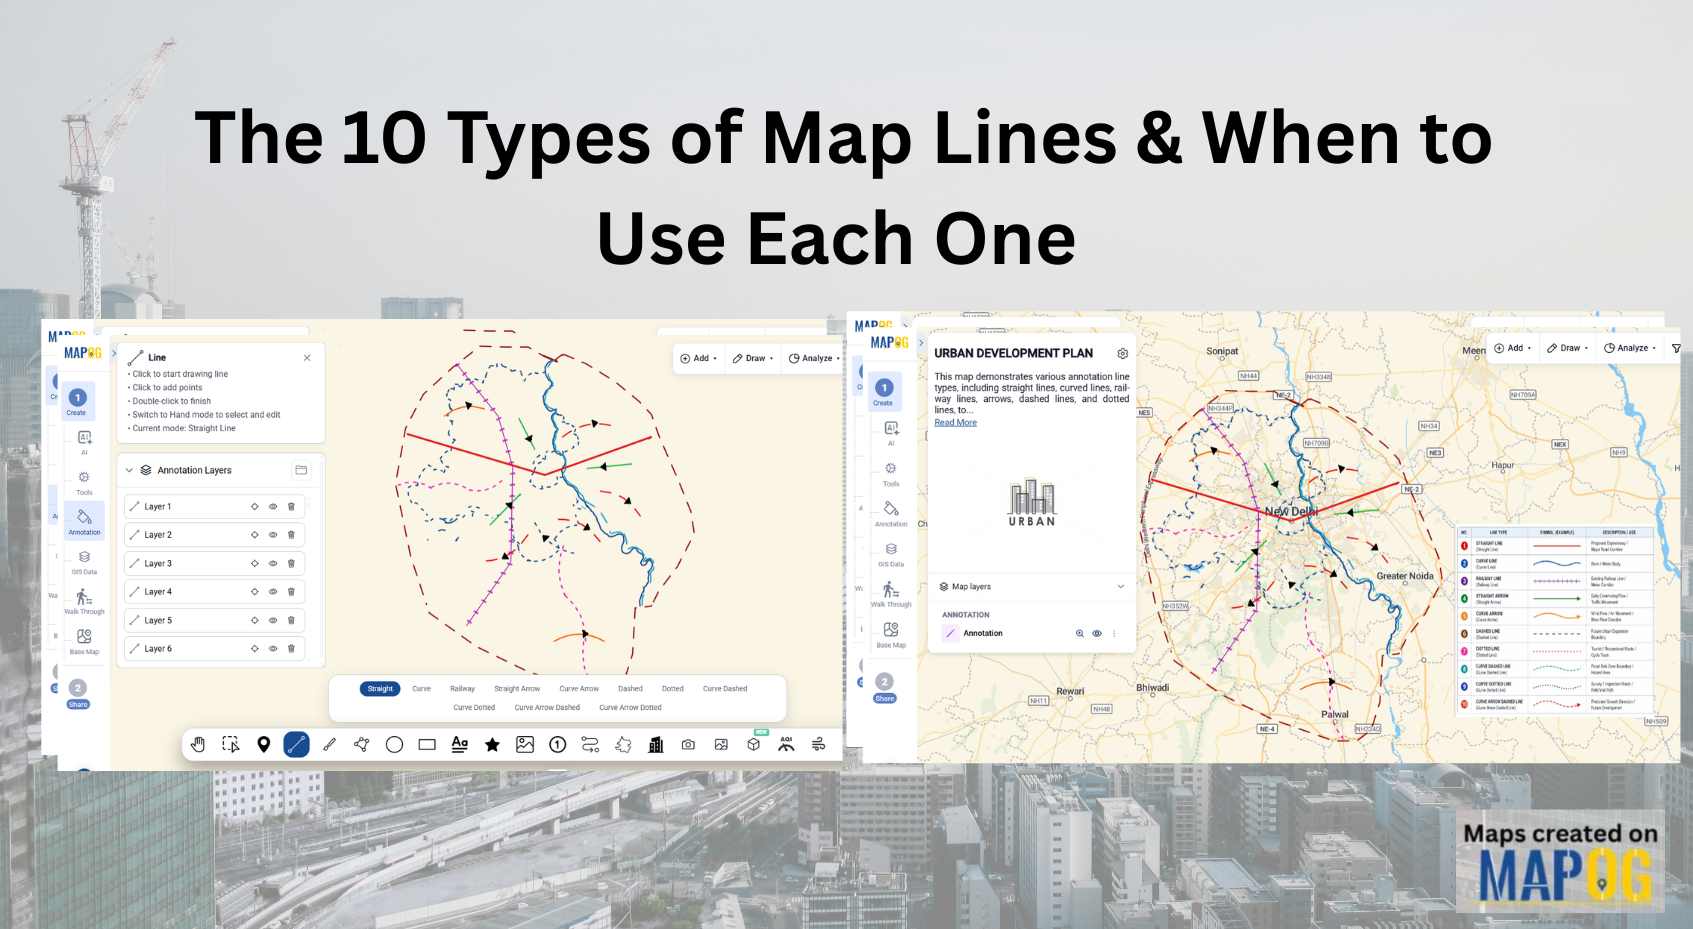
Types of map lines are essential for clearly representing geographic features. Moreover, they help organize complex spatial information into a clear and readable map. For example, If you have ever struggled to explain roads, railway corridors, planning boundaries, rivers, movement patterns and travel routes on a single map without creating visual clutter. Furthermore, in urban planning, transportation, environmental management, and GIS projects, choosing the right map line improves the communication of spatial information and makes maps easier to understand.
With MAPOG‘s annotation tools, you can create different types of map lines, including straight lines, curved lines, railway symbols, arrows, dashed boundaries, and dotted routes. These annotation styles help you create interactive maps that are easier to analyze, present, and share.
Key Concepts of types of map lines
- Improve Clarity : Make maps easier to read and interpret. Similarly, differentiate geographic features using unique line styles.
- Represent Features : Visualize roads, railways, rivers, boundaries, and routes. Clearly separate different types of infrastructure.
- Communicate Spatial Data :Simplify complex geographic information. Improve understanding through visual representation.
- Support Planning : Present infrastructure projects and development plans. Display environmental zones and transportation corridors.
How to Create 10 Different Map Lines in MAPOG
MAPOG provides an intuitive platform for creating interactive maps with customizable annotation tools. Follow these steps to build professional annotation maps.
Step 1: Create a New Project
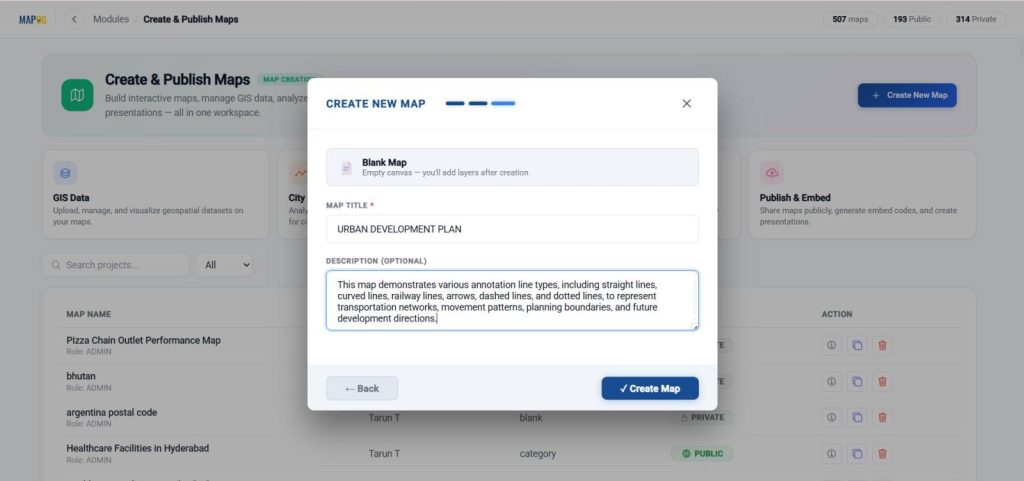
Firstly, go to MAPOG and click Create & Publish Map.

Next, select Create New Map, choose the blank map template.

After that, enter your project name and description, and click create map to Save the map.
Once the map is created, go to the map settings and upload map logo.
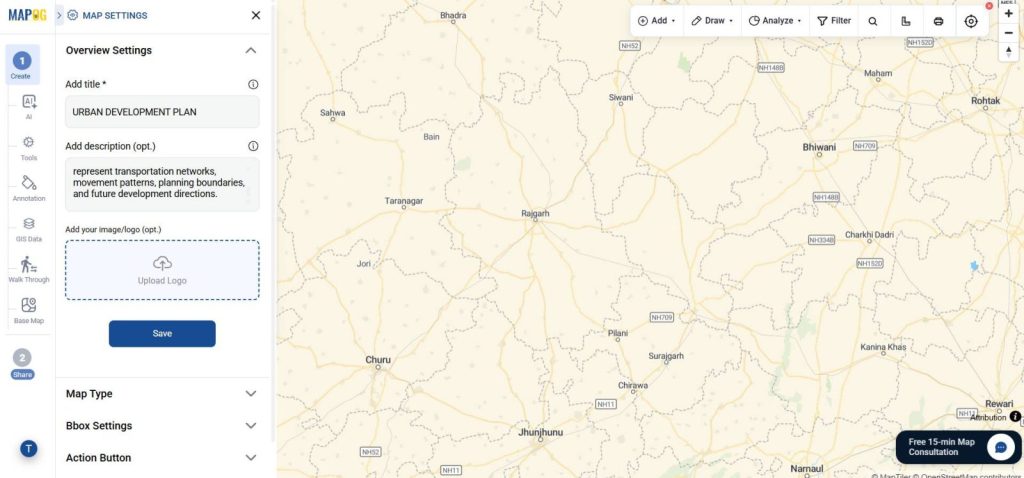
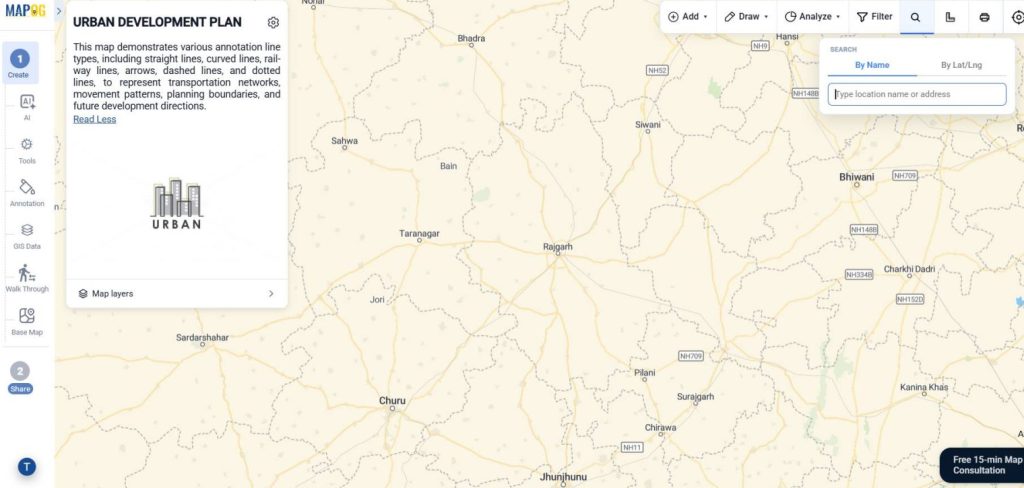
Search for the location you want to visualize by entering its place name or latitude and longitude coordinates.
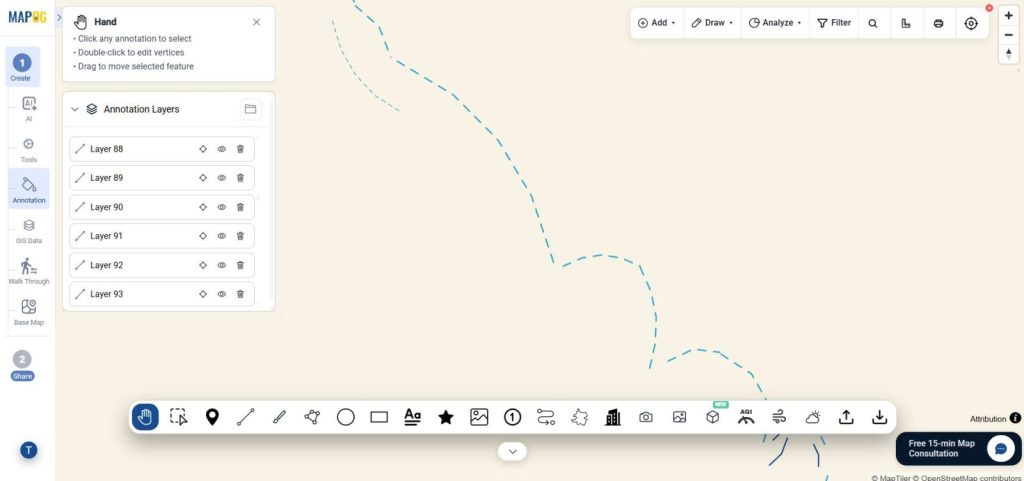
Step 2: Add Map Lines Using Annotation tool
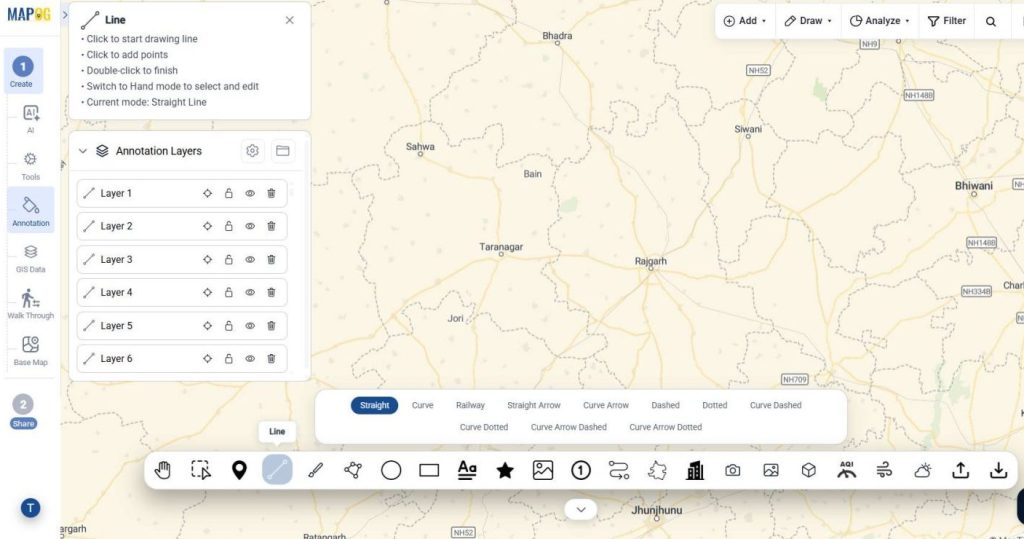
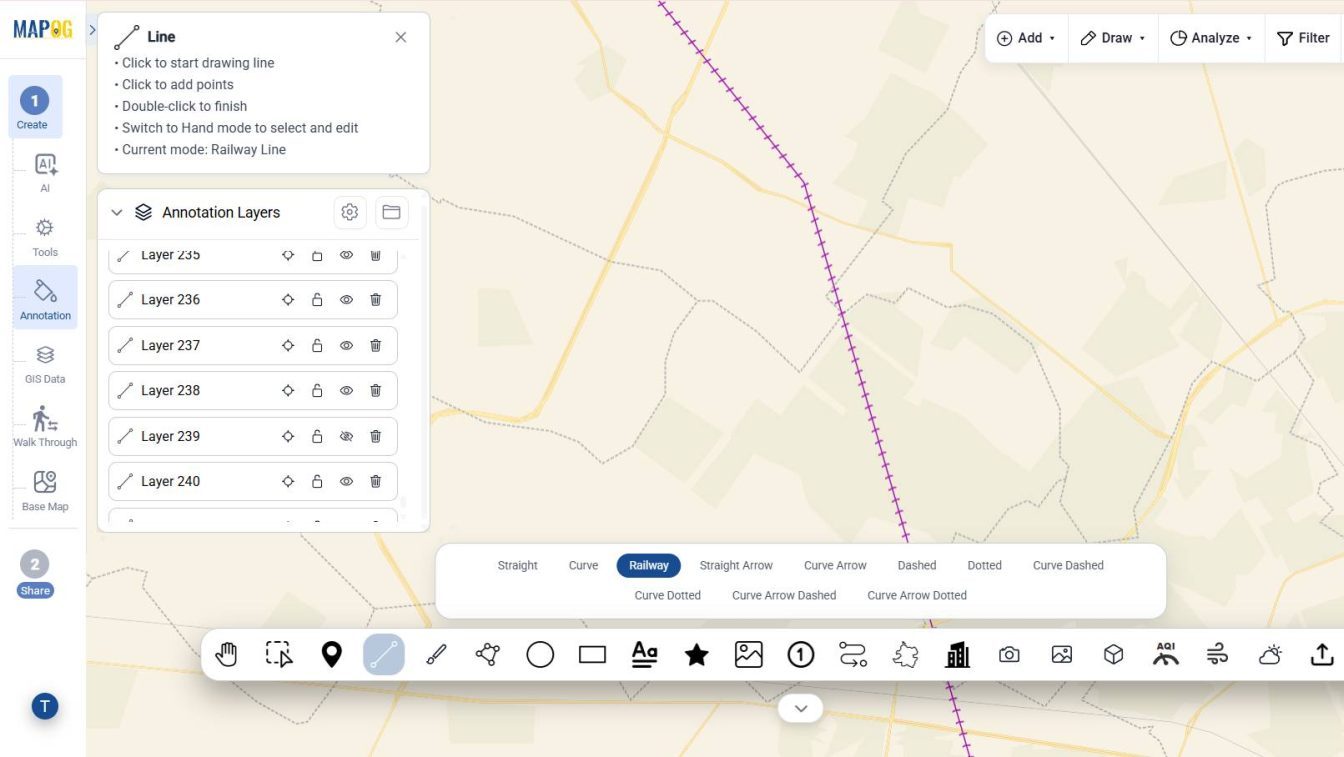
Click Annotation, then select Line and choose the desired annotation type.
For every annotation:
- Click on the map to begin drawing.
- Click again to add points along the path.
- Double-click to finish drawing.
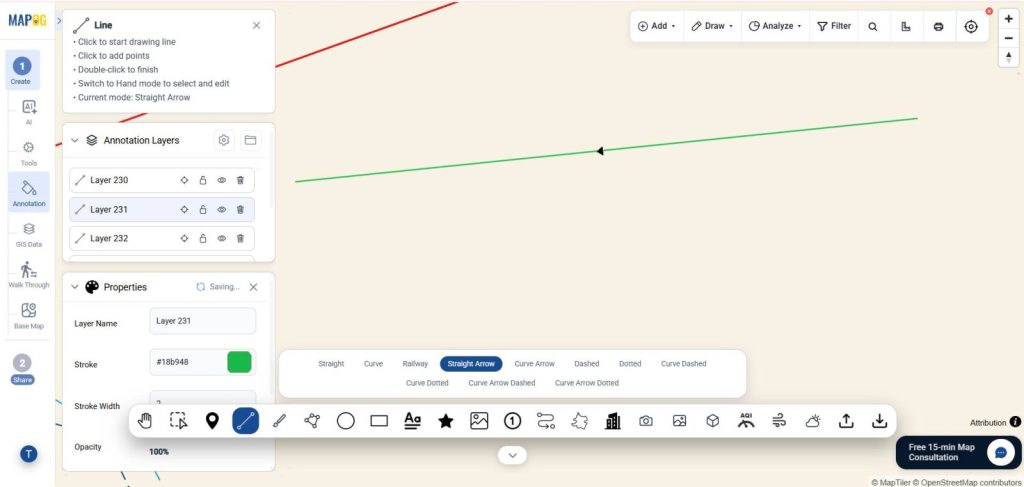
- Afterward, Open the Properties panel to rename the layer and customize its color, stroke width, opacity, and style.
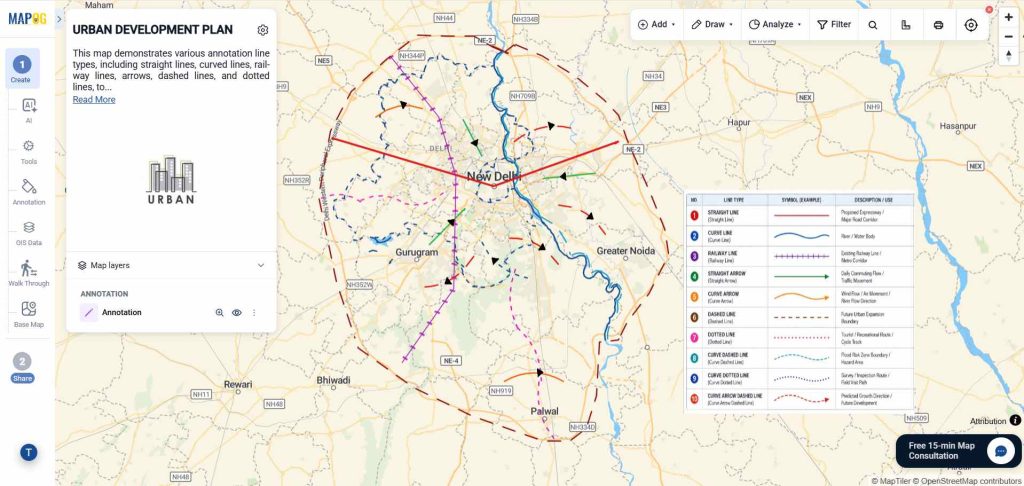
Types of Annotation Lines
Dashed Line
For instance, a Dashed Line is commonly used to define planning boundaries, administrative limits, or proposed urban development zones. Displaying it in brown makes planning areas easy to identify.
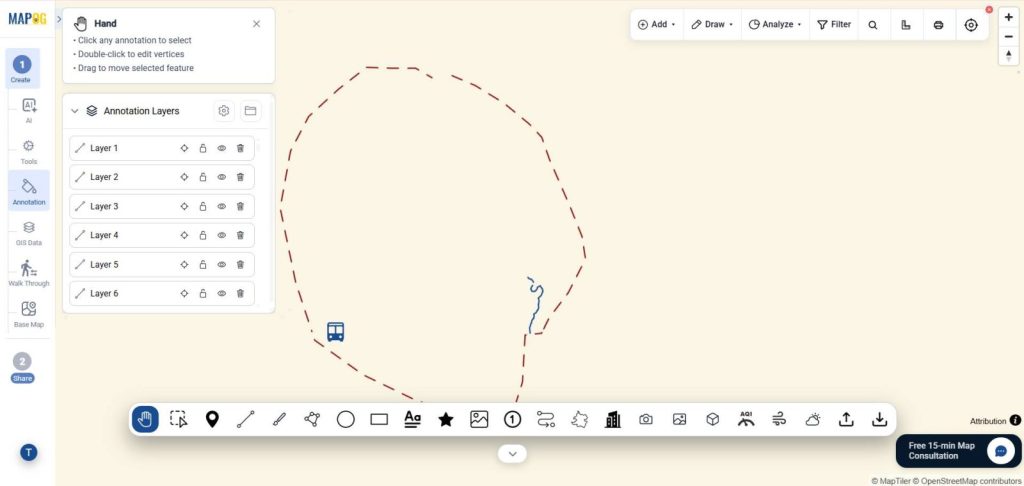
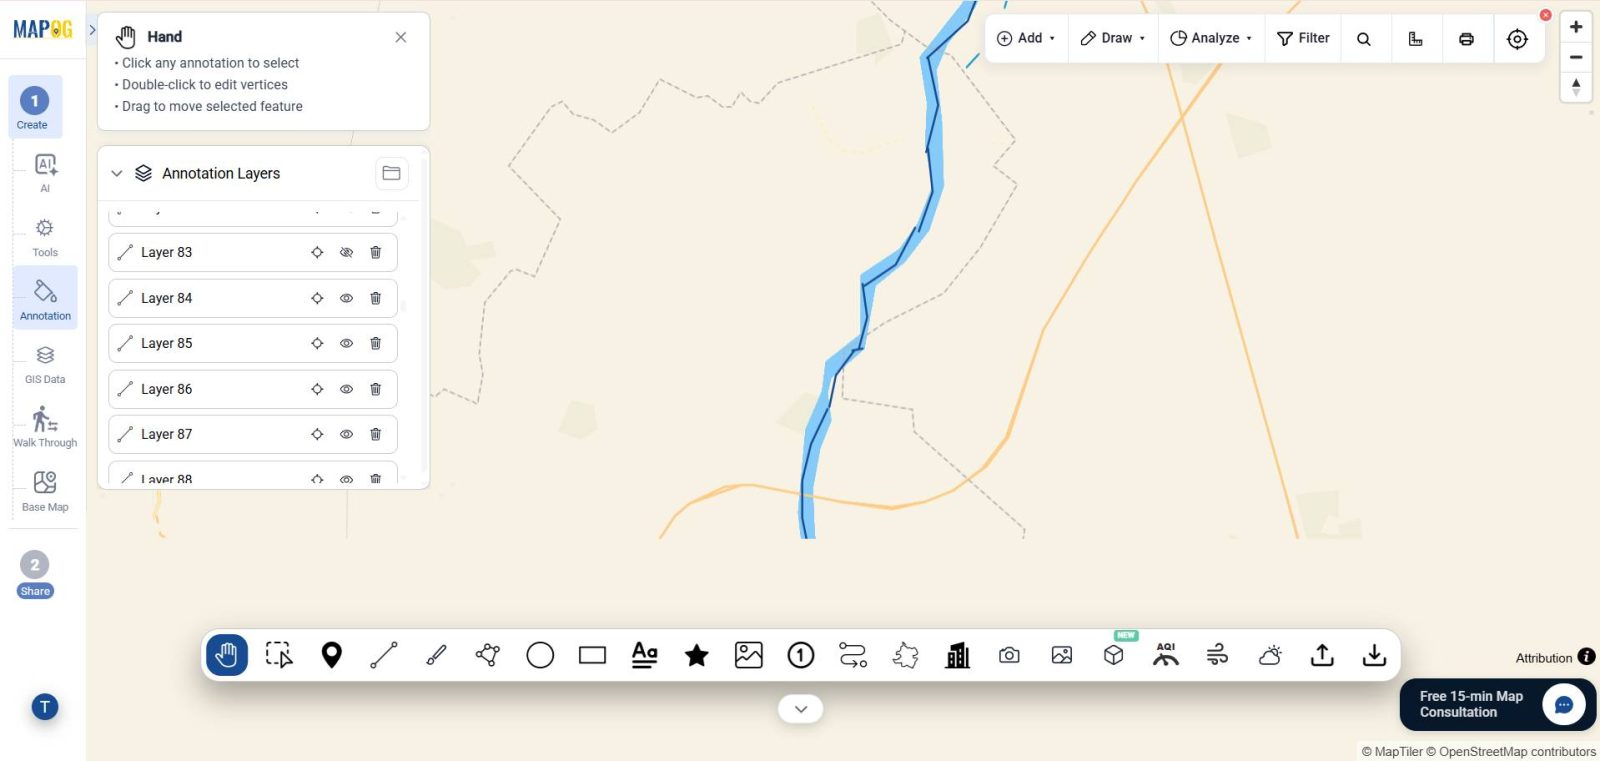
Curved Line
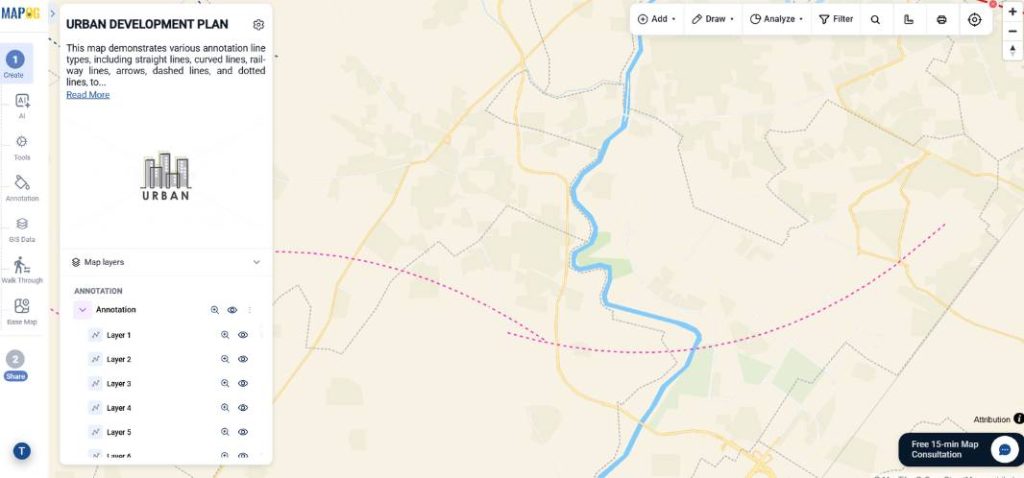
Likewise, a Curved Line creates smooth paths that follow natural geography. It is ideal for representing rivers, streams, or irregular geographic features such as the Yamuna River. A blue curved line provides clear visual distinction.
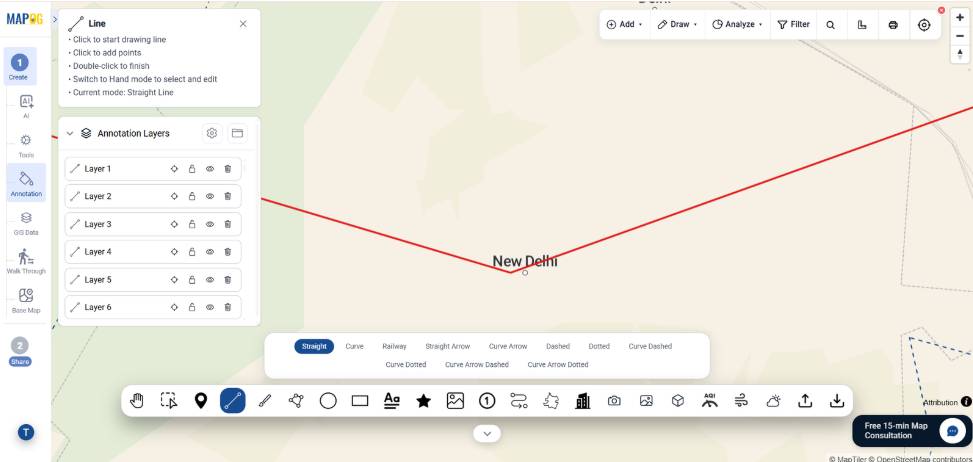
Straight Line
Similarly, a Straight Line is best used to represent highways, transportation corridors, or planning axes connecting multiple locations. A red solid line works well for proposed expressways and major road networks.
Railway Line
A Railway Line displays railway infrastructure or metro corridors. Styling it in purple helps distinguish rail networks from road infrastructure.
Straight Arrow
A Straight Arrow indicates movement or direction, making it ideal for commuter flow, traffic movement, logistics routes, or evacuation plans. A green arrow effectively communicates direction.
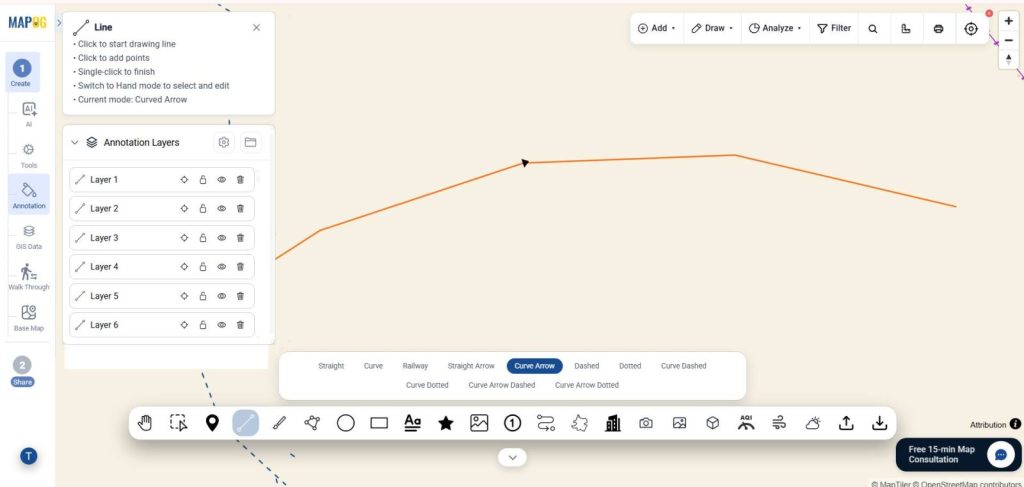
Curved Arrow
A Curved Arrow represents movement along non-linear paths such as river flow, wind direction, migration routes, or traffic diversions. A curved arrow can be used for these applications.
Dotted Line
A Dotted Line is useful for conceptual routes, hiking trails, tourist paths, cycling tracks, or proposed developments that are still under consideration.
Curved Dashed Line
A Curved Dashed Line is suitable for ecological buffers, flood-risk boundaries, environmental protection zones, or hazard areas following irregular geographic shapes. A teal curved dashed line clearly distinguishes these planning regions.
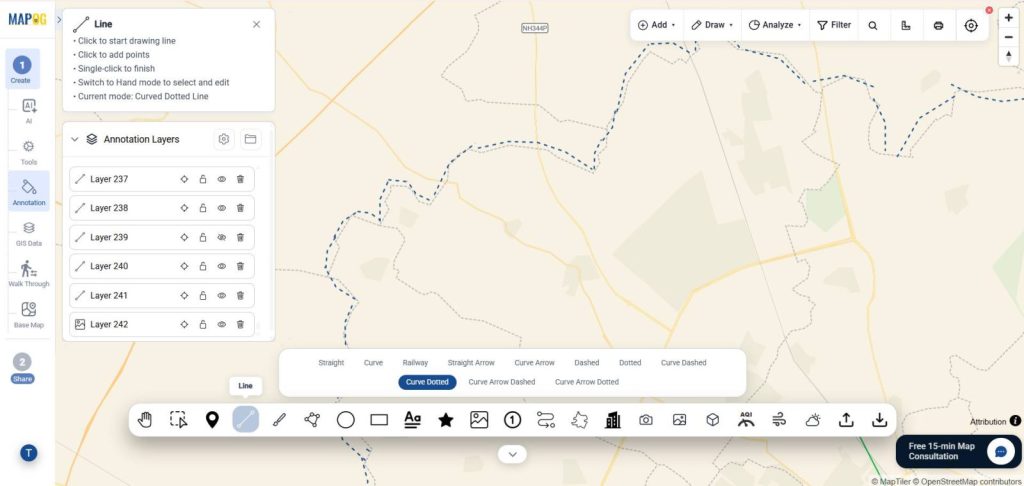
Curved Dotted Line
A Curved Dotted Line illustrates survey routes, inspection corridors, temporary planning alignments, or field visit paths.
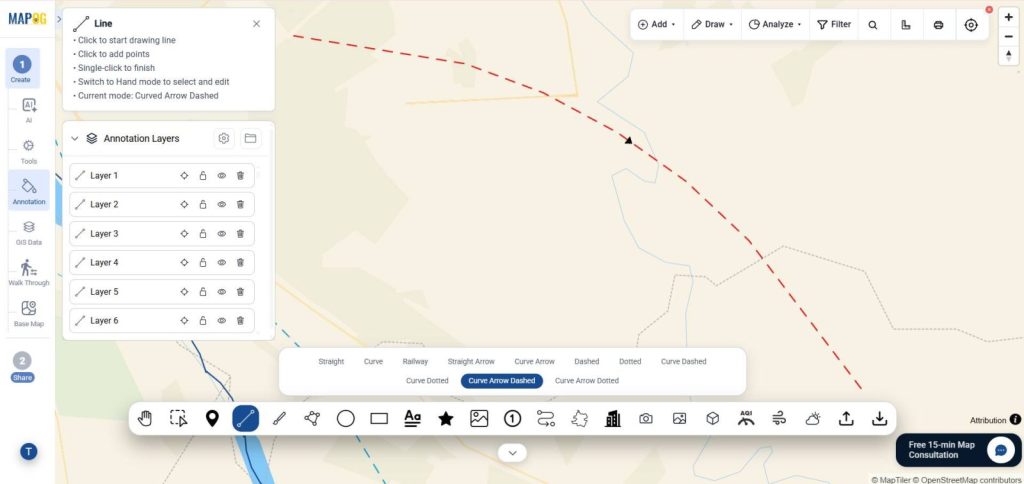
Curved Arrow Dashed Line
A Curved Arrow Dashed Line represents projected movement patterns, future transportation corridors, predicted urban expansion, or anticipated development trends.
All annotation layers remain editable and can be repositioned, recolored, or restyled at any time.
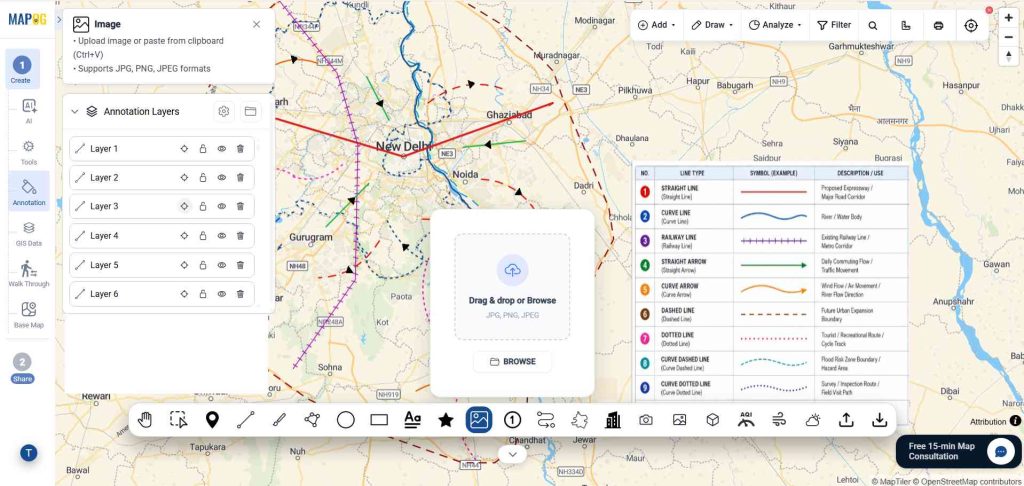
Step 3: Add Legends
Once all annotations are complete, upload or create a Legend explaining each annotation style. As a result, viewers quickly understand the meaning of every line type without additional explanation.
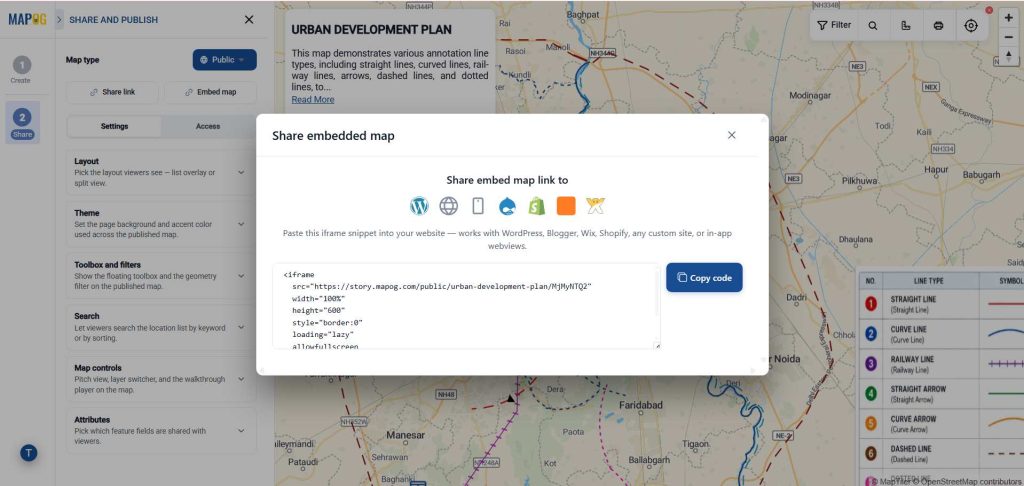
Step 4: Preview and Share
Once your map is complete, before publishing , review all annotations and make any necessary adjustments.
Finally click Preview & Share to publish your project and choose the appropriate sharing option.
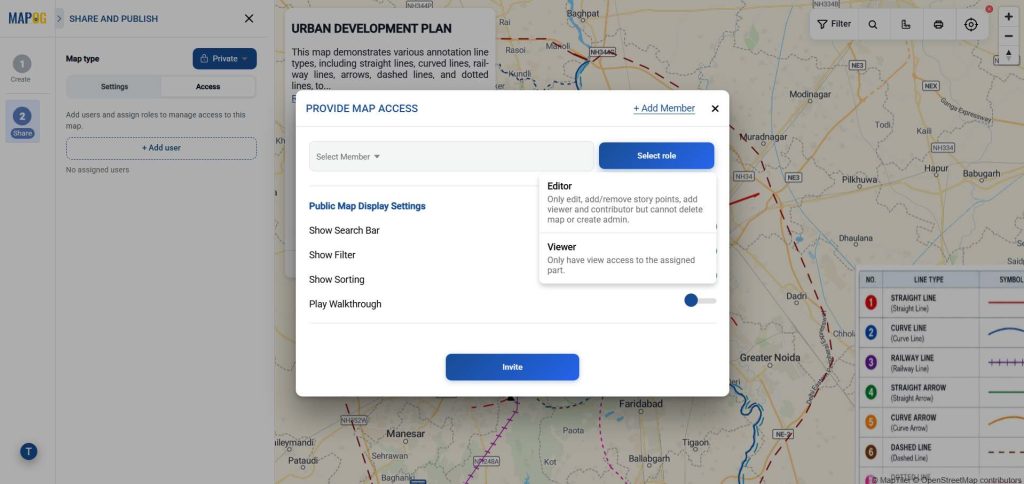
Interactive annotation maps can be presented to planning teams, government agencies, educational institutions, researchers, clients, and project stakeholders for discussion and analysis.
Real-Life Applications of Annotation Maps
Urban Development : For example to visualize transportation corridors, zoning plans, redevelopment projects, and future urban expansion areas.
Traffic Analysis : Display traffic flow, logistics routes, and commuter movement using directional arrows.
Environmental Management : Represent rivers, ecological buffers, flood-risk zones, conservation boundaries, and environmental planning areas.
Educational Projects : Finally we can create thematic maps that explain geographic concepts, GIS workflows, and spatial relationships for teaching and research.
Conclusion
In conclusion, annotation lines transform ordinary maps into powerful visual communication tools by clearly representing infrastructure, movement patterns, planning boundaries, and natural features. Moreover, MAPOG enables users to create customized, interactive maps that support urban planning, GIS analysis, environmental management, transportation planning, and data-driven decision-making. Additionally, its intuitive annotation tools simplify the process of creating clear, informative, and visually engaging maps. As a result, users can effectively communicate complex spatial information, improve map readability, and enhance collaboration across different projects. Whether you are a student, planner, researcher, or GIS professional, MAPOG provides the flexibility to create professional annotation maps for a wide range of applications. Ultimately, choosing the right types of map lines helps transform geographic data into meaningful insights, making planning, analysis, and decision-making more accurate and efficient.
Here are some other blogs you might be interested in :
How to Map Your Complete Cycling Journey with Breakpoints, Photos & Route Lines
GIS in Land use and Zoning analysis for better city planning